
Translate this page into:
Immediate changes in cardiac autonomic tone and stroke volume during microgravity simulation using head-down tilt
-
Received: ,
Accepted: ,
How to cite this article: Shankhwar V, Singh D, Deepak KK. Immediate changes in cardiac autonomic tone and stroke volume during microgravity simulation using head-down tilt. Indian J Physiol Pharmacol 2021;65(2):86-93.
Abstract
Objectives:
Gravity plays an important role in the day-to-day functioning of the cardiovascular system (CVS) in the human body. The absence of gravity severely affects CVS functioning. Out of existing simulation models of microgravity, the 6° head-down tilt (HDT) is frequently used analog to replicate the physiological effects of microgravity on earth.
Materials and Methods:
The present study has been designed to determine the specificity of 6° HDT usage as a microgravity simulation. The heart rate variability (HRV), blood pressure (BP), cardiac output (CO), and stroke volume (SV) responses to 5 min exposures were investigated for 4°, 6°, and 8° HDT. It was hypothesized that the graded HDT around 6° will demonstrate reversal of autonomic parameters. The study was conducted on 28 male subjects aged 20–30 years.
Results:
The study reveals that there was a significant rise in diastolic and mean BP at 6° and 8° HDT as compared to baseline. It was also observed that the high-frequency power in HRV was increased at 6° HDT (P = 0.026), with a concomitant reduction in the low-frequency power (P = 0.03) of HRV. The CO was increased at 6° and 8° HDT as compared to baseline (P = 0.037 and 0.021, respectively). There were no significant changes observed in any of the recorded parameters at 4° HDT. The cardiopulmonary volume receptors might have sensed the blood volume change in HDT as in microgravity simulation the blood passively shifts to cephalad. To overcome the low blood volume problem, the heart tried to pump extra blood through increased CO. At 8° HDT, it was observed that the cardiac sympathetic activity and CO were increased, which is not observed during microgravity exposures.
Conclusion:
The study suggests that 6° head-down-tilt is the best tilt level for producing microgravity on earth to study immediate cardiovascular parameters as it is a balanced compromise of increased vagal activity and CO without activation of cardiac sympathetic activity. Therefore, our data provide physiological evidence in support of 6° HDT microgravity simulation for the study of immediate cardiovascular responses.
Keywords
Head-down tilt
Microgravity analogue
Six degree tilt
Cardiovascular
Cardiac output

INTRODUCTION
Gravity plays a key role in the proper functioning of the entire organ system of the human body.[1,2] The gravity-free environment, that is, microgravity is found to have adverse effects on the cardiovascular control system and weakening of heart muscles.[3] Similar effects were observed in the patients who are on prolonged bed rest due to injury.[4,5] The ill-effects due to microgravity are very harmful to humans; hence, there is a need to investigate the influence of microgravity on the cardiovascular system. The real-life space and microgravity related experiments pose a variety of practical limitations that restrict the research in the field. Ground-based experiments and software simulations are commonly used which can mimic the results of microgravity exposure in humans.[6-8] The widely used analog for replicating the physiological effects of spaceflight on earth is the head-down tilting (HDT) bed rest, where the subject lies on a bed tilted head-down (usually 6° from the horizontal).[7,9,10] So far 6° HDT has been a frequently used model for weightlessness for fluid redistribution.[11,12] It facilitates the elimination of the influence of gravity on the human body, leading to the zeroing of hydrostatic gradient from head to bottom, thereby allowing fluid to be translocated from the lower to the upper body, equivalent to the microgravity effects found in astronauts.[13] Arbeille et al. (1998) studied 4-days of HDT, where no major changes were observed in eight healthy volunteers.[14] Fu et al. (2000) studied 6° HDT to observe its effect on the cardiovascular system and found that mean arterial pressure did not change, heart rate (HR) decreased by 9%, stroke volume (SV) and cardiac output (CO) were increased significantly.[11] Arbeille et al. (2001) in another study observed an increase in cerebral artery resistance and a decrease in the middle cerebral artery mean flow velocity during HDT.[15] Pavy-Le Traon et al. (2007) reported cephalad fluid shifts during 6° HDT.[16] Gelinas et al. (2014) observed a significant increment in arterial BP in 21 healthy young adults during HDT.[17] However, there is a lack of data and a few reported studies available in the literature on the effect of microgravity exposure on comparing the autonomic changes induced by various angles of the HDT simulation process. Hence, the present study has been designed to study the effect of various head-down tilt (HDT) bed rest (4°, 6°, and 8°) levels. To access the autonomic and other physiological changes in the subject’s electrocardiography (ECG), BP, CO, and SV were recorded non-invasively. ECG was further processed to derive heart rate variability (HRV) and it was analyzed in the time, frequency, and non-linear domain. In the non-linear domain, SD1, SD2, Shannon Entropy, approximate entropy, and sample entropy were analyzed.[18] The Fourier transform was used to evaluate the PSD because Fourier spectrum analysis is the foundation for almost every spectral-estimation equipment including FFT and compressive spectrum analyzer. Welch’s procedure was used to calculate the spectral density.[19] It was used to measure the signal power at various frequencies. This approach is based on the principle of converting a signal from time to frequency domain using the periodogram spectrum estimation. Welch’s approach eliminates noise in the predicted power spectra rather than frequency resolution, and this technique is faster than the traditional periodogram spectrum estimation method. PSD was divided into two frequencies: (1) Low-frequency (LF) band: 0.04–0.15 Hz; and (2) high-frequency (HF) band: 0.15–0.4 Hz
LF and HF can be expressed as relative or absolute power. HF is meant for parasympathetic activity (the index of vagal activity). The value in the LF portion provides a sympathetic activity index with slight vagal modulation. The LF/HF ratio has been used as an instant sympathovagal balance symbol.[18,20] The advantage of expressing relative power into the normalized unit (n.u.) allows us to compare the frequency domain parameters of two individuals despite wide variation in LF, HF and total power among healthy, unhealthy, and age-matched individuals. The objective of the present study was to investigate the immediate cardiovascular autonomic responses during graded HDT of 4°, 6°, and 8°. These three HDTs were used to determine the specificity of the use of 6° as a microgravity simulation model. It was hypothesized that graded HDT around 6° would demonstrate reversal of cardiovascular autonomic parameters.
MATERIALS AND METHODS
Subjects recruitment
The investigation was performed on 30 healthy male subjects aged 20–30 years with an average age of 24 ± 3.87 years. The subjects chosen for the study were healthy volunteers, non-smokers, and non-drinkers. Subjects who had undergone any medication or had suffered from any cardiovascular disease, diabetes, neurological disorders, or any other type of illness that could affect the functioning of the autonomic nervous system had not been considered in the investigation. Subjects were informed about the procedure of data collection and a consent form was obtained before recording. All procedures performed on subjects were as per the ethical standards of the responsible committee on human experimentation having approval letter no. 2018846 of Dr. B. R. Ambedkar National Institute of Technology, Jalandhar, India.
Experimental protocol
All the recording was carried out between 4.00 p.m. and 6.00 p.m. in the institute’s bio-medical lab, where the temperature was kept constant. Subjects were advised not to consume food 3 h before participation in the recording. The room temperature during the recording sessions was in the range of 22–24°C. All tests were conducted on the tilt table in the subject’s supine condition. The ECG and BP were recorded using Biopac® MP100 and NIBP 100B (Biopac Systems, Inc., Goleta, CA). CO and SV were recorded using the non-invasive monitoring of cardiac output monitoring device (NICOMON) device (Larsen and Toubro Ltd, India). ECG was used for recording the electrical activity of the heart using electrodes placed on the skin in lead II configuration.
At the beginning of each experiment, a 20-min rest in supine position was given to each subject. Then, baseline recording of 7 min was recorded in supine position. After the baseline recording, HDT was progressively increased from supine to 4°, 6°, and 8°. Each HDT step lasted for 7 min each with a recovery period of 10 min in between [Figure 1]. Physiological parameters were continuously recorded and stored in a personal computer for analysis. The delta change was calculated, (delta change = value of the parameter at respective HDT - value of the parameter at baseline) the baseline has been used as a reference value for measuring increment (delta change is “+ve”) and decrement (delta change is “ −ve”).
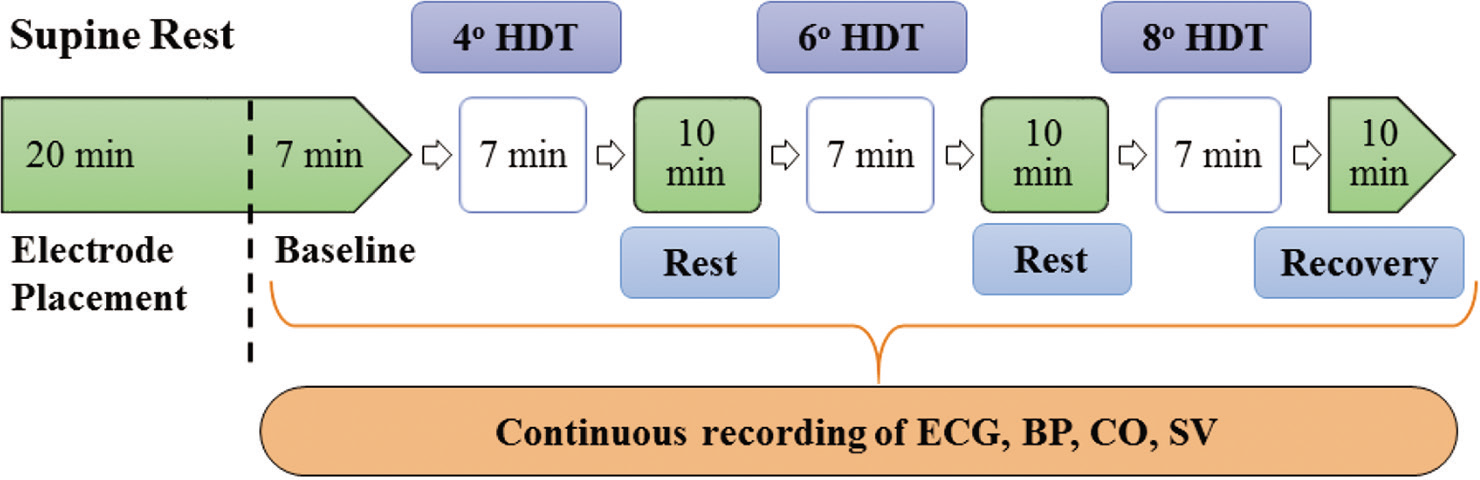
- Schematic representation of the study protocol. HDT: Head-down tilt, ECG: Electrocardiogram, BP: Blood pressure, CO: Cardiac output, SV: Stroke volume.
Tilt table
A motorized tilt-table was used and the subject position was secured with three 4-inch positioning straps to keep the subject in a comfortable position. The tilting table has a non-slip mattress with cushioned footboard. During the entire procedure, the subjects were observed for any discomfort.
BP and ECG processing
BP was observed with a non-invasive BP monitor based on the tonometric measurement technique. The tonometric sensor estimates the pressure in the radial artery at the wrist. The BP sensor was positioned over the radial artery in the forearm. This appliance utilizes a “sweep” technique which applies a varying force on the radial artery. The counter pressure generated signal which digitized and used for calculating the parameters for BP. Parameters are extracted from the waveforms and a set of coefficients is applied to them yielding systolic BP (SBP), diastolic BP (DBP), and mean BPs (MBP) approximately every 15th heart beats. The ECG was used to measure the electrical activity and muscle ability of the heart. Further ECG was used to derive HRV for the quantification of the parasympathetic and sympathetic nervous tonic influences.
NICOMON
We used impedance plethysmography (NICOMON, L and T Medical, India) that uses four pairs of electrodes to calculate blood flow dynamics.[21] Two pairs of surface electrodes (I1, I2) are for transmitting the current and two are detecting electrodes (V1, V2) [Figure 2]. Two pairs of current-injection electrodes provided 4 mA alternating current with one (I1) 5 cm above the neckline and another 5 cm away from the lower sternum end (I2). Sensing electrodes were mounted at the neckline (V1) and the end of the sternum (V2). SV was determined by measuring the impedance shift produced by the pulsatile flow and the time intervals between the changes.[22]
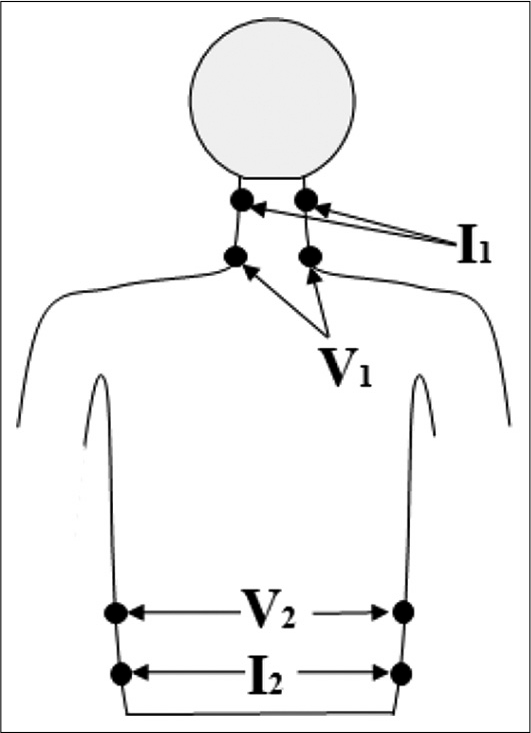
- Placement of electrodes (I1, I2, V1, and V2) on the body surface for the determination of cardiac output.
The SV was calculated from the impedance signal obtained from the inner pair of electrodes using the equation as: [23]
where
ρ = resistivity of blood in Ω-cm
L = distance between two sensing electrodes in cm
Z0 = mean basal thoracic impedance in Ω, (dz/dt)
m = maximum rate of change of impedance in Ω/sec
VET can be obtained from the dZ/dt versus time curve
The CO was determined to be the product of SV and HR. The CO monitor measures the volume of the stroke automatically and averaged it for ten cardiac cycles.
Statistical analysis
The Shapiro-Wilk and Kolmogorov-Smirnov analyses were performed to test the normality of the data. The statistical analysis was employed on the data using Statistical Package for Social Sciences (SPSS Version 10.0). For all HDT sessions, repeated measures analysis of variance (ANOVA) with Bonferroni post hoc tests was used. The statistical significance standard was set at P < 0.05.
RESULTS
The data presented here are from 28 healthy subjects. The data of two subjects were excluded from analysis due to signal artifacts. The results of physiological parameters BP, ECG, CO, and SV during exposures to the varying °s of HDT are presented below. BP signals were analyzed and an average value was taken for the entire period of 7 min. The statistical analysis such as ANOVA and post hoc test was performed on those parameters that passed the normal distribution test.
BP response
The SBP, MBP, and DBP values showed no significant change at 4° HDT as compared to baseline. At 6° HDT, there was a significant increment of 0.41 mmHg in SBP as compared to 4° HDT values (P = 0.01) as shown in [Figure 3]. It was also observed that MBP significantly increased by 1.51 mmHg (P = 0.02), whereas DBP values significantly increased by 1 mmHg when compared with baseline values (P = 0.01).

- Systolic, mean and diastolic blood pressure responses to 4°, 6°, and 8° head-down tilt (HDT). (n=28), Values expressed as mean±SD, P<0.05, considered as significant difference. “*” indicates the significant difference between baseline and 4° HDT or 6° HDT or 8° HDT or recovery, “#” indicates the significant difference between 4° and 6° HDT, “$” indicates the significant difference between 6° and 8° HDT, “¥” indicates the significant difference between 4° and 8° HDT.
At 8° HDT, SBP showed a significant increment of 4.28 mmHg as compared with 4-° HDT values (P = 0.006). Whereas, the DBP showed an increment of 3.23 mmHg and 1.93 mmHg as compared to 4° HDT and baseline values (P = 0.03 and P = 0.01, respectively).
HRV parameters
Time-domain parameter values showed no significant variation for any HDT [Table 1]. In the frequency domain, no significant changes were observed for 4° HDT as compared to baseline. At 6° HDT, a significant increment in HF values was observed as compared with baseline (P = 0.03) as well as 4° HDT (P = 0.02) (47.56 ± 4.07, 45.6 ± 5.81, and 47.21 ± 7.06 n.u., respectively). Whereas, significant decrement in LF was observed as compared with baseline (44.02 ± 6.12 and 45.9 ± 6.72 n.u., respectively).
| Parameters | 0° (Baseline) | 4° HDT | 6° HDT | 8° HDT | 0° (Recovery) |
|---|---|---|---|---|---|
| Mean RR (ms) | 861.56±120.29 | 941.9±81.85 | 887.9±163.05 | 747.6±119.54 | 821.9±150.05 |
| SDNN (ms)£ | 75.5 (35.5–98.56) | 67.7 (50.5–90.04) | 90 (60.11–110.23) | 49.2 (25.24–75.97) | 71 (45.54–110.18) |
| Mean HR (bpm/min) | 69.23±12.47 | 64.03±7.61 | 68.36±17.65 | 80.61±10.71 | 73.01±15.62 |
| RMSSD (ms) | 50.47±11.52 | 52.8±5.3 | 52.4±14.75 | 41.3±11.20 | 43.2±13.11 |
| NN50 (count)£ | 250 (221.05–287.65) | 214 (180.24–172.66) | 303 (214.17–398.87) | 285 (247.19–345.9) | 259 (212.56–310.81) |
| pNN50 (%)£ | 15.68 (3.01–24.84) | 36.2 (28.3–42.9) | 29.9 (12.4–37.21) | 21.3 (11.7–30.6) | 13 (11.2–16.52) |
| RR triangular index£ | 19 (12.1–25.4) | 16 (11.5–24.39) | 21 (13.8–27.22) | 11 (9.9–15.34) | 15 (11.78–19.51) |
| LF/HF ratio | 0.863±0.37 | 0.69±0.23 | 0.780±0.25* | 1.22±0.28* | 0.987±0.24 |
| Total power (ms2)£ | 3544 (4532–1377) | 2626 (3344–778) | 2574 (3149–1657) | 2493 (3558–1430) | 2208 (3045–1066) |
| SD1 (ms) | 44.3±6.80 | 37.4±4.07 | 37.1±4.97 | 29.2±5.05 | 27.9±4.02 |
| SD2 (ms)£ | 84.8 (63.71–95.84) | 88.2 (75.25–101.52) | 121.9 (92.79–135.2) | 63.2 (40.61 – 83.18) | 60.6 (37.4–90.07) |
| Shannon entropy | 2.617±0.56 | 3.332±0.51 | 3.584±0.32 | 2.96 ± 0.42 | 3.135±0.34 |
| Approximate entropy | 1.111±0.14 | 1.101±0.15 | 1.365±0.11 | 1.272 ± 0.10 | 1.151±0.12 |
| Sample entropy | 1.702±0.32 | 1.659±0.20 | 1.406±0.25 | 1.896 ± 0.15 | 1.767±0.16 |
(n=28, Values expressed as Mean±SD or Median (Interquartile range depending on normality of distribution of data), “£” indicates non-normalized data. P<0.05, considered as significant difference. “*” indicates the significant difference between baseline and 4° HDT or 6° HDT or 8° HDT or recovery, HDT: Head-down tilt, HR: Heart Rate, LF: Low-frequency, HF: High-frequency
At 8° HDT, significant decrement was observed in HF power values as compared from baseline (P = 0.02) as well as 4° HDT (P = 0.012) (44.37 ± 6.07, 45.6 ± 7.54, and 45.9 ± 4.41 n.u., respectively). The LF/HF significantly decreased at 6° HDT, whereas, it increased at 8° HDT [Figure 4].
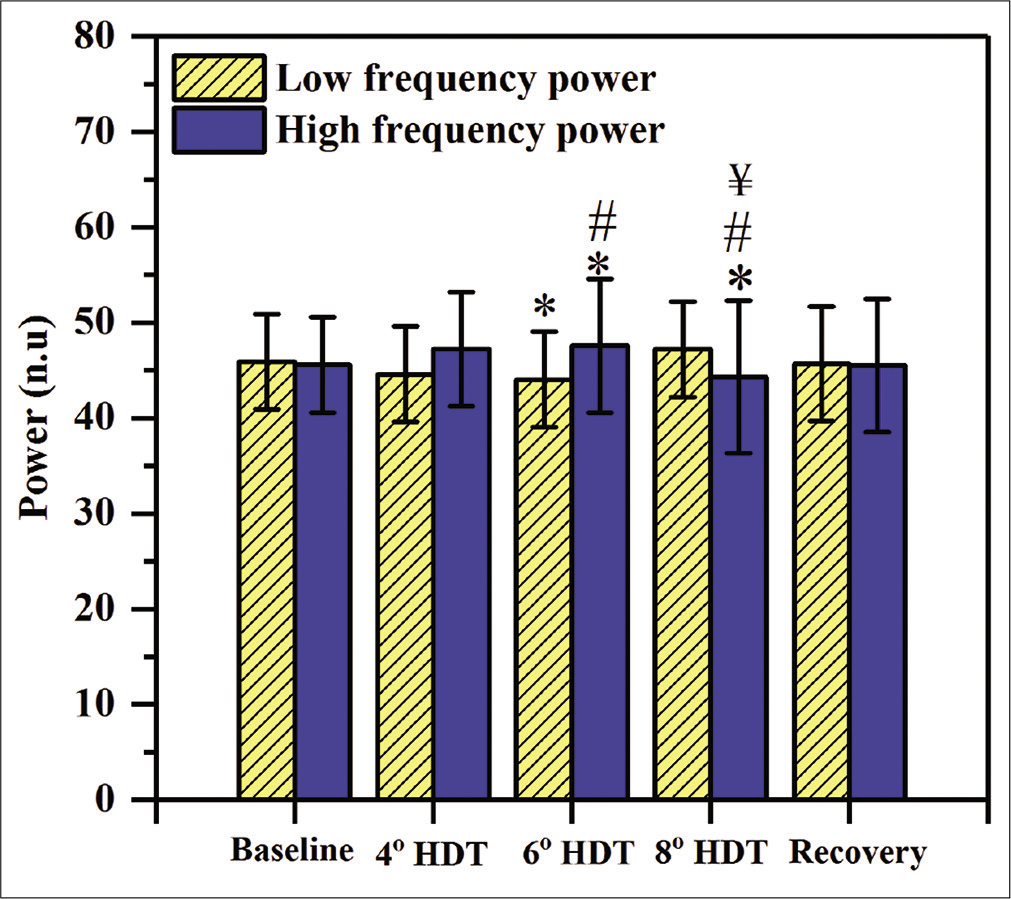
- Heart rate variability (HRV) responses to 4°, 6°, and 8° head-down tilt (HDT). LF and HF power of HRV depicted in yellow and blue color, respectively. (n=28), Values expressed as mean±SD, P<0.05, considered as significant difference. “*” indicates the significant difference between baseline and 4° HDT or 6° HDT or 8° HDT or recovery, “#” indicates the significant difference between 4° and 6° HDT, “$” indicates the significant difference between 6° and 8° HDT, “¥” indicates the significant difference between 4° and 8° HDT.
CO and SV
The CO values showed no significant change at 4-° HDT as compared with baseline. At 6° HDT, there was a significant increment of 50 ml/min and 10 ml/min as compared to baseline (P = 0.037) and 4° HDT (P = 0.03), respectively [Figure 5a]. At 8° HDT, it increased significantly by 60 ml/min, 20 ml/min and 10 ml/min as compared to baseline (P = 0.02), 4° (P = 0.025), and 6° (P = 0.03) HDT, respectively.
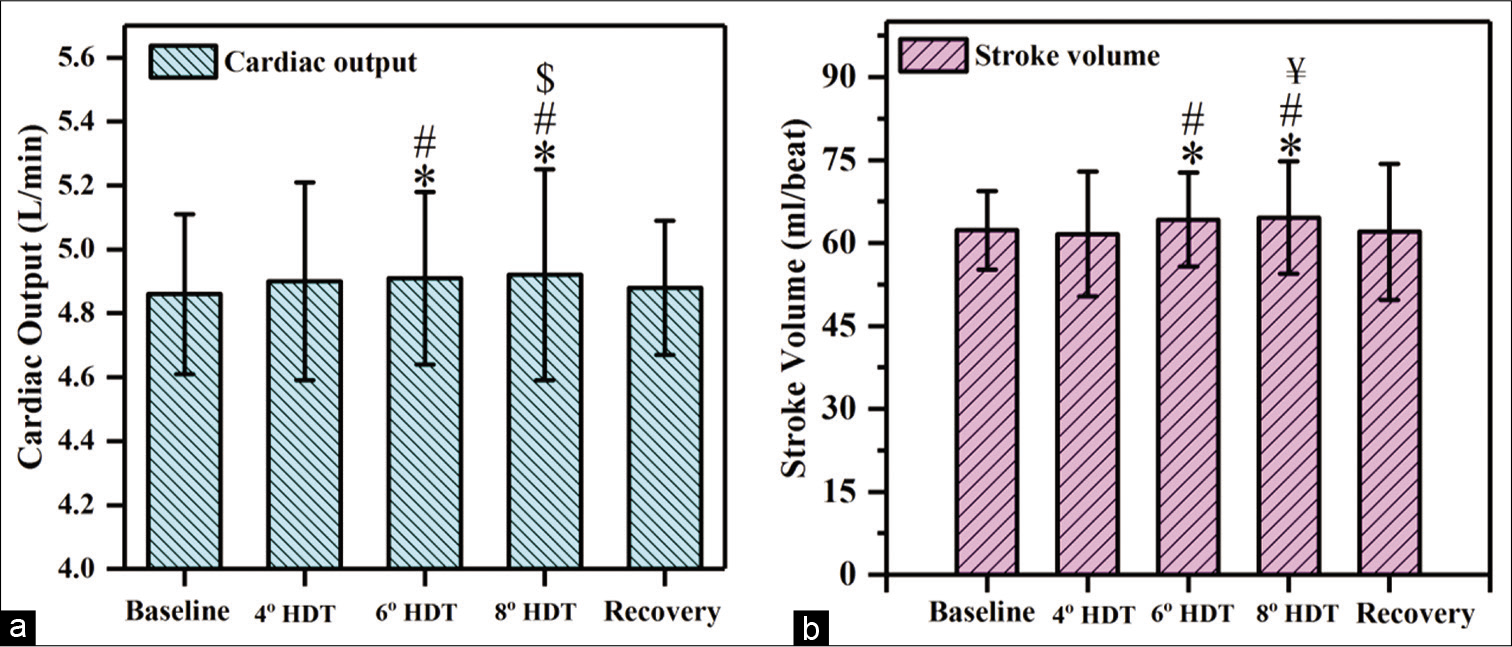
- Responses observed in (a) cardiac output and (b) stroke volume at 4°, 6°, and 8° head-down tilt (HDT). (n=28), Values expressed as mean±SD, P<0.05, considered as significant difference. “*” indicates the significant difference between baseline and 4° HDT or 6° HDT or 8° HDT or recovery, “#” indicates the significant difference between 4° and 6° HDT, “$” indicates the significant difference between 6° and 8° HDT,“¥” indicates the significant difference between 4° and 8° HDT.
The SV did not show any significant difference at 4-° HDT as compared to baseline. At 6° HDT, the SV increased significantly by 2.1 ml/beat and 2.6 ml/beat as compared to baseline (P = 0.018) and 4° (P = 0.02) HDT, respectively. At 8° HDT, there was a significant increment of 2.3 ml/beat, 3.0 ml/beat, and 0.4 ml/beat as compared from baseline (P = 0.009), 6 (P = 0.03), and 8° (P = 0.03) HDT, respectively, [Figures 5b and 6].
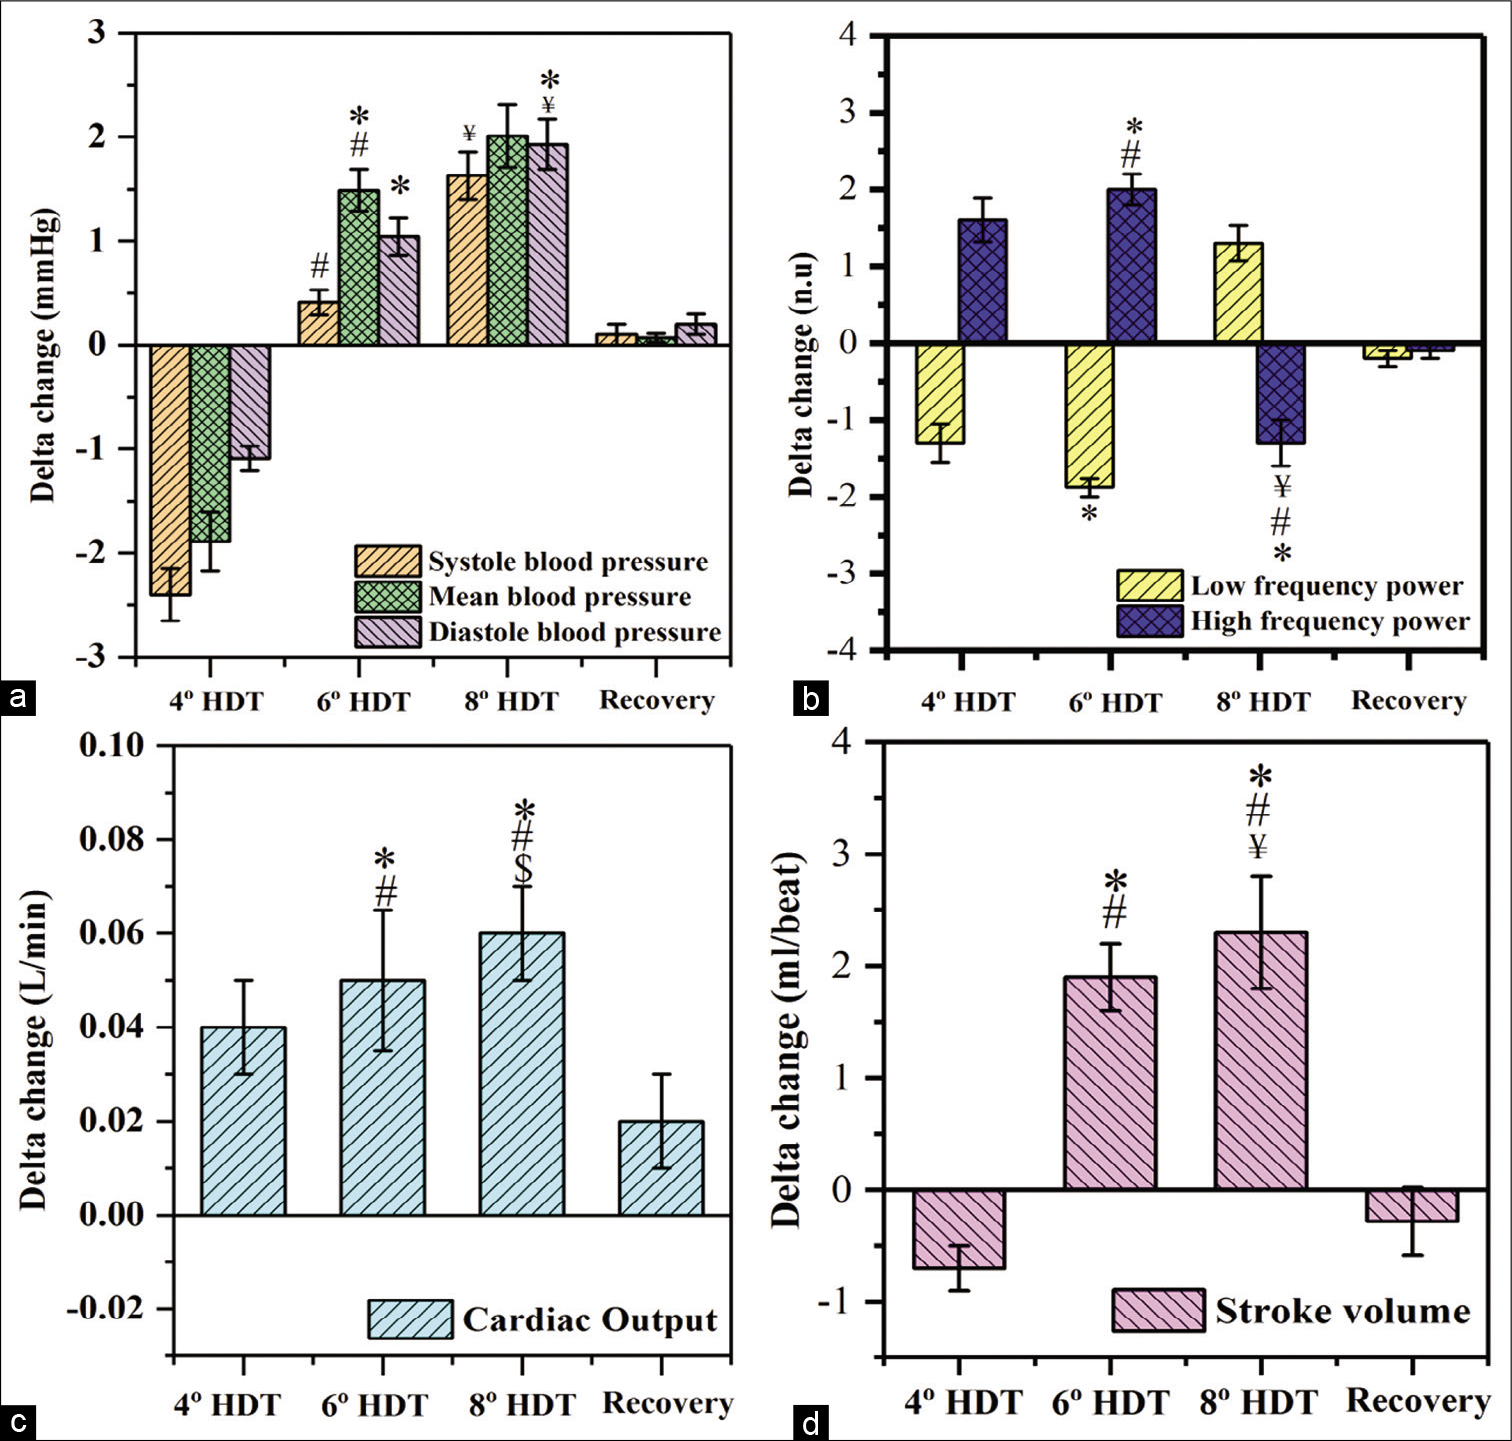
- Delta changes observed in (a) blood pressure, (b) low and high frequency power, (c) cardiac output and (d) stroke volume. (delta change = value of the parameters at respective head-down tilt [HDT] – value of the parameter at baseline) (n=28), Values expressed as mean±SD, P<0.05, considered as significant difference. “*” indicates the significant difference between baseline and 4° HDT or 6° HDT or 8° HDT or recovery, “#” indicates the significant difference between 4° and 6° HDT, “$” indicates the significant difference between 6° and 8° HDT, “¥” indicates the significant difference between 4° and 8° HDT.
DISCUSSION
The study compared cardiac autonomic activity and cardiovascular response during 5 min of various HDT exposures in healthy subjects. The responses were significant for 6° and 8° HDT but not at 4° HDT exposure.
Interestingly, at 6° HDT, there was a decrease in LF power (n.u.) as compared to baseline, which indicates the reduction in the sympathetic component of the autonomic nervous system. Similar results were also reported by Fu et al. (2000); they observed a significant decrement in the sympathetic nervous system during 6° HDT.[9] Knitelius and Stegemann also showed an increment in SV during 6° HDT exposure of 5 min.[24] Similarly, Butler et al. (1990) reported a rise in CO in the 1st min of 6° HDT.[25] Manjunath and Telles, 2003, revealed that Sirsasana (head stand practice) in Yoga is also an example for the head-down tilt posture.[26] They observed an increase in the LF and a decrease in HF power of the HRV spectrum. However, in the present study of 6° HDT, the decrease in the LF and an increase in HF power were observed. Shirshasana induces an enormous pressure change, that is, reversal of the gravitational gradient from head to toe. Therefore, the results are different for HDTs. This also explains why only 6° HDT is considered as microgravity simulation.
Moreover, at 6° HDT the passive changes in beat-to-beat pre-loads and afterloads (cardiopulmonary receptors or starling phenomenon) results in increased myocardial contractility which gets reflected in the increased SBP or may be due to the cardiopulmonary baroreflex stimulation. Further, increased central circulatory hypervolemia (starling phenomenon) may be caused by acute HDT that increased central venous pressure, increased preload, increased myocardial contractility, increased SV, CO, and SBP. This further results in an increased vagal drive to the myocardium along with the concomitant decrease in the cardiac sympathetic drive. This was also revealed by the LF/HF ratio, which was significantly decreased and shows the shift in the sympathovagal balance. We believe that the changes are mediated by a non-baroreflex mechanism as the stimulus appears to be non-hypertensive, as significant changes in BP were not observed. This may involve changes in volume and thus atrial volume receptors may be operating.
At 8° HDT, it was observed that sympathetic activity increased [Figure 6]. This may be due to the activation of the corrective mechanism for restoring blood volume in the lower extremity. At 8°, LF was high due to blood volume shift and cardiopulmonary volume changes were sensed by respective receptors. These receptors might have triggered the sympathetic system as a corrective measure, which exists in humans for monitoring the blood volume shift.[27,28] On comparing with the baseline values, a rise in SBP and DBP was observed as a response from the baroreflex loop, which always monitors the body and performance correction for attaining homeostasis. LF/HF ratio also confirms that the sympathetic activity was high, even though the SV and CO were highest for 8° HDT. However, this HDT cannot be used as a microgravity simulation because the autonomic controls are not in equilibrium. Furthermore, here the parameters were not similar to microgravity effects observed in reality.[11]
The cardiovascular variations because of the pooling of blood cause a drop in the venous pressure which leads to the initiation of several corrective mechanisms during HDT. The possible mechanisms appear to be mediated through the cardiopulmonary receptors (non-baroreflex mechanisms), baroreflex, and their interactions which need to be further investigated.
CONCLUSION
We report the immediate cardiovascular changes and autonomic drive at 5-min exposure to 4°, 6°, and 8° HDT in humans. The results indicate that at 6° HDT, there was an increase in BP, CO, and SV and a decrease in LF power, these changes are very similar to the changes observed during exposure to the microgravity environment. Whereas, there was an increment in BP, LF power, CO, and SV at 8° HDT which is unusual for a microgravity environment. Hence, it can be concluded that 6° HDT is the best possible balanced way for studying the cardiovascular and autonomic systems. Our data justifies 6° HDT as the best analog for microgravity experiments on earth. The 4° and 8° HDT exposures appear under activation and over-activation of zero-gravitational induced changes in cardiovascular mechanisms. The present study results point toward further research at investigating the cardiovascular responses in microgravity conditions and various HDT conditions especially to suit the individual variations in autonomic controls.
Declaration of patient consent
Patient’s consent not required as there are no patients in this study.
Financial support and sponsorship
Nil.
Conflicts of interest
There are no conflicts of interest.
References
- Gravity mechanisms in tonic motor system. Neurophysiological and muscle aspects. Hum Physiol. 2017;43:578-90.
- [CrossRef] [Google Scholar]
- Effect of novel designed bodygear on gastrocnemius and soleus muscles during stepping in human body. Microgravity Sci Technol. 2021;33:1-10.
- [CrossRef] [Google Scholar]
- Space physiology VI: Exercise, artificial gravity, and countermeasure development for prolonged space flight. Eur J Appl Physiol. 2013;113:2183-92.
- [CrossRef] [Google Scholar]
- Countermeasures against lumbar spine deconditioning in prolonged bed rest: Resistive exercise with and without whole body vibration. J Appl Physiol. 2010;109:1801-11.
- [CrossRef] [Google Scholar]
- Human locomotion in hypogravity: From basic research to clinical applications. Front Physiol. 2017;8:1-18.
- [CrossRef] [Google Scholar]
- Modelling and simulation of carotid artery in microgravity. Proceedings of IEEE International Conference on Signal Processing In: Computing and Control. 2019. p. :339-41.
- [CrossRef] [Google Scholar]
- Impacts of microgravity analogs to spaceflight on cerebral autoregulation. Front Physiol. 2020;11:1-12.
- [CrossRef] [Google Scholar]
- Fifty years of human space travel: Implications for bone and calcium research. Annu Rev Nutr. 2014;34:377-400.
- [CrossRef] [Google Scholar]
- Analogs of microgravity: Head-down tilt and water immersion. J Appl Physiol. 2016;120:904-14.
- [CrossRef] [Google Scholar]
- Effects of long-term head-down-tilt bed rest and different training regimes on the coagulation system of healthy men. Physiol Rep. 2013;1:1-13.
- [CrossRef] [Google Scholar]
- A comparison of autonomic responses in humans induced by two simulation models of weightlessness: Lower body positive pressure and 6 degrees head-down tilt. J Auton Nerv Syst. 2000;80:101-7.
- [CrossRef] [Google Scholar]
- Long-duration bed rest as an analog to microgravity. J Appl Physiol. 2016;120(1985):891-903.
- [CrossRef] [Google Scholar]
- Effects of resistance exercise and nutritional supplementation on dynamic cerebral autoregulation in head-down bed rest. Front Physiol. 2019;10:1-11.
- [CrossRef] [Google Scholar]
- Femoral to cerebral arterial blood flow redistribution and femoral vein distension during orthostatic tests after 4 days in the head-down tilt position or confinement. Eur J Appl Physiol Occup Physiol. 1998;78:208-18.
- [CrossRef] [Google Scholar]
- Adaptation of the left heart, cerebral and femoral arteries, and jugular and femoral veins during short-and long-term head-down tilt and spaceflights. Eur J Appl Physiol. 2001;86:157-68.
- [CrossRef] [Google Scholar]
- From space to Earth: Advances in human physiology from 20 years of bed rest studies (1986-2006) Eur J Appl Physiol. 2007;101:143-94.
- [CrossRef] [Google Scholar]
- Influence of posture on the regulation of cerebral perfusion. Aviat Space Environ Med. 2012;83:751-7.
- [CrossRef] [Google Scholar]
- Monitoring patients during neurorehabilitation following central or peripheral nervous system injury: Dynamic difficulty adaptation In: ECG Time Series Variability Analysis: Engineering and Medicine. United States: CRC Press; 2017. p. :281-96.
- [CrossRef] [Google Scholar]
- Investigation of heart rate variability with the help of welch periodogram in indian young adults based on body physique In: Smart Healthcare for Disease Diagnosis and Prevention. Amsterdam: Elsevier; 2020. p. :51-7.
- [CrossRef] [Google Scholar]
- An overview of heart rate variability metrics and norms. Front Public Health. 2017;5:1-17.
- [CrossRef] [Google Scholar]
- Cardiac output assessment by transthoracic electrical bio-impedance in patients of acute myocardial infarction: Comparative analysis with Echocardiography. Indian J Physiol Pharmacol. 2016;60:108-12.
- [Google Scholar]
- New method of electrode placement for determination of cardiac output using impedance cardiography. Indian J Physiol Pharmacol. 2006;50:234-40.
- [Google Scholar]
- Development and evaluation of an impedance cardiac output system. Aerosp Med. 1966;37:1208-12.
- [Google Scholar]
- Heart volume during short-term head-down tilt (-6 degrees) in comparison with horizontal body position. Aviat Space Environ Med. 1987;58:61-3.
- [Google Scholar]
- Cardiovascular response to 4 hours of 6 degrees head-down tilt or of 30 degrees head-up tilt bed rest. Aviat Space Environ Med. 1990;61:240-6.
- [Google Scholar]
- Effects of sirsasana (headstand) practice on autonomic and respiratory variables. Indian J Physiol Pharmacol. 2001;47:9-17.
- [Google Scholar]
- Short-term cardiovascular oscillations in man: Measuring and modelling the physiologies. J Physiol. 2002;542:669-83.
- [CrossRef] [Google Scholar]
- Model-based assessment of baroreflex and cardiopulmonary couplings during graded head-up tilt. Comput Biol Med. 2012;42:298-305.
- [CrossRef] [Google Scholar]


