
Translate this page into:
Short-term effects of passive listening to an Indian musical scale on blood pressure and heart rate variability among healthy individuals – A randomised controlled trial
*Corresponding author: Kirthana Kunikullaya U, Institut de recherche en santé, environnement et travail (IRSET), University of Rennes 1, Rennes 35000, France. kirthana.rguhs@gmail.com; kirthana.kunikullaya@univrennes1.fr
-
Received: ,
Accepted: ,
How to cite this article: Kunikullaya KU, Vijayadas, Kunnavil R, Goturu J, Prakash VS, Murthy NS. Short-term effects of passive listening to an Indian musical scale on blood pressure and heart rate variability among healthy individuals – A randomised controlled trial. Indian J Physiol Pharmacol 2022;66:29-44.
Abstract
Objectives:
Listening to music is entertaining but also has different health benefits. Music medicine involves passive listening to music, while music therapy involves active music-making. Indian music is broadly classified into Hindustani and Carnatic music, each having its system of musical scales (ragas). Scientific studies of Indian music as an intervention are meagre. The present study determines the effect of passive listening to one melodic scale of Indian music on cardiovascular electrophysiological parameters.
Materials and Methods:
After informed consent, healthy individuals aged 18–30 years of either gender were recruited and randomly divided into two groups (n = 34 each). Group A was exposed to passive listening to the music intervention (Hindustani melodic scale elaboration [Bhimpalas raga alaap]), while Group B received no intervention except for a few natural sounds (played once in every 2 min). Blood pressure (BP, systolic, SBP; diastolic, DBP) and electrocardiogram in Lead II were recorded with each condition lasting for 10 min (pre, during and post). Heart rate variability (HRV) analysis was done. Data were analysed using SPSS 18.0 version and P ≤ 0.05 was considered significant.
Results:
In Group A, the SBP did not change during the intervention but increased mildly after the intervention (P = 0.054). The DBP increased in both the groups during the intervention, significant in Group A (P = 0.009), with an increase of 1.676 mmHg (P = 0.012) from pre-during and 1.824 mmHg (P = 0.026) from pre-post intervention. On HRV analysis, mean NN interval increased and HR reduced in both the groups, but was significant only in Group B (P = 0.041 and 0.025, respectively). In Group A, most of the HRV parameters were reduced during music intervention that tended to return toward baseline after the intervention, but the change was statistically significant for total power (P = 0.031) and low frequency (P = 0.013); while in Group B, a consistent significant rise in parasympathetic indicators (SDNN, RMSSD, total power and HF [ms2]) over 30 min was observed.
Conclusion:
Unique cardiovascular effects were recorded on passive listening to a particular Indian music melodic scale. The scale, raga Bhimpalas, produced a mild arousal response. This could be due to attention being paid to the melodic scale as it was an unfamiliar tune or due to the features of this melodic scale that led to an arousal or excitation response. In contrast, the control group had only a relaxation response. Exploring electrophysiological effects of different genres, melodic scales and their properties after familiarising with the music may thus be illustrative.
Keywords
Indian music
Melodic scale
Blood pressure
ECG
Heart rate variability
acoustic stimulus
music

INTRODUCTION
Music is an aesthetic stimulus that is known to produce specific health benefits. Music as an acoustic stimulus, though used maximally as entertainment, has psychological[1] and physiological benefits. As a result of increased interest and research in this field, musical auditory stimulation is now proposed as a non-pharmacological intervention or as a complementary therapy.[2-4] Music can beneficially affect blood pressure (BP), heart rate (HR), respiration rate (RR) and biochemical parameters.[5-10] One of the initial works exploring the cardiovascular effects of music was in 1918, by Hyde and Scalapino who found a reduction in systolic BP (SBP) and diastolic BP (DBP) when minor tones were used, whereas, the stirring notes of Toreador’s song increased the SBP and HR.[11] Listening to sedative music was shown to reduce HR and BP. BP was shown to be proportional to the crescendo present in music, whereas music with uniform emphasis reduced the BP.[7] A study showed that music was as effective as benzodiazepines in reducing BP.[12] The heart though has an intrinsic pacemaker, it is controlled by the autonomic nervous system, the activity of which can be measured by analysis of heart rate variability (HRV).[13] Several studies reported that under various conditions, music decreases sympathetic nervous system (SNS) and increases parasympathetic nervous system (PNS) activity as measured by HR and HRV, indicating physiological relaxation.[14-18] However, no difference in HR or HRV was observed by a few,[19,20] while an increase was reported by some.[16,21] A few works showed that music decreased low frequency/high frequency (LF/HF) ratio,[18] while a few others showed an increase in LF/HF.[16,21] When music was intervened with random 2 min pauses, it was observed that silence (pauses), that followed the music, induced more parasympathetic stimulation. One Indian track (raga Maru Behag played on Sitar) used by the authors, which had a tempo of 55 beats/min, however, induced a significant large fall in HR.[16] A recent systematic review also concluded that music does have positive effects on the autonomic nervous system.[10]
We thus observe that there is varying literature available on the effects of music on the cardiovascular parameters and the mechanisms behind it. In India, music is predominantly used as entertainment. Indian music is broadly classified into Carnatic (South Indian) and Hindustani (North Indian) music, each with its unique style. Despite ample Vedic literature available on the beneficial health effects of melodic scales/ragas on the human mind and body, scientific evidence for the same is extremely meagre. Ragas, or melodic scale, are permutations and combinations of various notes, in a specific order, to produce a melody that when played/ sung results in the expression of certain emotions and create a specified aesthetic experience.[22,23] (More on music theory, relevant to this article, may be found in the supplementary file, S1 Text).
In ancient Indian music literature, different ragas have been named to control BP.[8,24-26] In our previous study, we showed that BP reduced significantly among pre-hypertensives after passive listening to raga ‘Bhimpalas,’[26] for 15 min a day, for 3 months, along with lifestyle modifications. In that study 24 h ambulatory BP and HRV were recorded once on recruitment and followed up after 3 months. The acute effect of the acoustic musical stimulus on BP or HRV was not explored among healthy individuals,[8,26] under lab conditions. Thus, the present study was taken up with the hypothesis that, acoustic stimulus with raga ‘Bhimpalas,’ under laboratory settings for a duration of 10–15 min of would reduce BP and increase parasympathetic activity analysed through HRV, that would return to baseline after the intervention, among young healthy individuals. The primary objective of the study was to evaluate the short-term change in BP and HRV after passive listening to the acoustic stimulus(Indian melodic scale, Bhimpalas), among healthy young individuals.
MATERIALS AND METHODS
Study design
A prospective, parallel-group, double-blinded, randomised controlled trial was conducted with an experimental study design, with a total sample of 68, randomised into two groups (n = 34 participants in each group) [Figure 1]. The study protocol was approved by the institutional scientific committee on human research and ethical review board (Submission reference: MSRMC/EC/2016; Dated: February 11, 2016; MSRMC/EC/2017; Dated: July 25, 2017). The study period ranged from January 2016 to July 2019 (October 2016 – first recruitment and March 2018 – last recruitment). The research was conducted according to all aspects of the Declaration of Helsinki. An informal consent, to answer the online questionnaire and further participation in the study, was taken. Participants provided written, informed consent to volunteer for the study when they visited the laboratory.

- Consort diagram of participant recruitment, random allocation, data collection and follow-up.
The basis for sample size
The sample size was calculated[27] based on a study conducted by Okada et al.[18] It was found that root mean square standard deviation (RMSSD) of NN intervals on electrocardiogram (ECG) was 17.4 (7.2) ms and 24.1 (15.5) ms before and after music therapy. With an effect size of 0.59 and power of 90% and a confidence interval of 95%, the minimum sample size (using two-tailed test) required for the present study was estimated to be 32, in each group.
Recruitment, inclusion and exclusion criteria
The data were collected from a group of institutions in India comprising of people from different educational backgrounds. In order to avoid cultural differences, only Indians were invited to participate. Healthy participants aged 18–30 years were invited to participate in the study through advertisements on notice boards of various institutions, social media posts and posters. Inclusion criteria were healthy participants, aged 18–30 years, of either gender, non-smokers and non-alcoholics. Exclusion criteria were any medical disorder, pregnancy, body mass index (BMI) >30 kg/ m2 and intake of drugs that are known to affect the BP or autonomic status of the individual.
Baseline demographic data collection
Participants who responded to the call (n = 120) were sent a pre-tested, pre-designed, web-based questionnaire, of which 80 completed the form. Other than sociodemographic details, the questionnaire had a few questions inquiring the participants’ preference of music, experience with music (instrumental or vocal) was also included.[28] The participants were then invited, for further data collection, to the laboratory (n = 75 reported to the laboratory). The participants were interviewed and all the information was collected after establishing rapport with them. After overnight fasting, they were asked to take a light breakfast and abstain from exhaustive exercise, for the past 24 h. They were asked to abstain from tea, coffee about 2 h before the recording. A general health check-up was done for all participants. The BMI was calculated and BP in a sitting position was measured twice after 5 min’ rest (sphygmomanometer) in between and was noted.[29] Only normotensives were included as per inclusion criteria. The healthy cardiovascular system of the volunteers was defined by measuring BP and baseline HR. Recruited participants (n = 68) were explained about the study protocol, and cooperation expected from them, and informed consent was obtained to participate in the study. They were informed about their rights to withdraw their participation from the study.
Randomisation
All participants were randomised into two groups using a simple randomisation technique. Random numbers were computer generated using MS Excel (two sets of 34 each) by the study statistician. The random number indicating intervention or control was kept in an opaque and sealed envelope and the serial number of the participants was written on the top of the envelope. The envelope was opened by the research assistant after the baseline assessment of each participant who then assigned the participants to their respective arms. All the investigators who did the outcome assessments were blinded to the interventions.
Baseline (pre) and post-intervention readings
All the recordings were carried out between 08:00 and 10:00 in an isolated examination room at a stable temperature between 20°C and 22°C, in a noise-free atmosphere. It was ensured no one entered the laboratory once recordings began. The participants were asked to relax in a bed for about 10 min before the tests, with their eyes closed. They were asked to remain as still as possible to exclude movement-induced artefacts and also refrain from talking, falling asleep and intentionally altering their respiration during the recording. Participants were carefully monitored to ensure that there were no significant respiratory or postural changes during the session.
During the first 10 min, the BP cuff was tied to the left arm of the participants and one reading was taken for the subject to know the feel of automatic cuff inflation and deflation. Recording of BP (SBP, DBP and pulse rate) was done using a digital BP monitor as a normal sphygmomanometer recording would not only disturb the subject during the intervention but also delay the recordings and eliminate the effect of the intervention. A standardised digital BP monitor was used (Omron HEM-7130L, Europe), the reliability of which has been established.[30] ECG was recorded in Lead II (sample rate of 1000 Hz) for 10 min, as it is twice the minimum window required for HRV analysis. The recording of the data began in the PowerLab 15 T LabChart hardware and software (AD instruments).
The protocol followed is shown in [Figure 2]. ECG in Lead II was recorded for a total of 30 min, while BP was measured thrice (pre-, during and post-intervention; parameters measured – SBP [in mmHg], DBP [in mmHg] and HR [in beats per minute]). Event marking was done at respective intervals. HRV data cleaning and analysis were done as described.[13] Time domain parameters analysed using fast Fourier transformation (FFT size: 1024) were mean NN interval, HR (average over 10 min), SDNN – the standard deviation of NN intervals, RMSSD – root square of the mean squared difference of successive NNs, NN50 – number of pairs of successive NNs that differ by more than 50 ms, pNN50 – the proportion of NN50 divided by the total number of NNs, spectral components such as total power (TP), very low frequency (VLF), low frequency (LF) and high frequency (HF) components in absolute values of power (ms2) and normalised units (nu) and LF/HF. After all recordings, participants were made to feel comfortable and were relieved.

- Stepwise protocol followed.
Intervention
The two mp3 recordings were coded as A and B by a person uninvolved in the present study. We instructed the participants to listen to this with their eyes closed, with a relaxed mind, for the duration, it was played. The participants listened to the music through headphones (headphones considered ideal as per the review),[31] connected to a laptop, at uniform volume (50%).
Music intervention
The participants in Group A listened to a previously standardised melodic scale Bhimpalas.[8,26] It contained instrumental (Bansuri) music recorded by an eminent flautist, playing the respective alaap in the scale. Alaap is the improvisation of a melodic scale where, note by note the scale is elaborated, presenting the prominent phrases of the scale, usually beginning at a slow tempo, that progresses to medium and faster tempos, but unbound by any rhythmic cycle.[32-34] The melodic scale was played for 10 min duration. Bhimpalas raga, belonging to the Kapi thaat, is a soft, poignant and passionate raga that evokes a feeling of love and yearning. It is generally classified as a ‘late-afternoon’ raga. In Carnatic music (South Indian classical music), the raga ‘Abheri’ is the closest counterpart of this Hindustani raga.[35] The scale of this raga is as follows: Arohaṇa: S G2 M1 P N2 S. Avarohaṇa: S N2 D2 P M1 G2 R2 S (Shadja, Shuddha Rishabh, Komal Gandhar, Suddha Madhyam, Pancham, Shuddha Dhaivath and Komal Nishadh). Equivalent notes on the western scale are B♭ C E♭ F G B♭ C as ascent and C B♭ A G F E♭ D C as descent on the western scale.[36] Thus, the scale is made up of two flat keys and no sharps [Table S1, supplementary file].
Intervention to the control group
The control group (Group B) did not receive any intervention, but since the complete recording lasted for 30–40 min duration, it was possible for the participants to feel sleepy or fall asleep. Sleep would cause different electrophysiological effects, altering the objective of the present study. Further, silence during the middle 10 min would not be an ideal to compare, when the other group received music as the acoustic stimulus. For these two reasons, natural sounds (birds chirping and flowing river) were played for 10 s duration once every 2 min in the mid-10 min (intervention phase).
Statistical analysis
Data were analysed using SPSS software version 18.0 (SPSS Inc. released in 2009. PASW Statistics for Windows, Version 18.0. Chicago: SPSS Inc.). The continuous variables were analysed using descriptive statistics using mean and SD. The categorical variables were analysed using frequency and percentage. The normalcy of the data was checked by applying the Kolmogorov–Smirnov test. The variables, namely BP, HR were found to follow the normal distribution and HRV parameters except average HR showed skewed distribution. Baseline comparisons between the groups were carried out using Student’s t-test for continuous variables and Chi-square tests for categorical variables. All parameters were compared between groups and at pre-, during and post-intervention using two-way repeated measures of ANOVA (RM ANOVA) test. Bonferroni’s multiple comparisons test was used to compare the pairwise differences. All the baseline parameters were comparable except baseline DBP that showed a significant difference between the groups, and hence, multivariate regression analysis and stratified analysis were carried out to adjust for the various covariates. A two-tailed P ≤ 0.05 was considered for statistical significance.
RESULTS
Before intervention
A total of 68 participants were enrolled in the study, with each group consisting of 34 participants. The two groups were comparable based on sociodemographic data [Table S2, Supplementary file]. All baseline parameters were comparable (SBP [P = 0.501], HR [P = 0.8] and all HRV parameters) between the two groups, except DBP (P = 0.010), which was higher in the control group before intervention.
BP during and after intervention
The key findings in BP at the 20th min (during music) in Group A were – SBP was similar to pre-intervention levels during the intervention and increased after intervention (P = 0.054). When the differences among the groups were tested, statistically no significant difference was found (P = 0.259). The DBP increased significantly (P = 0.009) by 1.676 mmHg (P = 0.012) during the intervention and by 1.824 mmHg; (P = 0.026) after intervention in comparison to pre-intervention levels. The HR insignificantly reduced during and increased after intervention (P = 0.937). In the control group, SBP reduced during the intervention and after intervention (P = 0.22), DBP increased during the intervention and later reduced (P = 0.403). The HR continued to reduce throughout the 30 min duration (P = 0.74) [Table 1 and Figure 3]. Note that the HR measured using BP apparatus was recorded once along with BP and was not an average of continuous monitoring before, during or after the intervention. (Pairwise comparisons of BP can be found in the supplementary information, Tables S3 and S4). As pre-intervention DBP between the groups was significant, regression analysis was done using all the variables (age, gender, education, diet, marital status, involvement in physical activity, mind-body relaxation techniques, family history of non-communicable disorders, training in music and preference to music along with differences in BP based on conditions) and none of the parameters seemed to affect the change in DBP that was observed [descriptive and regression analysis results presented in the Supplementary file Tables S4 and S5].
| Group A (n=34) | Group B (n=34) | P(between groups)** | |||||||
|---|---|---|---|---|---|---|---|---|---|
| Pre | During | Post | P within group | Pre | During | Post | P within group | ||
| SBP (mmHg)a# | 107.6, 12.79 | 107.4, 13.96 | 109.4, 13.20 | 0.054 | 105.7, 9.98 | 105.4, 10.26 | 103.8, 11.43 | 0.22 | 0.259 |
| DBP (mmHg)a# | 67.2, 6.10 | 68.9, 7.37 | 69.1, 6.51 | 0.009* | 71.8, 6.09 | 73.0, 6.82 | 72.4, 7.83 | 0.403 | 0.010* |
| HR (bpm)a# | 71.91, 8.5 | 71.68, 9.26 | 72.03, 7.01 | 0.937 | 72.59, 12.94 | 72.18, 8.81 | 71.62, 9.64 | 0.74 | 0.903 |
N is the number of participants in each group. aAbsolute level #one-time measurement, BP is given in mmHg and HR is in beats per minute (bpm). All the values are in mean, standard deviation (SD) – univariate ANOVA. P<0.05 was considered significant – Levene’s test of equality. **P calculated using RM ANOVA both for within and between the groups (refers to interaction). Post hoc analysis was conducted using Bonferroni’s test, tables in the supplementary file. BP: Blood pressure, HR: Heart rate, SBP: Systolic blood pressure, DBP: Diastolic blood pressure
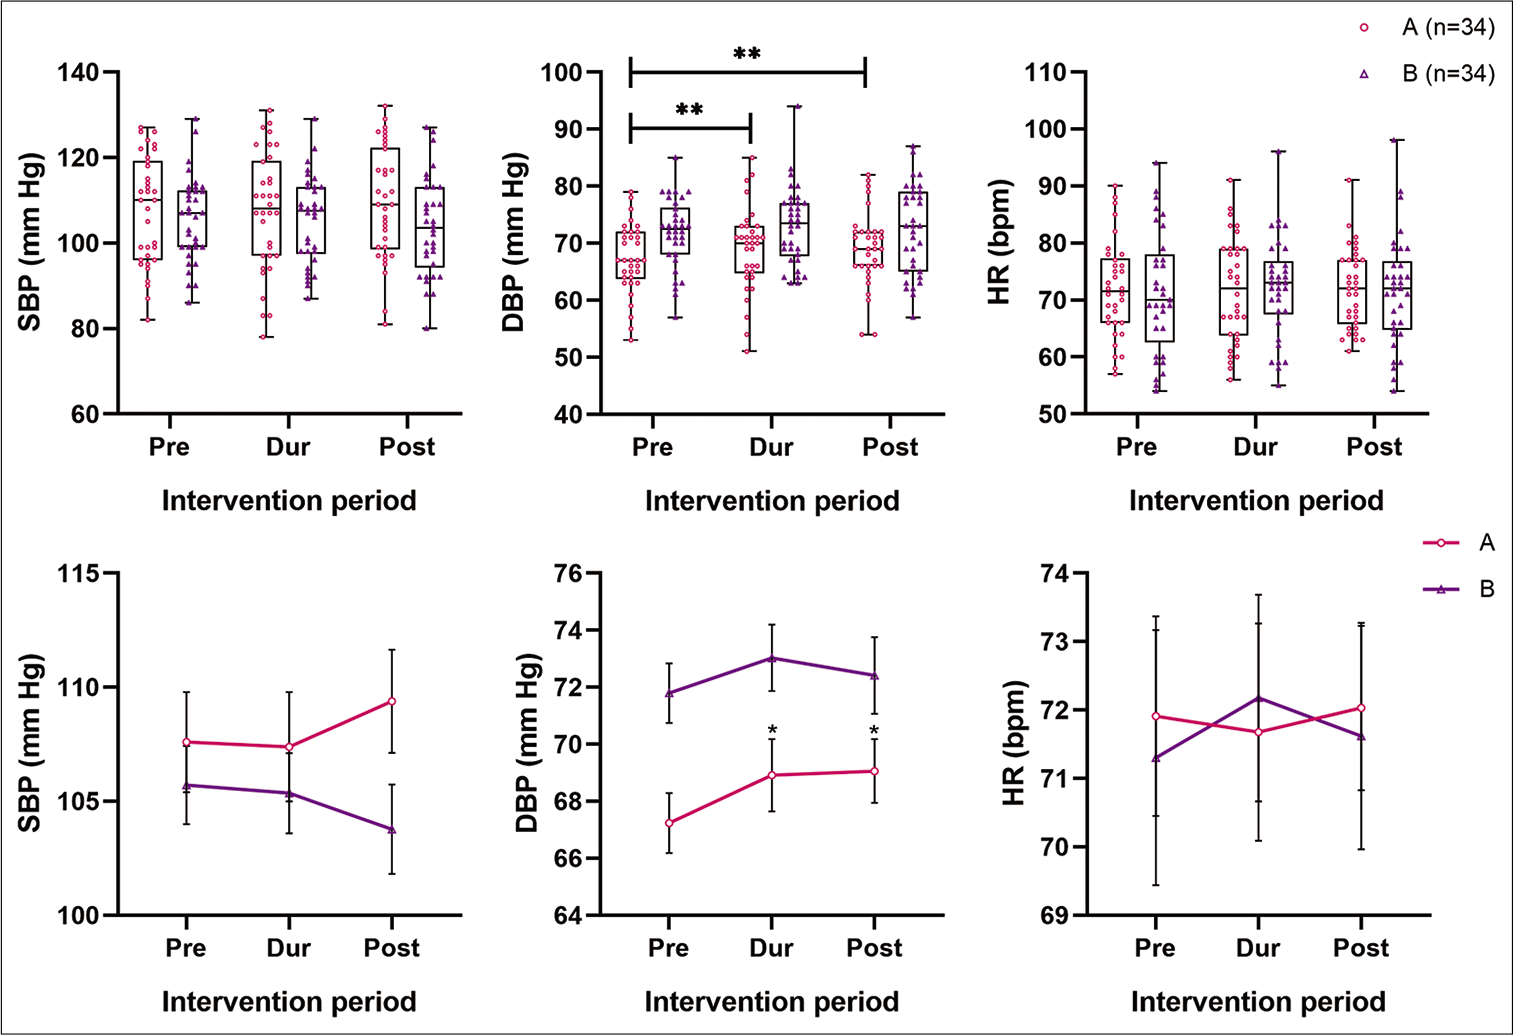
- Comparison of SBP, DBP (in mm of Hg) and HR (in bpm) between two groups (pre-, during and post-intervention). Note that on top are the box and whisker plots showing the actual data points of both the groups (A as the circle in pink and B as upright triangles in purple) and below are the line plots connecting at the mean of pre-, during and post-intervention of the respective groups, along with the SEM indicated. SBP: Systolic blood pressure, DBP: Diastolic blood pressure, HR: Heart rate. *P ≤ 0.05 and **P ≤ 0.01.
HRV during and after intervention
Note that the changes in HRV were the average of 10.1– 20th min of ECG analysis [Table 2; Figures 4 and 5]. For HRV analysis, all parameters except HR were log-transformed due to skewness in data obtained, to obtain the significance levels. Two-way RM ANOVA analysis was done to inspect the interaction between the intervention group and time. In Group A, during the intervention, the various parasympathetic parameters of HRV (SDNN, RMSSD, TP, VLF, LF and HF ms2) reduced along with HR but were statistically not significant. The mean NN interval mildly increased (P = 0.091). After intervention, mean NN interval continued to increase, HR reduced, while SDNN, RMSSD, TP (ms2), HF (ms2) and LF (ms2) increased toward pre-intervention levels. The change was significant for TP (ms2) (global HRV) (P = 0.031) and LF (ms2) (P = 0.013). On pairwise comparison LF ms2, the change was maximal after the intervention compared to during music (P = 0.005). Although NN50 and pNN50 reduced in Group A, after log-transformation, the change was statistically not significant [Table 2 and for pairwise comparison Table S6, supplementary file]. In the control group, during and after the intervention, sustained and significant increase (P ≤ 0.05) in mean NN interval (P = 0.041), SDNN (P = 0.004), RMSSD (P = 0.040), TP (ms2) (P = 0.009), LF (ms2) (P = 0.025) and HF (ms2) (P = 0.023) were observed along with decrease in HR (P = 0.025). On pairwise comparison, the maximum change in mean NN interval was observed from pre-intervention to during intervention (P = 0.005). The reduction in HR was maximum during intervention compared to baseline levels (P = 0.002). The unit drop in HR was very less (hardly 1 beat per min). SDNN change was significant after the intervention compared to baseline (P = 0.014) and during (P = 0.024) intervention. TP change was significant after the intervention compared to baseline levels (P = 0.026). The change in LF (ms2) was maximal after the intervention, compared to during (P = 0.049) intervention. Nevertheless, normalised unit (nu) did not show similar statistical significance [Table 2 and Table S6, for pairwise comparison of HRV, supplementary file].
| Group A (n=34) | Group B (n=34) | P(between groups)** | |||||||
|---|---|---|---|---|---|---|---|---|---|
| Pre | During | Post | P within group | Pre | During | Post | P within group | ||
| Mean NN (ms) | 846.13 | 842.99 | 851.21 | 0.091 | 811.11 | 828.34 | 849.58 | 0.041* | 0.541 |
| 25–75% | 750.7–893.1 | 762.2–901.9 | 772.3–901.3 | 751.3–953.4 | 791–952.2 | 790.9–934.4 | |||
| HR (bpm)a^ | 70.91 | 71.18 | 70.49 | 0.061 | 73.97 | 72.43 | 70.62 | 0.025* | 0.778 |
| 25–75% | 67.2–79.9 | 66.5–78.7 | 66.6–77.7 | 62.9–79.9 | 63.0–76.1 | 64.2–75.9 | |||
| SDNN | 54.33 | 53.27 | 51.96 | 0.405 | 58.32 | 65.06 | 67.44 | 0.004* | 0.231 |
| 25–75% | 44.4–75.7 | 38.4–68.5 | 43.2–75.7 | 41.7–80.1 | 43.9–83.2 | 49.6–90.6 | |||
| RMSSD | 43.98 | 40.72 | 43.70 | 0.337 | 48.15 | 59.58 | 62.03 | 0.040* | 0.384 |
| 25–75% | 37–78.7 | 31.8–82.6 | 36.4–85.5 | 35.4–83.5 | 37.5–83.9 | 40.2–95.9 | |||
| NN50 | 217.00 | 186.00 | 151.00 | 0.802 | 201.50 | 255.00 | 280.00 | 0.278 | 0.914 |
| 25–75% | 76.8–373.0 | 66.3–378.5 | 104.3-371.5 | 98-356.5 | 118.5-341 | 135.8-344 | |||
| pNN50 | 23.77 | 19.94 | 22.04 | 0.864 | 26.27 | 34.54 | 35.30 | 0.128 | 0.412 |
| 25–75% | 13.2-48.8 | 9.3-56.8 | 12.9-57.4 | 12.1–52.9 | 14.6–52.4 | 16.8–52.5 | |||
| TP (ms2) | 2743.55 | 2248.07 | 2639.15 | 0.031* | 3070.90 | 3449.98 | 4113.70 | 0.009* | 0.348 |
| 25–75% | 1940.8–5281.5 | 1399.4–4262.4 | 1862.8–5390.8 | 1641.6–6440.5 | 1993.3–6487.2 | 2409.6–7291.8 | |||
| VLF (ms2) | 1011.71 | 803.49 | 953.11 | 0.173 | 892.08 | 1068.22 | 1225.15 | 0.113 | 0.336 |
| 25–75% | 513–1502 | 417.3–1492.5 | 427.1–1411 | 489.1–1402.5 | 633.4–1632.6 | 736.9–1683.9 | |||
| LF (ms2) | 774.32 | 612.13 | 726.64 | 0.013* | 877.64 | 881.23 | 1156.17 | 0.025* | 0.084 |
| 25–75% | 380–1079.5 | 355–818.8 | 516.5–1248 | 420.6–1518.7 | 486.5–1587.7 | 663.8–2002.3 | |||
| LF (nu) | 36.21 | 38.29 | 42.28 | 0.269 | 41.35 | 39.13 | 41.91 | 0.573 | 0.275 |
| 25–75% | 25.4–48.4 | 23.9–50.7 | 28.1–52.6 | 30.7–52.4 | 28.9–51 | 31.6–52.2 | |||
| HF (ms2) | 820.04 | 752.82 | 739.94 | 0.555 | 1067.53 | 1302.84 | 1513.38 | 0.023* | 0.527 |
| 25–75% | 514.1–2304.5 | 414.0–2263.2 | 462.6–2746 | 398.9–2321.3 | 567.7–2705 | 558.5–3154.4 | |||
| HF (nu) | 52.51 | 53.11 | 47.25 | 0.233 | 51.35 | 52.97 | 52.51 | 0.387 | 0.79 |
| 25–75% | 42.1–63 | 37.9–70 | 40.9–58.1 | 35.2–59.6 | 38.6–64.9 | 36.7–60.4 | |||
| LF/HF | 0.65 | 0.68 | 0.90 | 0.206 | 0.82 | 0.75 | 0.79 | 0.682 | 0.751 |
| 25–75% | 0.4–1.1 | 0.4–1.3 | 0.4–1.3 | 0.5–1.4 | 0.4–1.3 | 0.5–1.4 | |||
N is the number of participants in each group. aAbsolute median level; ^average of continuous monitoring over 10 min. All HRV parameters were log converted for significance calculation, except HR, which is in beats per minute (bpm). For all HRV parameters, the null hypothesis (H0) considered was that mean values are the same at all the time points (pre, during and post). The alternative hypothesis is that the mean value is significantly different at one or more time points. All the values are in median, 25th and 75th percentiles – univariate ANOVA. P<0.05 was considered significant – Levene’s test of equality. **P calculated using RM ANOVA both for within and between the groups (refers to interaction). Post hoc analysis by Bonferroni’s test is shown in the supplementary file [Table S6]. HR: Heart rate, RMSSD: Root mean square standard deviation, HRV: Heart rate variability, TP: Total power, VLF: Very low frequency, LF/HF: Low frequency/high frequency, SDNN: The standard deviation of NN intervals
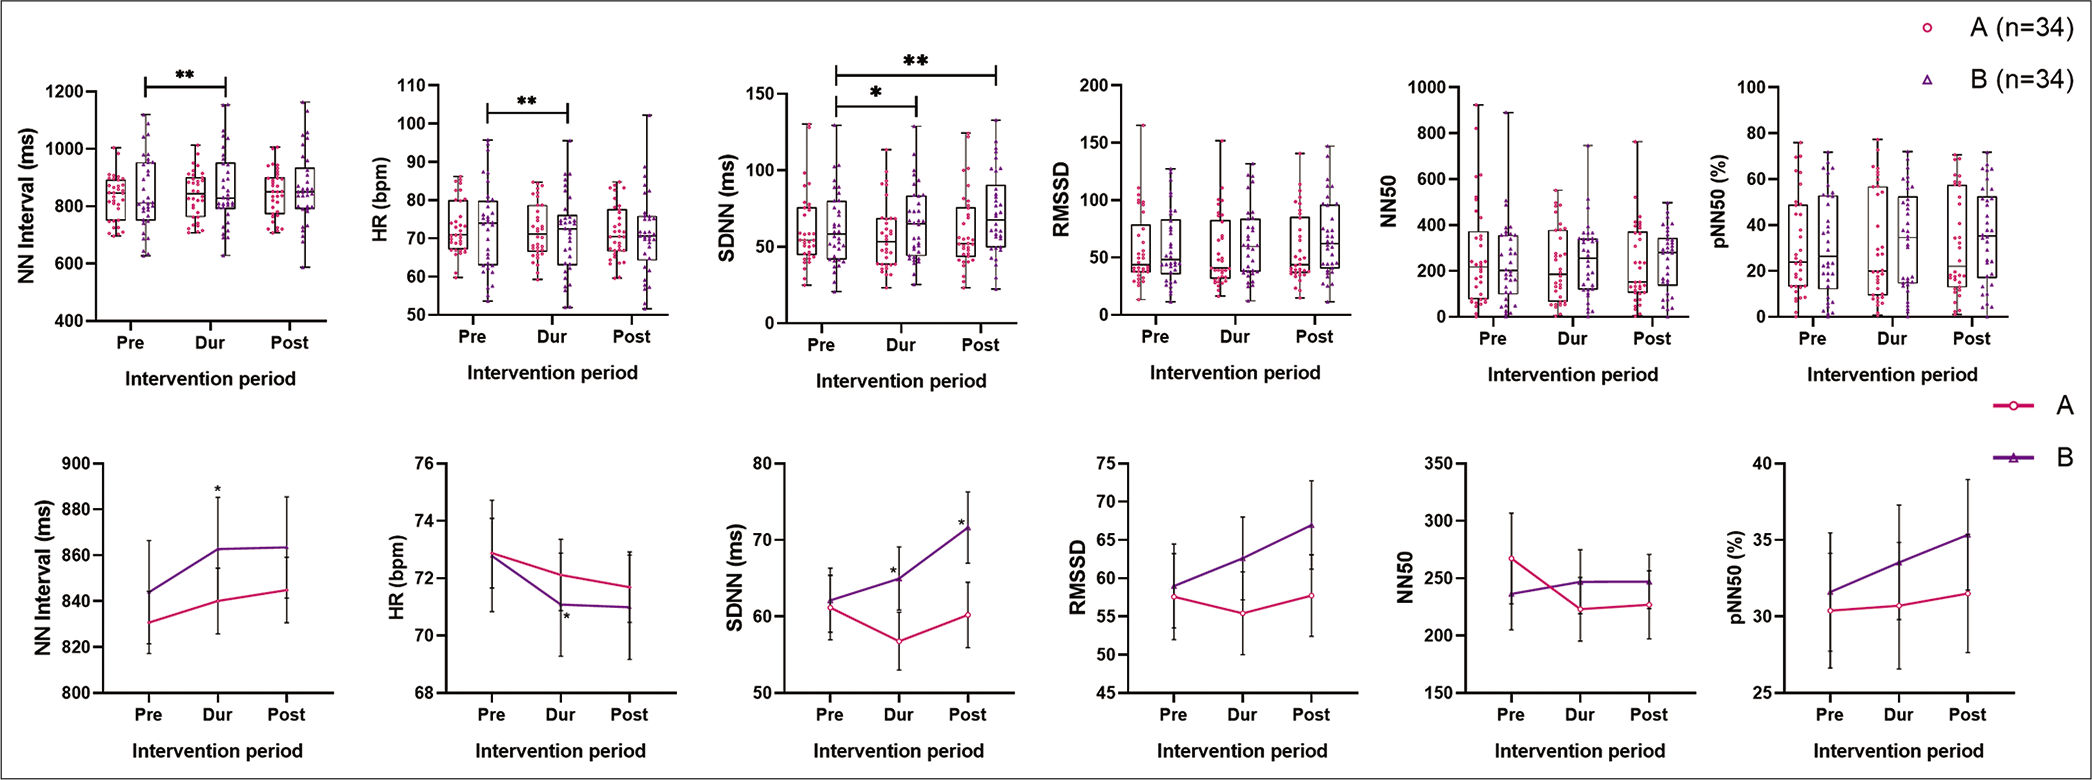
- Comparison of absolute levels of time domain parameters of HRV – the NN interval (ms), HR (Lead II ECG, averaged), SDNN, RMSSD, NN50 and pNN50. Note that on top are the box and whisker plots showing the actual data points of both the groups (A as the circle in pink and B as upright triangles in purple), and below are the line plots connecting at the mean of pre-, during and post-intervention of the respective groups, along with the SEM indicated. HRV: Heart rate variability, HR: Heart rate, ECG: Electrocardiogram, SDNN: The standard deviation of NN intervals, RMSSD: Root square of the mean squared difference of successive NNs, NN50: Number of pairs of successive NNs that differ by more than 50 ms, pNN50: The proportion of NN50 divided by the total number of NNs. *P ≤0.05 and **P ≤ 0.01.
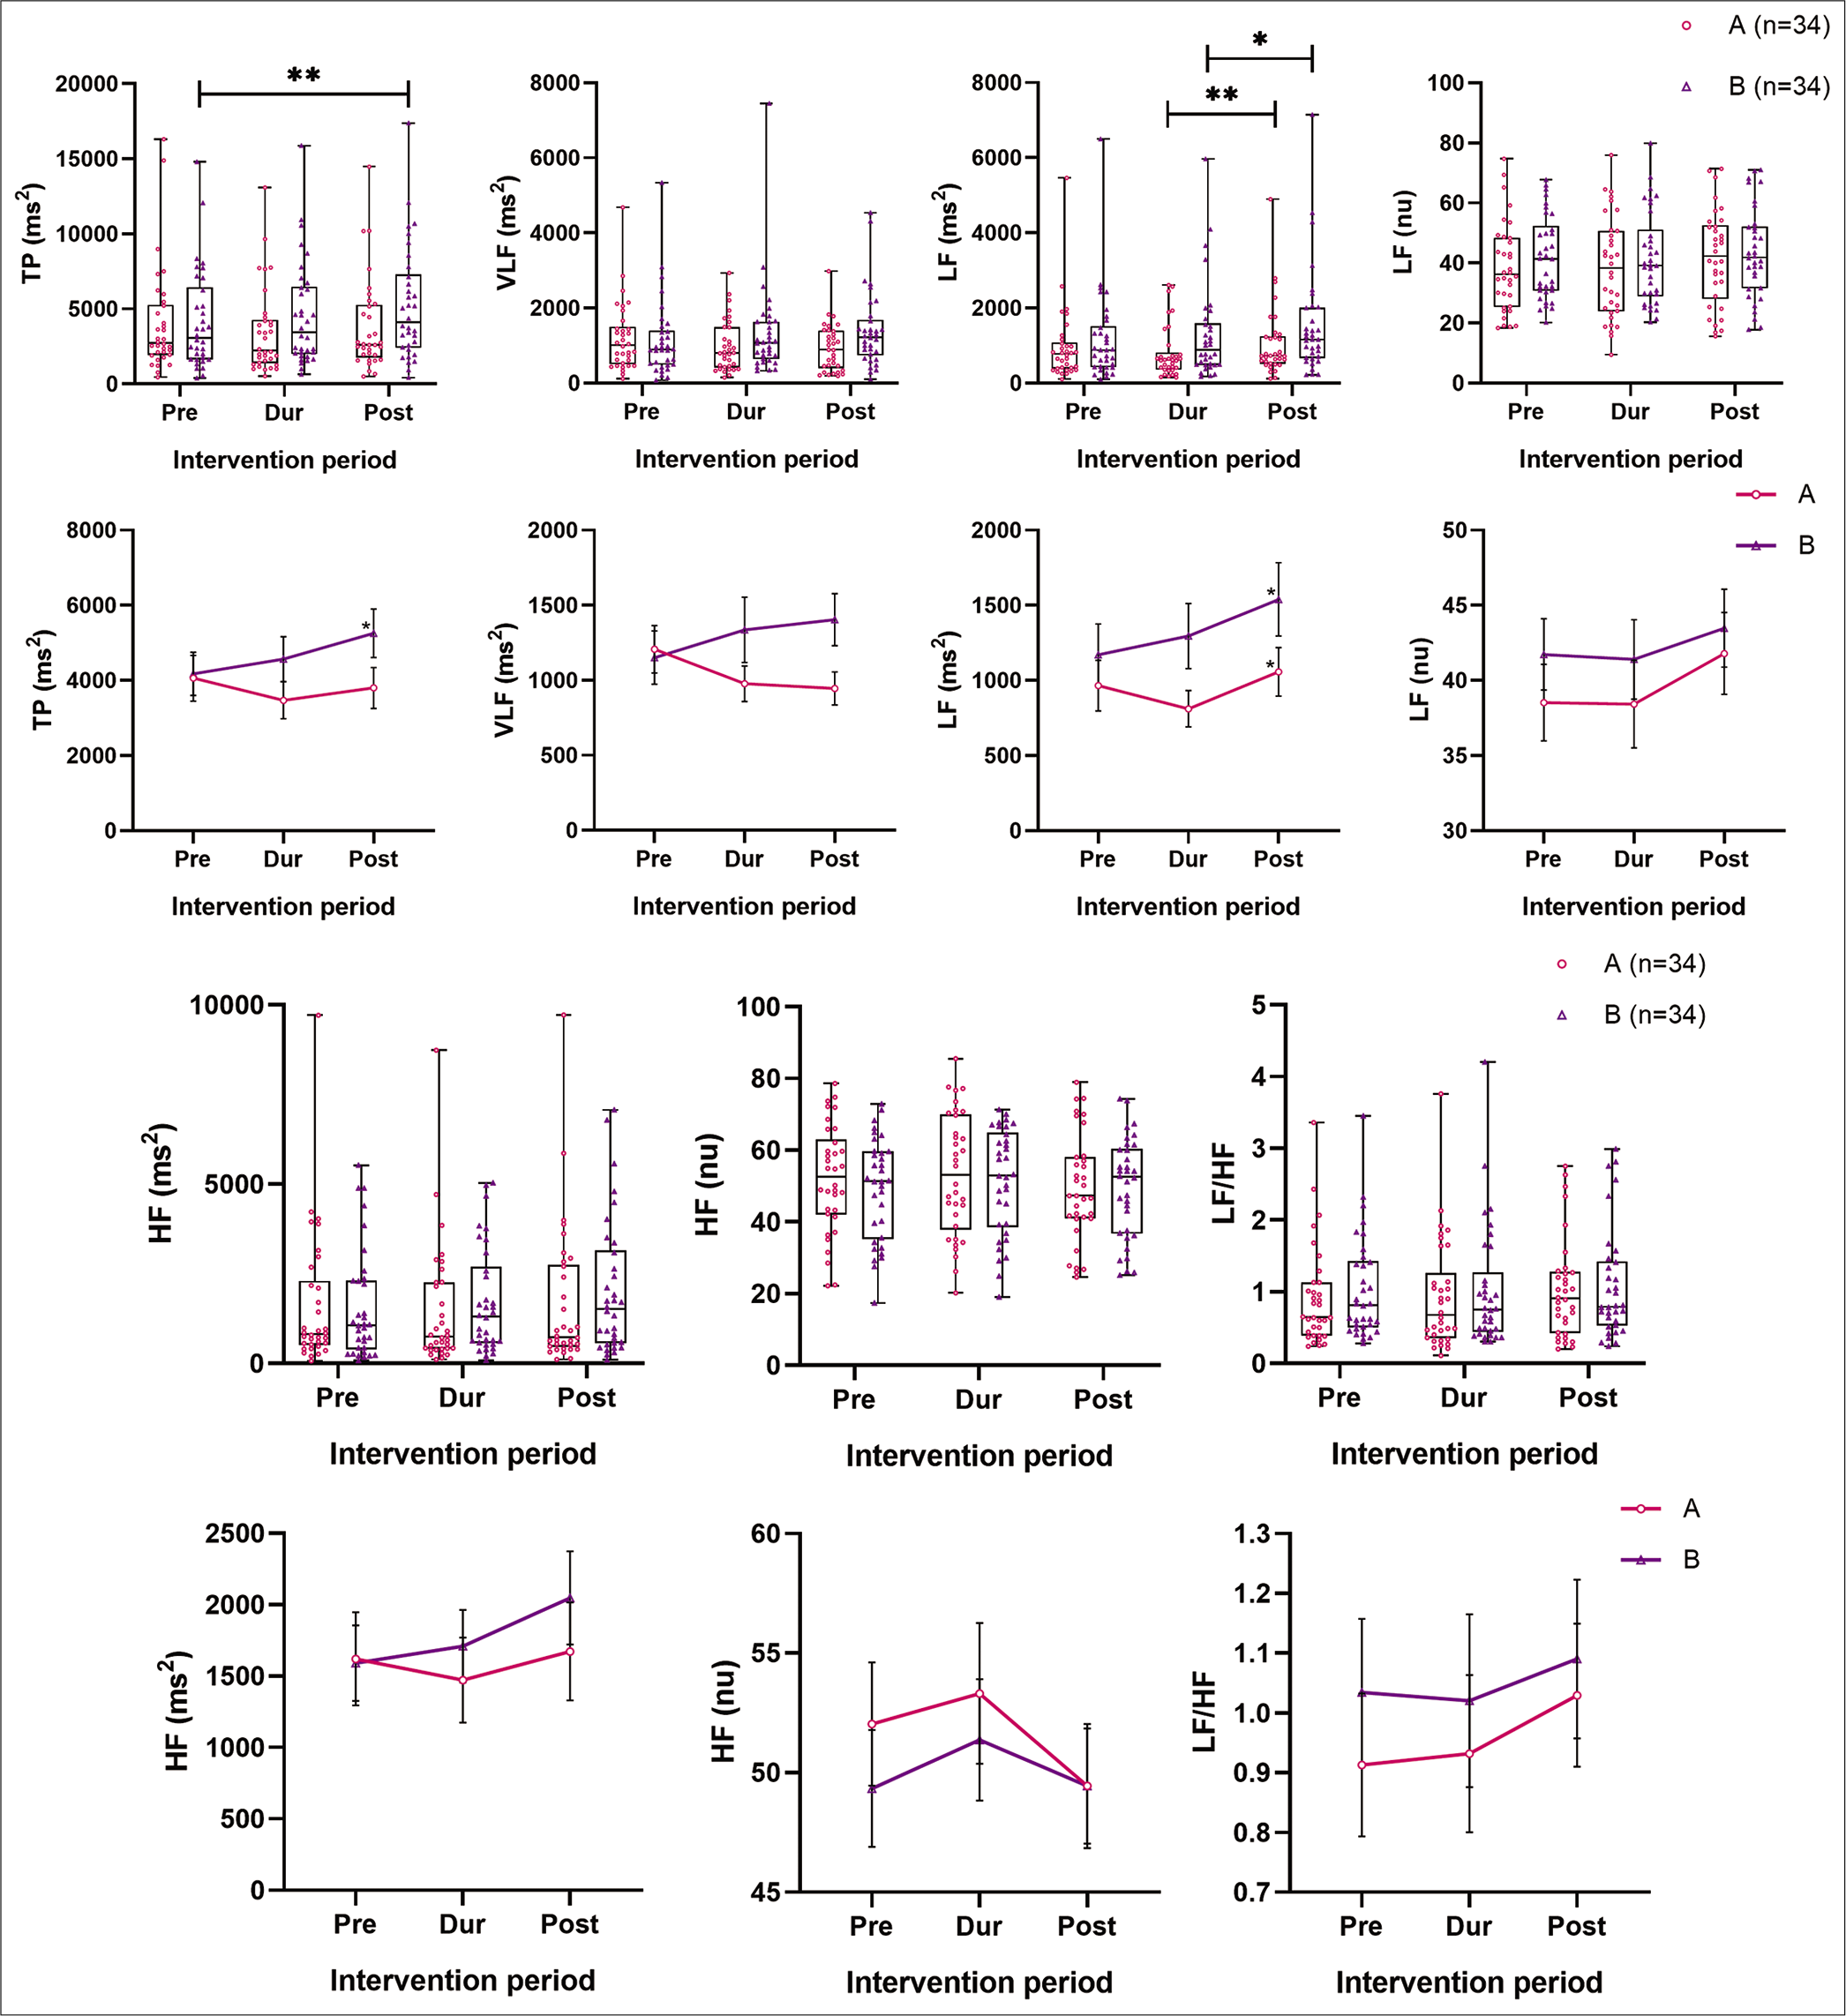
- Comparison of absolute levels of frequency domain parameters of HRV – TP (ms2), LF (ms2) LF (nu), HF (ms2), HF (nu) and LF/ HF between two groups (pre-, during and post-intervention). Note that on top are the box and whisker plots showing the actual data points of both the groups (A as the circle in pink and B as upright triangles in purple), and below are the line plots connecting at the mean of pre-, during and post-intervention of the respective groups, along with the SEM indicated. HRV: Heart rate variability. *P ≤ 0.05 and **P ≤ 0.01.
DISCUSSION
In this study, to the best of our knowledge, for the 1st time, a previously standardised melodic scale (Hindustani raga) [26] raga Bhimpalas was scientifically evaluated, for its short-term effects, on cardiovascular electrophysiological parameters such as BP and HRV in young, clinically normal, normotensive individuals, who listened to the respective interventions for the 1st time, through a randomised control design.
Main findings
Before intervention
All sociodemographic and baseline parameters were comparable between the two groups, except DBP, which was higher in the control group before intervention. However, on regression analysis of all the probable confounding variables, none of the parameters seemed to affect the change in DBP.
During intervention
The key findings in BP at the 20th min (during music) in Group A were – SBP was similar to pre-intervention levels (indicating no effect/relaxation response), DBP increased significantly by 1.676 mmHg, while HR insignificantly reduced. The various parasympathetic parameters of HRV (SDNN, RMSSD, VLF and HF ms2]) reduced along with HR, TP (ms2) and LF (ms2). Mean NN interval increased, but not significantly. Thus, a sympathetic predominance or reduction in parasympathetic activity was observed with music intervention. This might be due to the arousal effect of music as observed in a few other studies.[37-39]
In the control group, SBP reduced very slightly, DBP increased, but was not significant, while HR continued to reduce throughout the 30 min duration. Adding to this finding, in the control group, sustained and a significant increase in mean NN interval, parasympathetic time domain HRV parameters (SDNN, RMSSD, pNN50) along with TP and LF (ms2), with a reduction in HR, implied increased parasympathetic activity, when a person is relaxing completely for 30 min duration, with predominant silence as the intervention. Nevertheless, the unit drop in HR was very less.
After intervention
After the intervention was stopped, in Group A, SBP and HR increased mildly. The DBP increase was significant compared to pre-intervention levels (increase by 1.824 mmHg). All the HRV parameters increased toward pre-intervention levels with a reduction in HR (change being significant only for TP and LF). In the control group (Group B), the SBP, DBP and HR reduced insignificantly after the intervention. Among the HRV parameters, mean NN interval and HR remained similar to during intervention levels. Other HRV parameters increased (change being significant for SDNN, TP and LF).
Note that the LF power is produced by both SNS and PNS activity and is not a pure index of SNS drive. In contrast, SDNN, RMSSD, and HF power is predominantly controlled by the PNS activity. TP is said to reflect overall autonomic activity but has predominant vagal influence.[40]
Discussion of main findings
It may be observed that passive listening task to raga Bhimpalas caused sympathetic arousal (as shown by increased DBP – indicating mild vasoconstriction in the periphery and drop in parasympathetic parameters of HRV – SDNN, RMSSD and HF [ms2]) during music while regaining the autonomic balance after the intervention was stopped. This seems similar to the classic paper by Bernardi et al., where playing music for 2 min exhibited arousal response as against after stopping the music.[16] Note that over 10 min of music listening, the SBP did not change much, while HR reduced mildly, with an increase in mean NN interval, though insignificant. The participants involved in the present study were clinically normal, normotensives, (autonomically sound) and a large change in BP with music intervention, maybe too high an expectation. This is in line with the finding that listening to this melodic scale reduced the state anxiety levels.[1] In our previous study, music intervention caused a significant drop in DBP (~2 mmHg) among pre-hypertensives.[26] In the present study, BP was measured acutely as participants listened to music (in the laboratory) unlike the previous study, where BP was measured using a 24 h ambulatory BP device, before and after 3 months of intervention. Continuous BP monitoring, over 30 min, like ECG could have been better in indicating the real-time changes in BP. However, the observed significant DBP and HRV changes may be pointing toward the joyous emotion/arousal effect of raga Bhimpalas, as observed in the emotions indicated in the Indian Bollywood compositions based on this scale [see text below Table S1 for a short list of compositions].[41]
This arousal response in the music intervention group could be due to passive listening to an unfamiliar tune. Studies show that the passive listening task produces a sympathetic response when it is emotionally arousing music.[42] Passive listening to positively valenced music increased HR and was associated with a mind-wandering state.[43] Familiar folk melody resulted in greater pupil dilations (sympathetic arousal) compared to unfamiliar (novel) stimuli.[44] Unfamiliar relaxing music caused a significant relaxation response (galvanic skin resistance, HR and peripheral temperature).[45,46] The probability of listening to music with an intention of relaxation, over a longer period, producing familiarity,[47] under non-laboratory conditions and thus a cumulative relaxation effect cannot be ruled out. To this thought, one study demonstrated that LF and LF/HF ratio increased during sedative and excitatory music sessions but decreased during non-music conditions. The HF was higher during sedative music but similar to non-music conditions.[48] Untrained individuals listening to atonal music exhibited reduced HR and increased BP (SBP and DBP), possibly reflecting an increase in alertness and attention, psychological tension and anxiety.[49] Although 70% of participants in the present study were not trained in music, regression analysis showed no effect of training on the parameters measured.
Bowling et al. observed that melodies that are positive or excitatory had more major intervals (>200 cents) while negative/subdued ragas have more minor intervals.[50] A recent study on emotions induced by listening to Hindustani music thaats (scales with all seven notes) concluded that ragas with major intervals (Shuddh Swaras – Shuddh Re And Shuddh Ga) were rated as ‘calm’ while those with minor intervals (Komal Swaras – Komal Re And Komal Dha) were rated as ‘sad.’[51] Bhimpalas raga is a unique scale with three perfect notes and an equal number of major and minor notes. This might explain the mild sympathetic effect seen in the present study.
In the present study, an experimenter chosen standardised auditory stimulus was used. Self-selected sedative music has been shown to induce both aroused and sedative emotions and a slight but significant increase in HR.[52] In contrast, another study, using sedative and stimulating music among cardiac rehabilitation patients, showed no effect of the type of music on BP.[53] In another study, the HR and BP changes were not correlated with the music preference of the participants.[54]
Further, active music therapy reduced LF/HF while passive listening (as seen in the present study) increased LF/HF.[4] When HRV was analysed during no sound condition, RMSSD significantly increased, which authors attributed to the supine posture, when cardiac PNS inputs were maximal.[55] In the present study, all recordings were done in supine posture. Music combined with guided breathing exercises has shown better control of physiological parameters in a few studies,[56,57] while deep breathing exercise did not augment the benefit of music in reducing BP.[58] Among the various mechanisms dopamine released in the striatal system, on listening to pleasurable songs, is said to be involved in autonomic regulation.[59]
The strengths of the current study are that, to the best of our knowledge, for the 1st time, an Indian melodic scale has been studied as an acoustic stimulus systematically and scientifically, through a randomised trial (avoiding different types of bias), among normal healthy individuals. All parameters were free from gross measurement errors as the recordings were performed by a single, well-trained, but blinded, research assistant (reducing observer’s error) along with validation from the PI (who was also blinded to the allotted group) for accuracy of the data collected. The devices used to collect the data were standard, reliable and well-validated, through prior research studies. The chosen music intervention was standardised and was based on existing music literature. Percussion instruments and lyrical component were avoided in music used, as they have their respective physiological effects. The control group was well matched and the intervention was also standardised. The sample size was calculated based on prior research work, with appropriate power, and was thus adequate. Participants of both genders, with homogenous age groups, were compared.
The limitations of the study were that choice of music was not given to the participants. Slow breathing can alter the HRV and BP. Since beat-to-beat BP recordings were not done the results as measured by the oscillometric method depended on the phase of the breathing cycle when it was recorded, which, in turn, may have confounded the results obtained. Future studies must consider continuous monitoring of BP to exclude this variation. Self-chosen music was shown to be better by a few research groups[60-64] while others have proven experimenters chosen music to be better[5] and still others said that the choice of music did not matter.[65] One fact of this study was that the participants were aware of the aim of the study and might have listened to the music with attention, which is different from that of the control group, as once the intervention started, the control group knew that they were not in the music intervention group. This limitation was difficult to overcome, as the research question demanded this design and the results obtained may be interpreted with this background. A subject’s involvement in the music and subjective emotions was not captured. Self-reported parameters are, however, less reliable than actual physiological recordings. Although all participants were clinically normal, laboratory measurements of their blood/serum or urine were not conducted to conclusively say that everyone was normal. Nevertheless, the findings of this study are in line with our previous observations that listening to this melodic scale caused a drop in state anxiety and a rise in overall beta 1 power on electroencephalography recordings.[1,66]
CONCLUSION
For the 1st time, this study shows that a short-term acoustic stimulus using Indian music affects the cardiovascular electrophysiological parameters, among young healthy individuals, in a systematic fashion. Listening to an Indian melodic scale, raga Bhimpalas, caused a mild arousal response during the intervention that tended to return to baseline levels after the intervention was stopped. This may be attributed to a combination of major and minor intervals in the scale as well as a normal response to an unfamiliar stimulus that was heard with enough attention to produce mild sympathetic arousal. Future studies should try to evaluate the physiological responses (with continuous monitoring) during listening to different genres, scales of music and familiarisation is also an important pre-intervention factor to be considered.
Acknowledgement
Authors acknowledge funding agencies, and thank all the volunteers for their participation in this study. We thank Vidhwan Pandit Pravin Godhkhindi for recording the musical clip exclusively for this study.
Declaration of patient consent
The authors certify that they have obtained all appropriate patient consent.
Financial support and sponsorship
The above project was funded by Rajiv Gandhi University of Health Sciences (RGUHS), Government of Karnataka, India (Project Unique ID: 15M009) and Indian Council for Medical Research (ICMR), Government of India (2017-0174/F1).
Conflicts of interest
There are no conflicts of interest.
SUPPLEMENTARY
S1 TEXT: INDIAN MUSIC AND ITS NOTES
In music theory, an interval is a difference in pitch between two sounds. An octave is an interval between one musical pitch and another pitch, which is double its frequency. The basic set of tones and relationships between them that are used in ragas are derived from the 12-tone octave divisions/chromatic scale.[1] It is important to note that the ‘major’ intervals are the Shuddh Swaras/ natural notes (second, third, sixth and seventh) while the ‘minor’ intervals are the Komal Swaras (flat) positions of the same tones. Each interval is a tone defined by the ratio of its fundamental frequency to the tonic (Sa). Swara/note implies a note in the successive steps of the octave.[2] With just three notes/swara during Vedic times, the number increased to five and later seven notes (saptaswara – represented as Sa, Ri, Ga, Ma, Pa, Dha and Ni, equivalent to Do, Re, Mi, Fa, So, La and Ti of western music), which is now considered ideal to produce a melodic scale/raga.[1,3] Each melodic scale is organised as Aarohana (ascending sequence of notes) and Avarohana (descending sequence), is further improvised, within the framework of the scale, in vocal or instrumental performances, presenting the various aspects of the scale (e.g. sustenance of notes, elaboration, timing, ending notes, repeated notes, etc.). Indian music improvisation has unique set of rules that are pre-determined but yet creative, and alaap (vistar), jor, swarakalpana, taan, tanam, neraval and so on, all form different parts of this improvisation.
| Svara/Note | Hindustani name | Staff note | Western scale interval name | Frequency | Just intonation (Cents) | 12-TET (Cent) |
|---|---|---|---|---|---|---|
| Sa | Shadja | C | Perfect unison | 1 | 0 | 0 |
| re | Shuddha Rishab | D | Major second | 10/9 | 183 | 200 |
| ga | Komal Gandhar | E♭ | Minor third | 6/5 | 316 | 300 |
| Ma | Shuddha Madhyam | F | Perfect fourth | 4/3 | 498 | 500 |
| Pa | Pancham | G | Perfect fifth | 3/2 | 702 | 700 |
| Dha | Shuddha Daivat | A | Major sixth | 5/3 | 884 | 900 |
| ni | Komal Nishad | B♭ | Minor seventh | 9/5 | 1018 | 1000 |
Interval names, abbreviations, frequency ratios and sizes in cents for just intonation (JI) as well as 12-tone equal temperament (12-TET) tunings are shown. The 12 intervals of the Western chromatic scale, comparably presented (More Anout JI and 12-TET in given below)
It is a pentatonic ascent and heptatonic descent. Few Bollywood tunes based on this scale – Nainon Mein Badra Chaaye (Movie: Mera Saaya), E Neele Gagan Ke Tale (Movie: Badshah), Kuch Dil Ne Kaha (Movie: Anupama) and Khilte Hain Gul Yahan (Movie: Sharmili).[4]
S2 TEXT: JUST INTONATION AND 12 EQUAL TEMPERAMENTS
Just intonation or pure intonation is the tuning of musical intervals as whole number ratios (such as 3:2 or 4:3) of frequencies. Any interval tuned in this way is called a just interval. Just intervals (and chords created by combining them) consist of members of a single harmonic series of a (lower) implied fundamental. For example, in the diagram at right, the notes G and middle C (labelled 3 and 4) are both members of the harmonic series of the lowest C and their frequencies will be 3 and 4 times, respectively, the fundamental frequency; thus, their interval ratio will be 4:3. If the frequency of the fundamental is 64 Hertz, the frequencies of the two notes in question would be 192 and 256. Instruments are not always tuned using these intervals.
In the Western world, instruments of fixed pitch, such as pianos, are typically tuned using equal temperament, in which intervals other than octaves consist of irrational-number frequency ratios. Equal temperament is a musical temperament or tuning system, which approximates just intervals by dividing an octave (or other intervals) into equal steps. This means the ratio of the frequencies of any adjacent pair of notes is the same, which gives an equal perceived step size as the pitch is perceived roughly as the logarithm of the frequency.
In classical music and Western music in general, the most common tuning system since the 18th century has been 12-tone equal temperament (also known as 12 equal temperaments, 12-TET or 12-ET; informally abbreviated to 12 equal), which divides the octave into 12 parts, all of which are equal on a logarithmic scale, with a ratio equal to the 12th root of 2 (12√2 ≈ 1.05946). That resulting smallest interval, 1/12 the width of an octave, is called a semitone or half step. In Western countries, the term equal temperament, without qualification, generally means 12-TET.
| Variables | Group | Group A n(%) n=34 | Group B n(%) n=34 | Total n(%) n=68 | P-value |
|---|---|---|---|---|---|
| Age (years) | ≤18 | 7 (20.6) | 4 (11.8) | 11 (16.2) | 0.651 |
| 19–21 | 19 (55.9) | 19 (55.9) | 38 (55.9) | ||
| 22–24 | 4 (11.8) | 4 (11.8) | 8 (11.8) | ||
| ≥25 | 4 (11.8) | 7 (20.6) | 12 (16.2) | ||
| Age (years) Mean, SD | 20.3, 2.60 | 21.0, 2.71 | 20.8, 2.80 | 0.278 | |
| Gender | Female | 16 (47.1) | 9 (26.5) | 25 (36.8) | 0.078 |
| Male | 18 (52.9) | 25 (73.5) | 43 (63.2) | ||
| Mean BMI (kg/m2) Mean, SD | 23.4, 4.67 | 22.3, 4.02 | 23.0, 4.45 | 0.307 | |
| Training in music | No | 24 (70.6) | 23 (67.6) | 47 (69.1) | 0.793 |
| Yes | 10 (29.4) | 11 (32.4) | 21 (30.9) | ||
| Genre of music | Indian | 9 (90.0) | 13 (92.9) | 22 (91.7) | 0.803 |
| Western | 1 (10.0) | 1 (7.1) | 2 (8.3) |
N is the number of subjects in each group. N=34, in each group. Values are represented as mean, standard deviation (SD). Group A (Raga A – intervention group), Group B (control). All the values are in absolute values and in parenthesis are in percentages. P calculated using Chi-square test/Fisher’s exact test. P<0.05 is considered significant. Mean age and BMI comparison were done using MANOVA
In modern times, 12-TET is usually tuned relative to a standard pitch of 440 Hz, called A440, meaning one-note, A is tuned to 440 Hertz and all other notes are defined as some multiple of semitones apart from it, either higher or lower in frequency. The standard pitch has not always been 440 Hz. It has varied and generally risen over the past few hundred years.[5,6]
The two groups were comparable based on sociodemographic data (age, gender, mean BMI, age groups and training in music and the genre trained in). Most of the subjects preferred listening to old Hindi movie songs.
| Random group | Mean difference (I-J) | Std. error | P-valuea | 95% confidence interval for differencea | |||
|---|---|---|---|---|---|---|---|
| Lower bound | Upper bound | ||||||
| A | 1 | 2 | 0.206 | 0.890 | 1.000 | −2.040 | 2.452 |
| 3 | −1.794 | 0.869 | 0.141 | −3.986 | 0.398 | ||
| 2 | 1 | −0.206 | 0.890 | 1.000 | −2.452 | 2.040 | |
| 3 | −2.000 | 0.910 | 0.106 | −4.296 | 0.296 | ||
| 3 | 1 | 1.794 | 0.869 | 0.141 | −0.398 | 3.986 | |
| 2 | 2.000 | 0.910 | 0.106 | −0.296 | 4.296 | ||
| B | 1 | 2 | 0.353 | 0.690 | 1.000 | −1.387 | 2.093 |
| 3 | 1.941 | 1.349 | 0.479 | −1.461 | 5.344 | ||
| 2 | 1 | −0.353 | 0.690 | 1.000 | −2.093 | 1.387 | |
| 3 | 1.588 | 1.336 | 0.729 | −1.781 | 4.958 | ||
| 3 | 1 | −1.941 | 1.349 | 0.479 | −5.344 | 1.461 | |
| 2 | −1.588 | 1.336 | 0.729 | −4.958 | 1.781 | ||
Based on estimated marginal means. aAdjustment for multiple comparisons: Bonferroni. SBP: Systolic blood pressure
| Random group | Mean difference (I-J) | Std. error | P-valuea | 95% confidence interval for differenceb | |||
|---|---|---|---|---|---|---|---|
| Lower bound | Upper bound | ||||||
| A | 1 | 2 | −1.676* | 0.540 | 0.012 | −3.039 | −0.314 |
| 3 | −1.824* | 0.653 | 0.026 | −3.471 | −0.176 | ||
| 2 | 1 | 1.676* | 0.540 | 0.012 | 0.314 | 3.039 | |
| 3 | −0.147 | 0.696 | 1.000 | −1.904 | 1.610 | ||
| 3 | 1 | 1.824* | 0.653 | 0.026 | 0.176 | 3.471 | |
| 2 | 0.147 | 0.696 | 1.000 | −1.610 | 1.904 | ||
| B | 1 | 2 | -1.235 | 0.938 | 0.591 | −3.602 | 1.132 |
| 3 | −0.618 | 1.155 | 1.000 | −3.530 | 2.295 | ||
| 2 | 1 | 1.235 | 0.938 | 0.591 | −1.132 | 3.602 | |
| 3 | 0.618 | 0.677 | 1.000 | −1.090 | 2.325 | ||
| 3 | 1 | 0.618 | 1.155 | 1.000 | −2.295 | 3.530 | |
| 2 | −0.618 | 0.677 | 1.000 | −2.325 | 1.090 | ||
Based on estimated marginal means. *The mean difference is significant at the 0.05 level. bAdjustment for multiple comparisons: Bonferroni. DBP: Diastolic blood pressure
| Tests of between-subjects effects | |||||
|---|---|---|---|---|---|
| Dependent variable: Post_DBP | |||||
| Source | Type III sum of squares | df | Mean square | F | Sig. |
| Corrected model | 3477.851a | 6 | 579.642 | 36.269 | 0.000 |
| Intercept | 20.420 | 1 | 20.420 | 1.278 | 0.263 |
| RANDOMGROUP * Pre_DBP | 95.262 | 2 | 47.631 | 2.980 | 0.058 |
| RANDOMGROUP * During_DBP | 29.655 | 2 | 14.828 | 0.928 | 0.401 |
| RANDOMGROUP * Pre_DBP * During_DBP | 20.254 | 1 | 20.254 | 1.267 | 0.265 |
| Pre_DBP * During_DBP | 20.798 | 1 | 20.798 | 1.301 | 0.258 |
| Error | 1006.849 | 63 | 15.982 | ||
| Total | 360343.000 | 70 | |||
| Corrected total | 4484.700 | 69 | |||
| Random group | Intervention | Mean difference (I-J) | Std. error | P valuea | 95% confidence interval for differencea | ||
|---|---|---|---|---|---|---|---|
| Lower bound | Upper bound | ||||||
| Pairwise comparisons mean NN | |||||||
| B | 1 | 2 | −0.009* | 0.002 | 0.005 | −0.015 | −0.002 |
| Pairwise comparisons of HR | |||||||
| B | 1 | 2 | 1.669* | 0.441 | 0.002 | 0.557 | 2.781 |
| Pairwise comparisons of SDNN | |||||||
| B | 3 | 1 | 0.054* | 0.018 | 0.014 | 0.009 | 0.099 |
| B | 3 | 2 | 0.034* | 0.012 | 0.024 | 0.004 | 0.064 |
| Pairwise comparisons of TP ms2 | |||||||
| B | 1 | 3 | −0.133* | 0.048 | 0.026 | −0.253 | −0.013 |
| Pairwise comparisons of LF ms2 | |||||||
| A | 3 | 2 | 0.125* | 0.037 | 0.005 | 0.032 | 0.218 |
| B | 2 | 3 | −0.072* | 0.028 | 0.049 | −0.143 | 0 |
Only significant results have been mentioned here. Based on estimated marginal means. *The mean difference is significant at the 0.05 level. aAdjustment for multiple comparisons: Bonferroni. Intervention 1 – Pre, 2 – During and 3 – Post. HR: Heart rate, SDNN: The standard deviation of NN intervals, TP: Total power, LF: Low frequency, HRV: Heart rate variability
References
- Effect of specific melodic scales of Indian music in reducing state and trait anxiety: A randomized clinical trial In: Psychol Music. 2021.
- [Google Scholar]
- The joy of heartfelt music: An examination of emotional and physiological responses. Int J Psychophysiol. 2017;120:118-25.
- [CrossRef] [PubMed] [Google Scholar]
- Music as a therapeutic intervention on an inpatient neuroscience unit. Complement Ther Clin Pract. 2010;16:138-42.
- [CrossRef] [PubMed] [Google Scholar]
- Active and passive rhythmic music therapy interventions differentially modulate sympathetic autonomic nervous system activity. J Music Ther. 2019;56:240-64.
- [CrossRef] [PubMed] [Google Scholar]
- The effect of music on decreasing arousal due to stress: A meta-analysis. J Music Ther. 2004;41:192-214.
- [CrossRef] [PubMed] [Google Scholar]
- Music can facilitate blood pressure recovery from stress. Br J Health Psychol. 2004;9:393-403.
- [CrossRef] [PubMed] [Google Scholar]
- Dynamic interactions between musical, cardiovascular, and cerebral rhythms in humans. Circulation. 2009;119:3171-80.
- [CrossRef] [PubMed] [Google Scholar]
- Music versus lifestyle on the autonomic nervous system of prehypertensives and hypertensives-a randomized control trial. Complement Ther Med. 2015;23:733-40.
- [CrossRef] [PubMed] [Google Scholar]
- Effects of music therapy on the cardiovascular and autonomic nervous system in stress-induced university students: A randomized controlled trial. J Altern Complement Med. 2016;22:59-65.
- [CrossRef] [Google Scholar]
- Can music influence cardiac autonomic system? A systematic review and narrative synthesis to evaluate its impact on heart rate variability. Complement Ther Clin Pract. 2020;39:101162.
- [CrossRef] [PubMed] [Google Scholar]
- The influence of music upon electrocardiograms and blood pressure. Am J Physiol Legacy Content. 1918;46:35-8.
- [CrossRef] [Google Scholar]
- Music versus diazepam to reduce preoperative anxiety: A randomized controlled clinical trial. Rev Esp Anestesiol Reanim. 2007;54:355-8.
- [Google Scholar]
- Normative data and gender differences in heart rate variability in the healthy young individuals aged 18-30 years, a South Indian cross-sectional study. Indian Pacing Electrophysiol J. 2021;21:112-9.
- [CrossRef] [PubMed] [Google Scholar]
- The effect of self-selected music during colonoscopy on anxiety, heart rate, and blood pressure. Appl Nurs Res. 2002;15:126-36.
- [CrossRef] [PubMed] [Google Scholar]
- The effects of music intervention on anxiety in the patient waiting for cardiac catheterization. Intensive Crit Care Nurs. 2001;17:279-85.
- [CrossRef] [PubMed] [Google Scholar]
- Cardiovascular, cerebrovascular, and respiratory changes induced by different types of music in musicians and non-musicians: The importance of silence. Heart. 2006;92:445-52.
- [CrossRef] [PubMed] [Google Scholar]
- The sound of silence is music to the heart. Heart. 2006;92:433-4.
- [CrossRef] [PubMed] [Google Scholar]
- Effects of music therapy on autonomic nervous system activity, incidence of heart failure events, and plasma cytokine and catecholamine levels in elderly patients with cerebrovascular disease and dementia. Int Heart J. 2009;50:95-110.
- [CrossRef] [PubMed] [Google Scholar]
- Cognitive test performance and background music. Percept Mot Skills. 1997;85:1435-8.
- [CrossRef] [PubMed] [Google Scholar]
- Effects of pre-exercise listening to slow and fast rhythm music on supramaximal cycle performance and selected metabolic variables. Arch Physiol Biochem. 2003;111:211-4.
- [CrossRef] [PubMed] [Google Scholar]
- Music can enhance exercise-induced sympathetic dominancy assessed by heart rate variability. Tohoku J Exp Med. 2005;206:213-8.
- [CrossRef] [PubMed] [Google Scholar]
- Multicultural music therapy: The world music connection. J Music Ther. 1988;25:17-27. Available from: https://www.academic.oup.com/jmt/article-abstract/25/1/17/1026880?redirectedFrom=fulltext [Last accessed on 2020 Apr 29]
- [CrossRef] [Google Scholar]
- 1979. :320. Available from: https://www.books.google.fr/books?id=elu_ye49ga0c&dq=editions:isbn0458938300&hl=fr
- [Google Scholar]
- The Rāgs of North Indian Music: Their Structure and Evolution In: Mumbai: Popular Prakashan. 1995. p. :252.
- [Google Scholar]
- Ragas, Recipes, and Rasas, Oxford Handbooks Online. 2015. Available from: https://www.oxfordhandbooks.com/view/10.1093/oxfordhb/9780199935321.001.0001/oxfordhb-9780199935321-e-43 [Last accessed on 2020 Apr 29]
- [CrossRef] [Google Scholar]
- Combination of music with lifestyle modification versus lifestyle modification alone on blood pressure reduction-a randomized controlled trial. Complement Ther Clin Pract. 2016;23:102-9.
- [CrossRef] [PubMed] [Google Scholar]
- nMaster 2.0-Sample Size Software. 2021. Available from: https://www.cmc-biostatistics.ac.in/nmaster/index.html [Last accessed on 2021 Jul 19]
- [Google Scholar]
- Acute Effects of Passive Listening to Indian Musical Scale on Blood Pressure and Heart Rate Variability among Healthy Young Individuals-a Randomized Controlled Trial. bioRxiv.
- [Google Scholar]
- Quality Assessment of Weight and Height Measurements in the WHO MONICA Project: National Institute for Health and Welfare, Finland, on Behalf of the World Health Organization and the WHO MONICA Project Investigators. 1999. Available from: https://www.thl.fi/publications/monica/bmi/bmiqa20.htm [Last accessed on 2020 May 02]
- [Google Scholar]
- Reliability of an automatic monitor for blood pressure measurement. Rev Med Chil. 2018;146:190-5.
- [CrossRef] [PubMed] [Google Scholar]
- Different types of sounds and their relationship with the electrocardiographic signals and the cardiovascular system-review. Front Physiol. 2018;9:525.
- [CrossRef] [PubMed] [Google Scholar]
- Hindustani S@R, Improvisation in Indian Classical Music, Medium. 2020. Available from: https://www.medium.com/@raaghindustani/improvisation-in-indian-classical-music-f15c48bca25 [Last accessed on 2020 May 02]
- [Google Scholar]
- Improvisation in Carnatic Music. 2020. Available from: http://www.carnaticcorner.com/articles/improvisation.html [Last accessed on 2020 May 02]
- [Google Scholar]
- Seed ideas and creativity in Hindustani raga music: Beyond the composition-improvisation dialectic. Ethnomusicol Forum. 2017;26:116-32.
- [CrossRef] [Google Scholar]
- Hindi Film Songs Based on Raga Bhimpalasi, My Views on Bollywood. 2018. Available from: https://www.myviewsonbollywood.wordpress.com/tag/hindi-film-songs-based-on-raga-bhimpalasi [Last accessed on 2018 Jun 13]
- [Google Scholar]
- Bhimpalasi. 2020. Wikipedia. Available from: https://www.en.wikipedia.org/w/index.php?title=Bhimpalasi_and_oldid=951507010 [Last accessed on 2020 Apr 30]
- [Google Scholar]
- Physiological arousal response to differing musical genres. Modern Psychol Stud. 2014;20:25-33.
- [Google Scholar]
- The effect of music on arousal, enjoyment, and cognitive performance. Psychol Music. 2019;47:539-50.
- [CrossRef] [Google Scholar]
- The rewarding aspects of music listening are related to degree of emotional arousal. PLoS One. 2009;4:e7487.
- [CrossRef] [PubMed] [Google Scholar]
- An overview of heart rate variability metrics and norms. Front Public Health. 2017;5:258.
- [CrossRef] [PubMed] [Google Scholar]
- Film Songs in Rag Bhimpalasi. 2021. Available from: https://www.chandrakantha.com/raga_raag/film_song_raga/bhimpalasi.shtml [Last accessed on 2021 Jul 19]
- [Google Scholar]
- Music-syntactic processing and auditory memory: Similarities and differences between ERAN and MMN. Psychophysiology. 2009;46:179-90.
- [CrossRef] [PubMed] [Google Scholar]
- Task context influences brain activation during music listening. Front Hum Neurosci. 2017;11:342.
- [CrossRef] [PubMed] [Google Scholar]
- Pupils dilate for vocal or familiar music. J Exp Psychol Hum Percept Perform. 2016;42:1061-5.
- [CrossRef] [PubMed] [Google Scholar]
- Effects of music on arousal during imagery in elite shooters: A pilot study. PLoS one. 2017;12:e0175022.
- [CrossRef] [PubMed] [Google Scholar]
- Effects of relaxing and arousing music during imagery training on dart-throwing performance, physiological arousal indices, and competitive state anxiety. Front Psychol. 2018;9:14.
- [CrossRef] [PubMed] [Google Scholar]
- Music and Emotions in the Brain: Familiarity matters. PLoS One. 2011;6:e27241.
- [CrossRef] [PubMed] [Google Scholar]
- Heart rate variability with repetitive exposure to music. Biol Psychol. 2005;70:61-6.
- [CrossRef] [PubMed] [Google Scholar]
- Non-expert listeners show decreased heart rate and increased blood pressure (fear bradycardia) in response to atonal music. Front Psychol. 2015;6:1646.
- [CrossRef] [PubMed] [Google Scholar]
- Expression of emotion in eastern and western music mirros vocalization. PLos One. 2012;7:e31942.
- [CrossRef] [PubMed] [Google Scholar]
- Emotional responses to Hindustani raga music: The role of musical structure. Front Psychol. 2015;6:513.
- [CrossRef] [PubMed] [Google Scholar]
- Self-selected “favourite” stimulative and sedative music listening-how does familiar and preferred music listening affect the body? Nord J Music Ther. 2009;18:150-66.
- [CrossRef] [Google Scholar]
- Clinical outcomes of different tempos of music during exercise in cardiac rehabilitation patients. Int J Exerc Sci. 2017;10:681-9.
- [Google Scholar]
- The cardiovascular effect of musical genres. Dtsch Arzteblatt Int. 2016;113:347-52.
- [CrossRef] [Google Scholar]
- The impact of sound exposure on heart rate variability in adolescent students. Physiol Res. 2018;67:695-702.
- [CrossRef] [PubMed] [Google Scholar]
- Treating hypertension with a device that slows and regularises breathing: A randomised, double-blind controlled study. J Hum Hypertens. 2001;15:271-8.
- [CrossRef] [PubMed] [Google Scholar]
- Effect of respiratory pattern on automated clinical blood pressure measurement: An observational study with normotensive participants. Clin Hypertens. 2017;23:15.
- [CrossRef] [PubMed] [Google Scholar]
- The impact of music guided deep breathing exercise on blood pressure control-a participant blinded randomised controlled study. Med J Malaysia. 2018;73:233-8.
- [Google Scholar]
- Auditory stimulation and cardiac autonomic regulation. Clinics. 2012;67:955-8.
- [CrossRef] [Google Scholar]
- Superior analgesic effect of an active distraction versus pleasant unfamiliar sounds and music: The influence of emotion and cognitive style. PLoS One. 2012;7:e29397.
- [CrossRef] [PubMed] [Google Scholar]
- Emotional valence contributes to music-induced analgesia. Pain. 2008;134:140-7.
- [CrossRef] [PubMed] [Google Scholar]
- A comparison of the effects of preferred music, arithmetic and humour on cold pressor pain. Eur J Pain Lond Engl. 2006;10:343-51.
- [CrossRef] [PubMed] [Google Scholar]
- The effectiveness of music in relieving pain in cancer patients: A randomized controlled trial. Int J Nurs Stud. 2010;47:1354-62.
- [CrossRef] [PubMed] [Google Scholar]
- Music preference as a factor of music distraction. Percept Mot Skills. 1976;43:337-8.
- [CrossRef] [Google Scholar]
- The influence of subject-selected versus experimenter-chosen music on affect, anxiety, and relaxation. J Music Ther. 1993;30:210-23.
- [CrossRef] [Google Scholar]
- Temporal changes in electroencephalographic power spectrum on passive listening to three selected melodic scales of Indian music on healthy young individuals-a randomized controlled trial. Music Med. 2022;14:6-26.
- [CrossRef] [Google Scholar]
- Expression of emotion in eastern and western music mirrors vocalization. PLoS One. 2012;7:e31942.
- [CrossRef] [PubMed] [Google Scholar]
- Svara. 2020. Wikipedia. Available from: https://www.en.wikipedia.org/w/index.php?title=Svara_and_oldid=948781017 [Last accessed on 2020 Apr 30]
- [Google Scholar]
- Music of India-a Brief Outline-Part Four. 2015. Sreenivasarao's Blogs. Available from: https://www.sreenivasaraos.com/2015/04/22/music-of-india-a-brief-outline-part-four [Last accessed on 2020 May 02]
- [Google Scholar]
- Film Songs in Rag Bhimpalasi. 2018. Available from: https://www.chandrakantha.com/raga_raag/film_song_raga/bhimpalasi.shtml [Last accessed on 2022 Feb 17]
- [Google Scholar]
- Just Intonation. 2020. Wikipedia. Available from https://www.en.wikipedia.org/w/index.php?title=Just_intonation_and_oldid=953532119 [Last accessed on 2020 May 02]
- [Google Scholar]
- Equal Temperament. 2020. Wikipedia. Available from https://www.en.wikipedia.org/w/index.php?title=Equal_ temperament_and_oldid=951700379 [Last accessed on 2020 May 02]
- [Google Scholar]


