
Translate this page into:
A rat model of septic shock using live Escherichia coli and response to Noradrenaline

*Corresponding author: Sajo Thomas, Department of Physiology, Christian Medical College, Vellore, Tamil Nadu, India. sajo.thomas@cmcvellore.ac.in
-
Received: ,
Accepted: ,
How to cite this article: Thomas S, Manickam SA, Mukadam FA, Aravindan V, Subramani S. A rat model of septic shock using live Escherichia coli and response to Noradrenaline. Indian J Physiol Pharmacol 2022;66:85-97.
Abstract
Objectives:
Popular animal models of septic shock involve injections of endotoxin (bacterial lipopolysaccharide). Other methods that induce sepsis are often time-consuming and require long-term monitoring facilities. Further, individual models using different bacterial strains can deepen our understanding of sepsis pathophysiology. Hence, our objective was to develop an acute and functional Wistar rat model of septic shock using live strains of Escherichia coli and then administer Noradrenaline, a known sympathomimetic drug, to study if the response is along expected lines.
Materials and Methods:
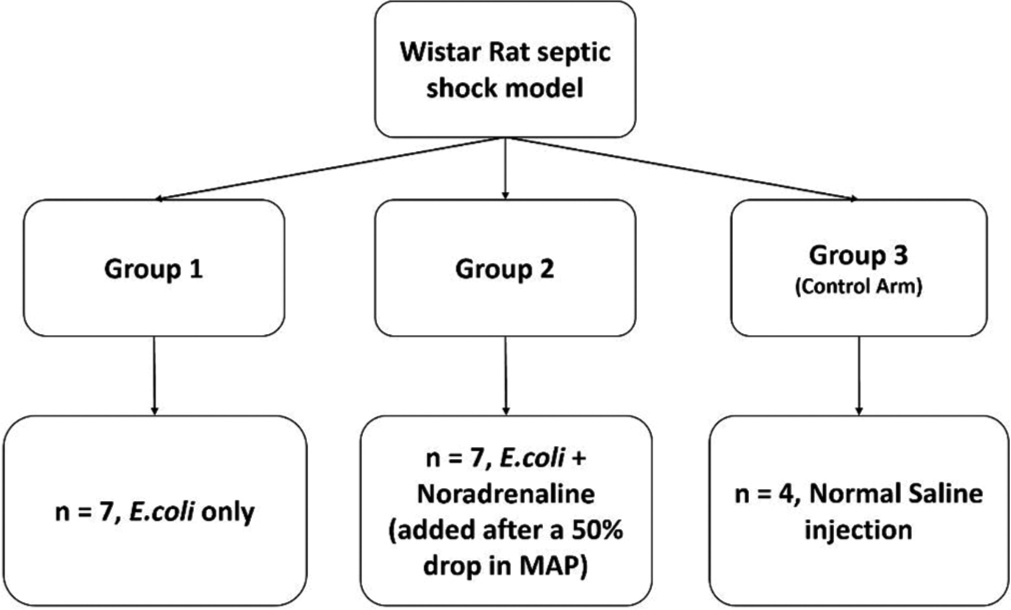
After random allocation to one of three groups (Group 1 – E. coli alone, n=7; Group 2 – E. coli followed by Noradrenaline, n = 7 and Group 3 – control (n = 4), which received saline injections), Wistar rats were anesthetised and intra-arterial pressure was recorded from carotid artery catheter. Live E. coli suspended in normal saline (5 Mcfarland concentration; dose – 650 uL/100 g body weight) was injected through the tail vein to induce sepsis. When mean arterial pressure dropped to 50% of its value before E. coli injection, Noradrenaline was injected in Group 2.
Results:
The average time (t1, n = 14) for the septic shock to set in was about 1.94 ± 0.97 h. Six out of seven rats (Group 1) died within 60 min without intervention. The addition of Noradrenaline after hypotension in Group 2 prolonged the time to death significantly by about 170 min.
Conclusion:
The rat septic shock model using E. coli described in the study is an acute, stable, and functional model to study various aspects of septic shock. Administration of Noradrenaline prolonged the animal’s life in septic shock as expected. Future studies using other common sepsis agents encountered in clinics can be undertaken similarly.
Keywords
Septic shock
Animal model
Wistar rats
Escherichia coli
Noradrenaline

INTRODUCTION
Sepsis and sepsis-related events place a heavy burden on the healthcare system. Fleischmann et al. (2016) report about 31.5 million sepsis cases and 19.4 million severe sepsis cases and about 5.3 million deaths annually.[1] These are crude estimates that constantly change; nevertheless, they help understand the disease burden. A significant obstacle in combating sepsis is understanding the pathophysiology of the disease process, which is further complicated by the differences in the pathobiology of various organisms involved. Moreover, discussions over the treatment of various sepsis stages have many controversies over treatment with corticosteroids, fluid resuscitation, and vasopressor agents.[2] Hence, it is necessary to have a proper model for understanding the disease processes to tackle the multi-dimensional aspects of sepsis. Some of the most common organisms causing sepsis and septic shock are the Gram-negative bacilli Escherichia coli, Klebsiella pneumoniae, and Gram-positive bacteria such as Staphylococcus and Pneumococcus.[3] This study aimed to develop a stable and acute septic shock model using live E. coli and record various cardiovascular parameters. A secondary aim was to see if Noradrenaline, a known sympathomimetic drug, alters the course of disease in an animal in septic shock along expected lines.
MATERIALS AND METHODS
After obtaining approval from Institutional Review Board (IRB Min NO. 11033) and the Institutional Animal Ethics Committee (IAEC approval number – 8/2018), experiments were conducted on adult Wistar rats (WR) (11 Males and seven Females) weighing between 250 and 350 g. The sample size was based on (a) previous studies that used non-parametric statistical analysis and (b) considerations of the animal ethics committee. The institutional animal house provided the animals, which were randomly allocated to one of three groups, namely, E. coli only group (Group 1); E. coli + Noradrenaline group (Group 2); or the control group (Group 3), where only normal saline was injected. The whole experiment schema is shown in [Supplementary Figure 1].

- Graphical representation of values of the various parameters in particular instances of groups G1, G2, and G3.
The experiment’s significant steps were: (A) Tail vein cannulation for infusion of anaesthetic agent and maintaining the animal under a good plane of anaesthesia; (B) preparation of the E. coli inoculum and C. carotid artery cannulation for intra-arterial pressure monitoring.
Tail vein cannulation
The rat’s vertebral column continues into the tail as the tail vertebra, which forms the innermost core, is surrounded by tendons and dorsal coccygeal muscles. The neurovascular structures run their course through the subcutaneous tissue. In this lie the two considerably large lateral veins [Supplementary Figure 2]. The lateral veins maintain their luminal diameter without significant change until the tip.[4] These were most suitable for continuous IV infusion of anaesthetics, organisms, and other drugs through a 3-way connector [Supplementary Figure 3].

- Representative data from Group 2 (Escherichia coli + Noradrenaline); three labelled vertical lines denoted are: (A) Addition of E. coli; (B) addition of Noradrenaline (mean arterial pressure dropped to 50%) and (C) death. The pressure waves during the three 1-min-long instances (shown as dashed boxes) are expanded below. The time interval between A and B is t1 and the time taken to die after a 50% drop in pressure (B to C) is t2.
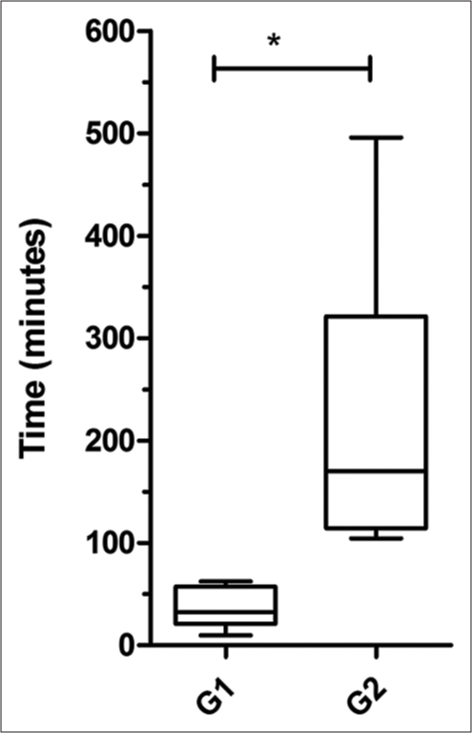
- Comparison of the survival time after a 50% drop in MAP (t2) between Group 1 and 2 (* p <0.05)
Anaesthesia was induced by injecting a cocktail of Ketamine (80 mg/kg) and Midazolam (1.5 mg/kg) intraperitoneally. Once anesthetised, a tourniquet is tied at the root of the tail such that the lateral veins bulge. The scales overlying the bulging vein are removed and a small incision made parallelly exposes the vein. The fascia is cleared with fine-tipped forceps, which causes the vein to bulge prominently, rendering it more comfortable to cannulate. Like any other IV cannulation, a 24G BD Insyte® was used to access one of the two lateral veins. The catheter was secured in place with tape. A three-way cannula was attached to the catheter after priming it with a Hep-lock solution (10 ml contains Heparin Sodium 10 IU + Sodium Chloride 0.9% and used to prevent clotting in the catheters). An infusion pump line loaded with the anaesthetic (Ketamine 80 mg/kg/h and Midazolam 1.5 mg/kg/h) and IV fluid, delivered the required dose. We successfully maintained the animal alive for more than 8 h with this setup.
Preparation of the E. coli inoculum
Live E. coli bacilli cultured on agar plates were procured from the institution’s microbiology department. The organism was scraped using sterile loops and mixed with 2 ml of sterile saline solution, matching McFarland standard 5.0 units. This saline E. coli broth was injected into the rat intravenously through the three-way cannula. Standardisation experiments helped fix a dose of 650 µL of the 5.0 McFarland turbid E. coli saline broth per 100 g of the animal.
C. Carotid artery cannulation was performed after dissecting the Carotid artery in the neck and inserting a fluid-filled catheter connected to an iPex pressure transducer for intra-arterial pressure recordings. First, the entire neck region was shaved and wiped with 70% ethanol. Then, with a straight incision close to the midline and separating the subcutaneous fascia, the submandibular and sublingual salivary glands were dissected out and reflected over the neck, making the neck muscles over the trachea evident. Next, these muscles were retracted from the midline to visualise the pulsating carotid artery behind the trachea. The carotid artery was then carefully lifted and freed of any fascial attachments, nerves, or the carotid sheath. Next, two threads, one at the head end and the other placed inferiorly, were passed under the artery, looped without fastening, and kept ready. The artery was then cannulated using a 24-gauge IV catheter after clamping the artery close to the heart with a bulldog clamp [Supplementary Figure 4]. Once the catheter was inside the artery, the two looped threads were tied over the artery to secure the IV catheter. The fluid-filled pressure transducer system (calibrated before starting the experiment with an aneroid manometer) was immediately attached to the intra-arterial catheter and the bulldog clamp was removed, permitting the carotid artery pressure recordings on the monitor. In addition to, the intra-arterial pressure recordings, ECG, and respiration (using an in-house built respiratory belt described elsewhere) were also monitored. The animals were sacrificed with an overdose of anaesthesia (at the end of 8 h) or died of septic shock. The carcasses were disposed of according to the bio-safety standards of the institution.
Data acquisition
The ‘ADINSTRUMENT PowerLab 15T®’ data acquisition device (sampling @ 1000Hz) and the accompanying LabChart® software were used for recording data.
Analysis
Data analysis was done using a program written in Matlab (the link to the code is given in the Supplementary Data file). The following parameters were studied – systolic blood pressure (SBP), diastolic blood pressure (DBP), mean arterial pressure (MAP), heart rate (HR), and pulse pressure (PP). These above-mentioned cardiovascular parameters obtained after executing the program were from the following 1-min-long instances: (i) Before the addition of E. coli or saline in all three groups; (ii) just before the addition of Noradrenaline in group 2 and (iii) before the death or sacrifice of the animal in all three groups. In addition, two different time intervals, that is, the time taken for the MAP to drop to 50% from the MAP observed at the beginning of the experiment (t1) and the time it took for the animal to die from the moment of 50% MAP drop (t2), were also calculated.
RESULTS
All the animals injected with the inoculum died of progressive hypotension (100% mortality). In all experiments, septic shock was defined as a 50% decrease in MAP after the addition of E. coli. For animals that received E. coli (n = 14), the average time (t1) for the septic shock to set in was about 1.94 ± 0.97 h [range 0.6–4.22 h; Table 1]. In Group 1, where E. coli alone was injected, blood pressure started decreasing after some time, eventually leading to death. Two time periods were selected to analyse blood pressure profiles, each of 1-min duration, one before the addition of E. coli and one before death in Group 1 [Supplementary Figure 5]. The addition of E. coli caused a significant decrease in SBP, DBP, MAP, and HR [P < 0.05, Supplementary Figure 6]. PP decreased in four out of seven experiments, while it increased in three experiments [Group 1 in Figure 1].
In Group 2, to test the model’s validity, Noradrenaline, a drug with a predictable response (at a dose of 0.3–0.6 µg/kg/min), was added after observing a 50% pressure drop. In Group 2, three sections of the BP recording were analysed – (1) before E. coli, (2) before Noradrenaline and (3) after Noradrenaline (before death), as depicted in [Figure 2]. The blood pressure parameters reported from the third section in this group were at the point of the highest value of systolic pressure achieved due to the administration of Noradrenaline.
The values of SBP, DBP, and MAP before the addition of E. coli were not statistically different [P > 0.05, Supplementary Figure 7] from the values due to Noradrenaline [i.e., A vs. C, Table 2]. In contrast, these three parameters were significantly different from those before intervention with Noradrenaline [i.e., A vs. B, Table 2]. Hence, Noradrenaline positively affected SBP, DBP, and MAP in five of seven animals [Group 2 in Figure 1]. However, the HR values remained statistically different. HR of five animals declined further even after Noradrenaline, whereas only two animals had increased HR. PP values decreased in five animals and increased in the other two. As expected, Noradrenaline prolonged the survival time (t2) in Group 2 (n = 7) by about 3 h (217.60 ± 170.25 min); [Table 1 and Figure 3]. The median survival time (i.e., t2) for the E. coli-only group (G1) was 32.4 min and that of the E. coli + Noradrenaline group (G2) was 170.3 min, which is a five-fold increase in survival time even after a 50% drop in MAP. The observed difference between the two groups (1 and 2) was significant. Noradrenaline briefly reversed the decrease in SBP, DBP, and MAPs but did not reverse the bradycardia induced by E. coli.
| Group 1 (n=7) | Group 2 (n=7) | |||
|---|---|---|---|---|
| t1* (minutes) | t2* (minutes) | t1* (minutes) | t2* (minutes) | |
| Mean±SD | 136±74 | 38±20 | 96±28 | 217±142 |
| Median | 131 | 32 | 90 | 170 |
| Min and Max | 36, 253 | 9, 62 | 67, 151 | 104, 496 |
| The average time for the septic shock to develop (t1) due to intravenous injection of Escherichia coli (combined from Group 1 and Group 2, n=14) is: | ||||
| Mean±SD | 1.94±0.97 h | |||
| Min and Max | 0.60 h, 4.22 h | |||
| Parameters | Before Escherichia coli(A) | Before Noradrenaline (B) | After Noradrenaline (C) |
|---|---|---|---|
| Systolic pressure (mmHg) | 160.9±24.57* | 111.3±33.39* | 140.3±44.18 |
| Diastolic pressure (mmHg) | 119.6±24.36* | 64.57±22.59* | 99.19±27.95 |
| Mean Arterial Pressure (mmHg) | 138.5±24.08* | 84.8±26.54* | 116.8±34.98 |
| Heart Rate (beats/min) | 361±32.78*# | 318.4±38.69* | 241.8±88.59*# |
| Pulse Pressure (mmHg) | 41.31±14.39 | 46.73±20.28 | 41.11±20.16 |
A control arm (n = 4) was included in the study [Group 3 in Figure 1]. Here, the only sterile normal saline solution was given intravenously. The control animals lived for 8 h. Animals in this group were then euthanised with an overdose of the anaesthesia. Again, two sections in the recordings, each of 1-min duration, were selected for analysis, one at the start of the experiment and the other just before the experiment’s end [Supplementary Figure 8]. There was no significant difference between the values at the start and end of the experiment.
DISCUSSION
Since the discovery of the endotoxin by Richard Pfeiffer using guinea pigs injected with Vibrio cholerae, many investigators have tried to replicate reproducible and straightforward models using laboratory animals.[5,6] Three major categories have been put forth as animal sepsis models: (A) The administration of toxins like lipopolysaccharides (LPS), (B) injection of bacteria into the animal through the vasculature, and (C) different types of Peritonitis models, such as colon ascendens stent peritonitis (CASP) and cecal ligation and puncture (CLP).[5-8] Toxemia models have been, to date, the most used method for sepsis studies in animal models. This is because it is easy to store the endotoxins in the lyophilised form (most commonly bacterial LPS) and an accurate dose of the endotoxin can be measured and administered. Several chemical agents, such as LPS, lipoteichoic acid, zymosan, peptidoglycans, and others have been used.[9-15] The disadvantage of such a model is that it does not replicate the disease entirely, as the live organism is absent in the bloodstream.
Faecal peritonitis by the cecal ligation method or surgical perforation was made known by Wichterman et al.[6] and has been used widely since then. This model does not allow for the effect of a single organism in inducing sepsis but involves mixed gut microbiota. The experiments take a couple of days to monitor, requiring specialised centres and a larger workforce. Another disadvantage is the inability to regulate the infectant’s dose and, thereby, the sepsis severity. CASP is a later model similar to CLP. Instead of ligating the caecum at the ileocecal junction, a stent is sutured into place inside the caecum to maintain a constant flow of faecal matter into the peritoneal cavity.[16] Death generally occurs 1–2 days after the surgery. Several soft-tissue infection models have been described, such as surgically lodging cloth soaked in feces into the animal soft tissue to create a local infection.[17] Furthermore, some have used subdermal inoculum of bacteria, causing a dermal abscess.[6,18] Intravascular infusion of live bacteria has been tried in baboons, dogs, pigs, and sheep to study different aspects of sepsis.[19-23] In dogs, E. coli injections produced profound hypotension with low cardiac output and hypoperfusion of the splanchnic circulation, which was not amenable to fluid resuscitation.[23]
In this study, we have demonstrated the development of septic shock in all the animals injected with live E. coli (a dose of 650 µL/100g of 5 McFarland unit turbidity) administered intravenously through the tail vein. This produced a 50% decrease in MAP (n = 14) by 2.5 h. A quicker time to hypotension means that these experiments can be conducted quickly within a day using a smaller workforce. Most other models require several hours to days for the septic shock to set in. In those models, the animals must be monitored at regular intervals for several days, and therefore, they are resource and capital-intensive. Although there have been many septic shock outcomes in several of these models, an acute, stable, and reproducible septic shock model for quicker experimentation was a felt need. The model we have developed using E. coli results in septic shock quickly. The variations in the time to develop shock are a pointer to the biological variability within WR to E. coli pathogenicity.
Our model gives adequate time to plan multiple interventions for studying pathophysiology. The positive effects of Noradrenaline administration on the cardiovascular parameters and five-fold increase in the median survival time meant that the live E. coli septic shock in WR’ model is a functional model in which various treatment modalities can be tested. Such models can be created for other clinically relevant organisms. The E. coli septic shock model demonstrated here also gives the advantage of titrating the dose and the specificity of the strain involved. It is also possible to isolate a patient’s strain to set up a patient-specific model. Moreover, experiments can be planned with sublethal doses of the inoculum to study antibiotic sensitivity and resistance testing. This model provides scope for further studies on various cardiovascular dynamics focusing on the interactions happening in the endocrine, haematological, autonomic, and cardiovascular axis during septic shock.[24,25] Targeted physiological studies to enlighten different processes happening during such a critical situation are possible with this model.
CONCLUSION
The WR septic shock model using E. coli is an acute, stable, and functional model to study various aspects of septic shock. Administration of Noradrenaline prolonged the animal’s life in septic shock as expected, confirming the model’s validity. Septic models of organisms other than E. coli, commonly encountered in clinical practice that poses formidable therapeutic challenges, can be taken up in the future.
Declaration of consent
Institutional Review Board (IRB) permission obtained for the study.
Financial support and sponsorship
Institutional Fluid Research Grant.
Conflicts of interest
There are no conflicts of interest.
SUPPLEMENTARY DATA
- Scheme of experiments.

- Schematic cross-section diagram of the rat tail showing the artery and vein locations supplying the tail.

- Steps for tail vein cannulation. (1) Animal handling and induction of anaesthesia through intraperitoneal injection, (2) tail tourniquet, (3) incision to access the vein; 4) 24G IV catheter primed with HepLock solution ready for cannulation, and (5) 3-way connector attached.

- Carotid artery dissection with neck incision (1), (2) S – submandibular and sublingual salivary glands, (3) M-neck muscles, (4) carotid artery (CA) with carotid sheath (CS), (5) the artery is lifted with the spatula while the proximal end of the artery clamped with a bulldog clamp and (6) successful catheterisation.

- Representative plot from Group 1 (E. coli only). The three vertical lines marked are (A) the addition of E. coli, (B) the 50% drop in MAP, and (C) death. The time interval between A and B (development of septic shock) is t1 and t2 is the time taken until death from the drop point (i.e., from B to C). The cardiovascular parameters (SBP, DBP, MAP, HR, and PP) were obtained from two regions shown by dashed boxes that are each one minute long recordings. The lower panels show the expanded sections (shown by arrows) of the two instances, that is, before the addition of E. coli and before death. SBP: Systolic blood pressure, DBP: Diastolic blood pressure, MAP: Mean arterial pressure, HR: Heart rate, PP: Pulse pressure, E. coli: Escherichia coli.

- Data from Group 1, n = 7. Inter-quartile ranges of SBP, DBP, MAP, HR, and PP at two instances: Before and After the addition of E. coli. (*P = 0.0156 WSR test). E. coli: Escherichia coli, WSR: Wilcoxon signed-rank.

- Group 2 (E. coli + noradrenaline, n = 7) - SBP, DBP, MAP, HR, and PP at three instances are plotted. (1) Before the addition of E. coli, (2) before the intervention when the rat is in septic shock due to E. coli., (3) after intervention with noradrenaline. (*P = 0.0156, WSR). SBP: Systolic blood pressure, DBP: Diastolic blood pressure, MAP: Mean arterial pressure, HR: Heart rate, PP: Pulse pressure, WSR: Wilcoxon signed-rank, E. coli: Escherichia coli.

- Control group, n = 4. SBP, DBP, MAP, HR, and PP are compared and plotted. 1 – At the start of the experiment, 2 – At the end of the experiment. SBP: Systolic blood pressure, DBP: Diastolic blood pressure, MAP: Mean arterial pressure, HR: Heart rate, PP: Pulse pressure.
The code used to analyze the data is given in the GitHub link below:
https://github.com/ST2021cmc/WRSS/blob/36db423cbb5eea8512485084dc489531d397bb51/WR_SS_1.m
Data:
Group 1: Only Escherichia coli
| S. No. | GROUP | SBP | DBP | MAP | HR | PP |
|---|---|---|---|---|---|---|
| 1. | 1 | 137.25 | 85.70 | 105.49 | 322.61 | 51.55 |
| 2. | 1 | 146.98 | 80.79 | 107.62 | 301.71 | 66.19 |
| 3. | 1 | 103.26 | 54.13 | 71.58 | 259.10 | 49.13 |
| 4. | 1 | 160.98 | 115.44 | 138.73 | 323.09 | 45.53 |
| 5. | 1 | 178.97 | 120.04 | 148.33 | 299.00 | 58.94 |
| 6. | 1 | 118.71 | 67.97 | 89.90 | 304.49 | 50.73 |
| 7. | 1 | 168.33 | 109.07 | 138.57 | 355.58 | 59.26 |
| S. No. | GROUP | SBP | DBP | MAP | HR | PP |
|---|---|---|---|---|---|---|
| 1. | 1 | 53.22 | 5.31 | 18.86 | 96.16 | 47.92 |
| 2. | 1 | 66.99 | 9.39 | 27.66 | 55.47 | 57.60 |
| 3. | 1 | 62.14 | −3.13 | 16.78 | 231.39 | 65.27 |
| 4. | 1 | 63.61 | 22.12 | 36.32 | 107.35 | 41.49 |
| 5. | 1 | 74.37 | −1.94 | 17.06 | 96.40 | 76.31 |
| 6. | 1 | 75.95 | 8.75 | 37.19 | 258.30 | 67.19 |
| 7. | 1 | 64.63 | 14.83 | 34.13 | 36.24 | 49.80 |
Group 2: Escherichia coli and Intervention
| S. No. | GROUP | SBP | DBP | MAP | HR | PP |
|---|---|---|---|---|---|---|
| 1. | 2 | 151.98 | 91.32 | 118.58 | 358.68 | 60.65 |
| 2. | 2 | 122.47 | 106.71 | 115.12 | 363.64 | 15.76 |
| 3. | 2 | 189.24 | 158.99 | 173.74 | 298.59 | 30.26 |
| 4. | 2 | 139.36 | 96.35 | 114.53 | 370.45 | 43.01 |
| 5. | 2 | 178.34 | 134.47 | 153.70 | 362.22 | 43.87 |
| 6. | 2 | 161.58 | 113.80 | 133.99 | 410.44 | 47.78 |
| 7. | 2 | 183.14 | 135.31 | 160.14 | 362.92 | 47.84 |
| S. No. | GROUP | SBP | DBP | MAP | HR | PP |
|---|---|---|---|---|---|---|
| 1. | 2 | 143.14 | 95.70 | 113.12 | 176.19 | 47.45 |
| 2. | 2 | 102.85 | 84.21 | 94.44 | 231.13 | 18.65 |
| 3. | 2 | 88.78 | 76.91 | 78.15 | 99.57 | 11.87 |
| 4. | 2 | 107.59 | 64.84 | 85.72 | 366.25 | 42.74 |
| 5. | 2 | 202.93 | 131.29 | 159.30 | 305.04 | 71.63 |
| 6. | 2 | 145.27 | 100.46 | 119.79 | 292.46 | 44.81 |
| 7. | 2 | 191.57 | 140.95 | 167.32 | 222.20 | 50.63 |
| S. No. | GROUP | SBP | DBP | MAP | HR | PP |
|---|---|---|---|---|---|---|
| 1. | 2 | 88.76 | 29.35 | 53.78 | 300.59 | 59.41 |
| 2. | 2 | 60.18 | 47.97 | 55.12 | 324.62 | 12.21 |
| 3. | 2 | 107.69 | 77.22 | 94.87 | 294.02 | 30.47 |
| 4. | 2 | 114.08 | 70.11 | 91.47 | 345.84 | 43.97 |
| 5. | 2 | 121.41 | 74.04 | 97.14 | 269.53 | 47.37 |
| 6. | 2 | 117.33 | 54.57 | 72.45 | 387.32 | 62.76 |
| 7. | 2 | 169.67 | 98.72 | 128.76 | 306.64 | 70.95 |
Group 3: Negative control
| S. No. | GROUP | SBP | DBP | MAP | HR | PP |
|---|---|---|---|---|---|---|
| 1. | 3 | 166.37 | 120.22 | 142.48 | 333.36 | 46.15 |
| 2. | 3 | 133.52 | 86.32 | 105.34 | 328.58 | 47.20 |
| 3. | 3 | 117.32 | 100.93 | 110.78 | 289.57 | 16.39 |
| 4. | 3 | 160.16 | 130.83 | 147.46 | 344.70 | 29.33 |
| S. No. | GROUP | SBP | DBP | MAP | HR | PP |
|---|---|---|---|---|---|---|
| 1. | 3 | 159.81 | 115.71 | 137.31 | 209.20 | 44.10 |
| 2. | 3 | 108.65 | 59.52 | 81.80 | 249.30 | 49.12 |
| 3. | 3 | 127.46 | 98.62 | 116.22 | 248.41 | 28.84 |
| 4. | 3 | 150.77 | 94.83 | 116.99 | 380.92 | 55.93 |
References
- Assessment of global incidence and mortality of hospital-treated sepsis. Current estimates and limitations. Am J Respir Crit Care Med. 2016;193:259-72.
- [CrossRef] [PubMed] [Google Scholar]
- Steroids for sepsis: Yes, no or maybe. J Thorac Dis. 2018;10:S1070-3.
- [CrossRef] [PubMed] [Google Scholar]
- Sepsis: Mechanisms of bacterial injury to the patient. Scand J Trauma Resusc Emerg Med. 2019;27:19.
- [CrossRef] [PubMed] [Google Scholar]
- Blood vessels of the rat tail: A histological re-examination with respect to blood vessel puncture methods. Lab Anim. 2003;37:121-5.
- [CrossRef] [PubMed] [Google Scholar]
- Sepsis and septic shock: A history. Crit Care Clin. 2009;25:83-101, 8
- [CrossRef] [PubMed] [Google Scholar]
- Sepsis and septic shock a review of laboratory models and a proposal. J Surg Res. 1980;29:189-201.
- [CrossRef] [Google Scholar]
- Current murine models of sepsis. Surg Infect (Larchmt). 2016;17:385-93.
- [CrossRef] [PubMed] [Google Scholar]
- Humanized mouse models of infectious diseases. Drug Discov Today. 2012;9:e11-6.
- [CrossRef] [Google Scholar]
- Experimental models of sepsis and septic shock: An overview. Acta Cir Bras. 2004;19:82-8.
- [CrossRef] [Google Scholar]
- Fatal transfusion reactions from massive bacterial contamination of blood. N Engl J Med. 1951;245:760-5.
- [CrossRef] [PubMed] [Google Scholar]
- Overwhelming bacteremic shock produced by gram-negative bacilli; a report of four cases with one recovery. Med Bull (Ann Arbor). 1953;19:23-42.
- [Google Scholar]
- Hypotension (shock) in dogs produced by Escherichia coli endotoxin. Circ Res. 1956;4:546-56.
- [CrossRef] [PubMed] [Google Scholar]
- Laboratory models of sepsis and septic shock. J Surg Res. 1990;49:186-96.
- [CrossRef] [Google Scholar]
- Animal models of sepsis: Setting the stage. Nat Rev Drug Discov. 2005;4:854-65.
- [CrossRef] [PubMed] [Google Scholar]
- Mechanisms for the high circulatory requirements in sepsis and septic shock. Ann Surg. 1969;170:677-95.
- [CrossRef] [PubMed] [Google Scholar]
- Surface infection with Pseudomonas aeruginosa. Ann Surg. 1964;160:297-305.
- [CrossRef] [PubMed] [Google Scholar]
- PEG-BP-30 monotherapy attenuates the cytokine-mediated inflammatory cascade in baboon Escherichia coli septic shock. J Surg Res. 1995;59:153-8.
- [CrossRef] [PubMed] [Google Scholar]
- Staging of the pathophysiologic responses of the primate microvasculature to Escherichia coli and endotoxin: Examination of the elements of the compensated response and their links to the corresponding uncompensated lethal variants. Crit Care Med. 2001;29:S78-89.
- [CrossRef] [PubMed] [Google Scholar]
- Effect of recombinant human granulocyte colony-stimulating factor on hemodynamic and cytokine response in a porcine model of Pseudomonas sepsis. Shock. 1995;4:216-24.
- [CrossRef] [PubMed] [Google Scholar]
- Vital organ blood flow during hyperdynamic sepsis. Chest. 2003;124:1053-9.
- [CrossRef] [PubMed] [Google Scholar]
- Effects of volume resuscitation on splanchnic perfusion in canine model of severe sepsis induced by live Escherichia coli infusion. Crit Care. 2004;8:R221-8.
- [CrossRef] [PubMed] [Google Scholar]
- Vascular decoupling in septic shock: The combined role of autonomic nervous system, arterial stiffness, and peripheral vascular tone. Front Physiol. 2020;11:594.
- [CrossRef] [PubMed] [Google Scholar]
- A mathematical model of dP/dt max for the evaluation of the dynamic control of heart contractility in septic shock. IEEE Trans Biomed Eng. 2019;66:2719-27.
- [CrossRef] [PubMed] [Google Scholar]


