
Translate this page into:
Comparison of cardiac autonomic functions in elite endurance athletes and non-athletic healthy population: A cross-sectional study

*Corresponding author: Rupak Kumar Singh, Department of Physiology, Armed Forces Medical College, Pune, Maharashtra, India. rupaksingh83@gmail.com
-
Received: ,
Accepted: ,
How to cite this article: Jaipurkar R, Singh RK, Manral R, Apte VV, Sharma A. Comparison of cardiac autonomic functions in elite endurance athletes and non-athletic healthy population: A cross-sectional study. Indian J Physiol Pharmacol 2023;67:218-25.
Abstract
Objectives:
Long-term endurance training in elite endurance athletes (EEA) is known to affect the autonomic function by increasing the vagal tone which reflects in resting heart rate variability (HRV) but does this high resting vagal tone also affects the post-exercise heart rate recovery (HRR) remains unknown. Post-exercise HRR is used to prescribe and monitor athletic training. Hence, the aim was to determine HRR after maximal exercise among EEA and non-athletics healthy (NAH) populations and correlate it with resting HRV.
Materials and Methods:
Fifteen EEA and 15 NAH active male subjects of >18 years participated in this study. The resting HRV was measured with a continuous lead II electrocardiogram in the supine position for 10 min. The incremental exercise testing was done and post-exercise HRR data were collected.
Results:
In time domain analysis, average RR, median RR, root mean square of sequential deviations and percentage of successive interval difference larger than 50 ms were significantly higher, whereas the average heart rate was significantly lower in the EEA group. In the frequency domain analysis, low-frequency power–normalised units (LFnu), and low frequency (LF)/high frequency (HF) was significantly lower while high-frequency power––normalised units were significantly higher in the EEA group. The resting HRV indices did not correlate to HRR in both groups.
Conclusion:
The athletes have better adapted cardiac autonomic function as compared to the NAH group with higher resting vagal tone and better HRR. HRR did not correlate with resting HRV in either group, suggesting that parasympathetic activity causing a rapid decrease in heart rate post-exercise is independent of basal parasympathetic tone.
Keywords
Autonomic nervous system
Endurance training
Exercise
Heart rate recovery
Heart rate variability

INTRODUCTION
The human body meets the excess demands of nutrients and gases during exercise with necessary cardiorespiratory and metabolic adjustments. The short duration of exercise leads to functional changes while long-term exercise leads to physiological and anatomical adaptations in the cardiovascular system.[1] These adjustments occur in all aspects of the cardiovascular system including neural regulation.
Autonomic regulation of the heart and vasculature is required for rapid changes in heart and blood pressure to meet the demands of the body. The sympathetic and parasympathetic are the two arms of the autonomic nervous system (ANS) which accelerates and decelerates the cardiovascular system, respectively. Heart rate variability (HRV) is the variation in inter-beat intervals of consecutive heartbeats;[2] and heart rate is associated with heart size.[3] HRV is the surrogate marker used for measuring cardiac autonomic activity. The endurance training causes physiological bradycardia and left ventricular hypertrophy.[4]
The review of the literature shows that endurance training decreases resting and submaximal heart rate, while maximum heart rate may decrease slightly or remain unchanged after training.[5] Endurance training increases parasympathetic activity and decreases the sympathetic activity of the heart at rest. The two training-induced effects on the ANS reduce resting heart rate (RHR).[6] Exercise is associated with an increase in heart rate due to parasympathetic withdrawal and an increase in sympathetic activity and while post-exercise cardiovascular deceleration is associated with parasympathetic activation.[7] Some studies have shown that post-exercise heart rate recovery (HRR) is a valid indicator of parasympathetic responsiveness and sympathovagal balance. It can also be used to prescribe and monitor athletic training.[8,9] Even though HRV and cardio deceleration post-exercise are believed to be parasympathetic in origin, resting HRV in elite endurance athletes (EEA) is required to be compared with non-athletic healthy (NAH) population to ascertain the effect of autonomic adaptations to endurance training. This study aimed to determine HRR after maximal exercise among EEA and non-athletes and correlate it with resting HRV parameters.
MATERIALS AND METHODS
Study design and participants
It was a cross-sectional observational study from October 2021 to March 2022. The sample size was based on convenience sampling due to the limited availability of elite athletes. Only male athletes participated in the study because the premier national-level sports institute recruits athletes only from the armed forces. Fifteen elite endurance male athletes and 15 healthy non-athletic active male subjects of more than 18 years (participation age according to the Athletics Federation of India) participated in the study. Elite athletes have either competed at the International/National level and/or have a minimum training age of 5 years. They have followed a weekly training program of alternate long runs and recovery runs and have been trained >10 h/week under supervision of the competent coaches. All EEA were long-distance runners and were completing weekly mileage over 100 km. All NAH populations were selected from the local community and performed up to 150 min/week of moderate to vigorous physical activities. The subjects had a light meal 2 h before the tests. Written informed consent was taken from all the participants. Data were collected at a National level Sports Institute after approval from the Institutional Ethics Committee according to the terms of the Declaration of Helsinki. Physical examination and medical history excluded the presence of autonomic dysfunction and acute/chronic illness.
Procedures
The study was conducted at the high-performance laboratory, participants were advised to avoid food and drinks containing alcohol, tobacco or caffeine 24 h before the test. An international physical activity questionnaire (IPAQ) was filled in. Based on the activity level inferred from the questionnaire, all EEA were classified as high activity level category (Category 3) with an average minimum total physical activity of at least 3000 MET-min/week.[10] All NAH populations, included in the study as a control group, were classified as sufficiently active (Category 2) with an average of 1200 MET-min/week according to IPAQ. The exercise protocol and procedures along with possible associated risks were explained. Resting physiological parameters were recorded. The height and weight of all the participants were recorded using the Seca Stadiometer.
Assessment of HRV
Resting HRV was measured in a supine position between 0630 h and 0830 h in the laboratory with a temperature (23–27°C). The room was kept quiet, and lighting was kept dim and participants were instructed to rest 10 min before starting the test. The electrocardiogram (ECG) recordings were taken with the lead II. Minimal body movement and conversation for 10 min in a supine position were ensured to reduce the mechanical artefacts in the ECG recording by LabChart Pro software. Continuous ECG was recorded for 10 min, amplified by the Adinstruments ML870 Powerlab 8/30 system and HRV was analysed at 1000 samples/sec by LabChart software and included time domain and frequency domain analysis. Time domain HRV analysis identifies the standard deviation of RR intervals (SDRR), root mean square of sequential deviations (RMSSD) and percentage of successive interval difference larger than 50 ms (pRR50). Frequency domain HRV parameters included in this study were low-frequency power––normalised units (LFnu), high-frequency power––normalised units (HFnu) and lowfrequency/high-frequency ratio (LF/HF).
Exercise testing
The participants comprehensively demonstrated the testing procedure for familiarisation with the cycle ergometer. After taking resting parameters, participants were instructed to sit on cycle Ergometer Monark Ergomedic 839E and seat height was adjusted according to the height of the participants. The Incremental protocol was explained to the participants. Exercise testing was started with a 2 min warm-up without any load and participants were advised to maintain cadence at 60 rpm. The warm-up period was followed by an exercise period. During this phase, participants cycled against a resistance of 50 watts for 2 min at the same cadence. It was followed by increased resistance of 25 watts every 2 min until the participants had volitional fatigue or any other complaints. The recovery period consisted of active recovery of 5 min and they continued to cycle with 25 watts load while maintaining the cadence of 60 rpm. All the exercise and post-exercise parameters were measured using breath by breath by the metabolic analyser (K5, COSMED, Rome, Italy) and the HR monitor using a chest strap (HRM dual, Garmin, Olathe, KS, USA) equipped with Bluetooth connectivity.
HRR
The HRR was calculated by subtracting the heart rates at 1, 2, 3 and 5 min (HRR1, HRR2, HRR3 and HRR5) from the peak heart rate (HRpeak) during the recovery phase.[11] %HRR was also calculated for 1, 2, 3 and 5 min as HRR/HRmax × 100.
Statistical analysis
All anthropometry, HRV and exercise parameters values were expressed as mean ± standard deviation. Normality was checked with Kolmogorov–Smirnov test. Intergroup variations were analysed using an independent sample t-test for normal distribution of parameters and one sample Kolmogorov–Smirnov test and Mann–Whitney U-test for non-parametric distribution of variables and P < 0.05 was considered significant. Spearman’s correlation coefficient was used to find the correlations between exercise parameters, HRV parameters and HRR parameters. SPSS version 20.0 Armonk, NY: IBM Corp. was used for data analysis.
RESULTS
The basal characteristics of the participants from the EEA and NAH groups are summarised in [Table 1 and Figure 1]. RHR, systolic blood pressure and HRpeak were significantly lower (P < 0.05), while VO2 max was significantly higher in the EEA group as compared to NAH group. Age, height, weight and diastolic blood pressure did not differ significantly.
| EEA group (n=15) | NAH group (n=15) | P-value | |
|---|---|---|---|
| Age (years) | 25.2±6.92 | 22±1.26 | 0.079 |
| Height (cm) | 175.29±5.26 | 174.97±5.22 | 0.86 |
| Weight (kg) | 62.71±6.13 | 66.63±9.43 | 0.195 |
| RHR (bpm) | 50.67±8.41 | 70.19±6.29 | <0.001* |
| SBP (mmHg) | 113.4±6.89 | 127.19±9.02 | <0.001* |
| DBP (mmHg) | 68.53±6.03 | 71.56±6.32 | 0.184 |
| VO2max (mL/kg/min) | 49.09±5.9 | 40.55±5.41 | <0.001* |
| HRpeak(bpm) | 178.73±11.63 | 190.06±17.5 | 0.04* |
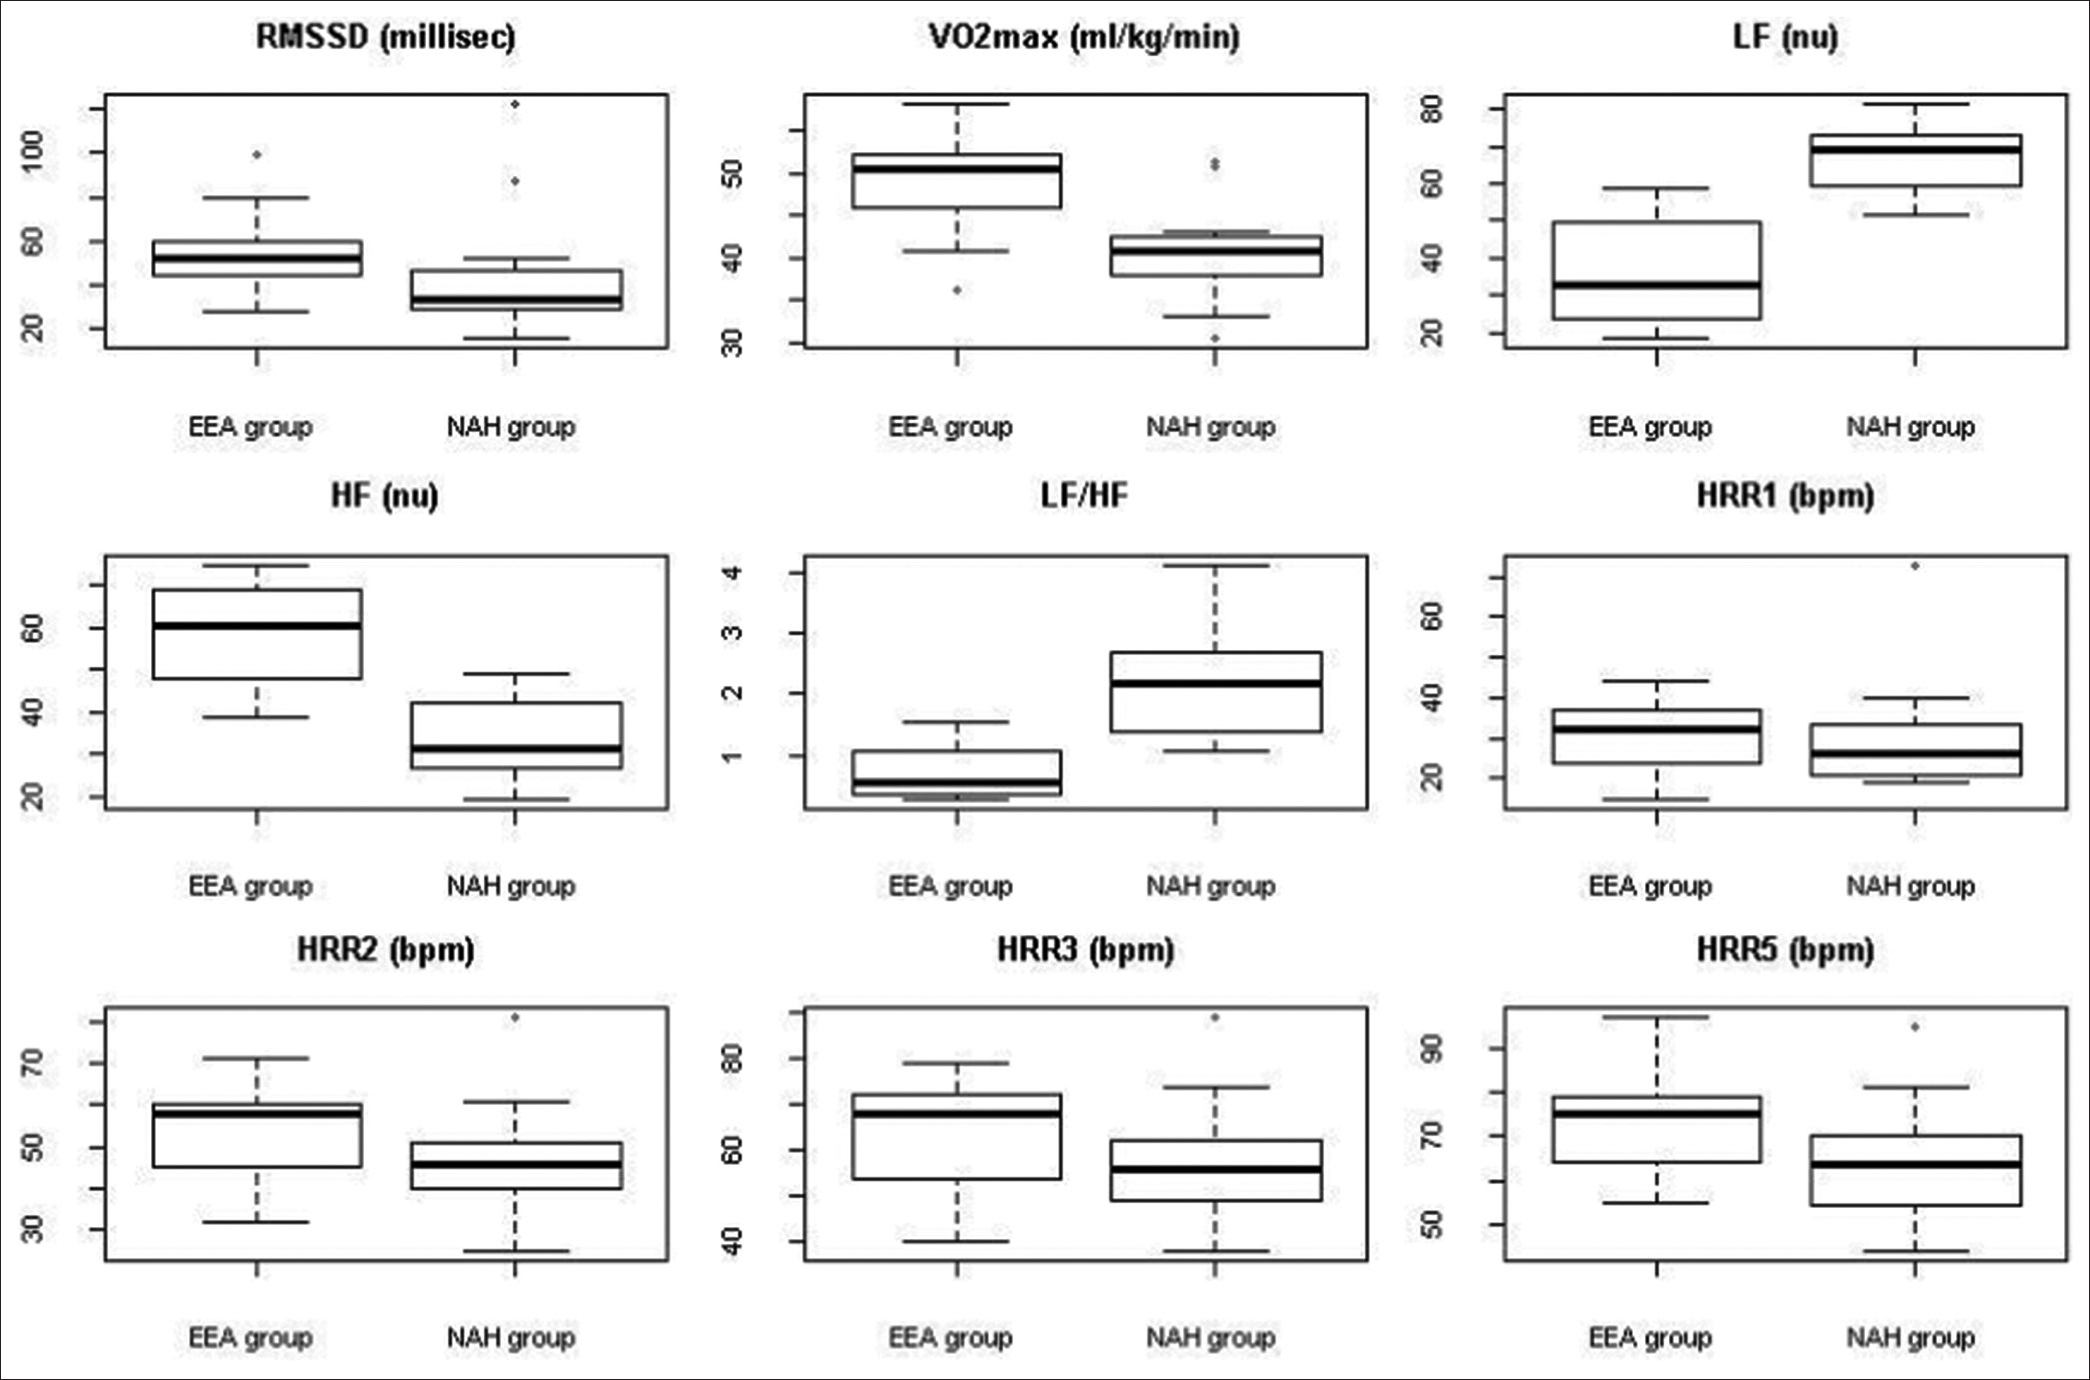
- Box and whisker plots of heart rate variability parameters, VO2 max and heart rate recovery in elite endurance athletes and non-athletics healthy groups. RMSSD: Root mean square of sequential deviations, VO2 max: Calculated maximum consumption, LF(nu): Low-frequency power-normalized units, HF(nu): High-frequency power-normalized units, LF/HF: Low-frequency/High-frequency ratio, HRR: Heart rate recovery, EEA group: Elite endurance athlete group, NAH group: Non-athletic healthy group.
The HRV characteristics are represented in [Table 2 and Figure 1]. In time domain analysis, average RR interval, median RR interval, RMSSD and pRR50 were significantly higher (P < 0.05), whereas the average rate (bpm) was significantly lower (P < 0.05) in the EEA group when compared to the NAH group. SDRR was similar for both groups. In the frequency-domain analysis, LF nu and LF/HF were significantly lower (P < 0.05), while HF nu was significantly higher (P < 0.05) in the EEA group as compared to the NAH group. Total power did not significantly differ in both groups.
| EEA group (n=15) | NAH group (n=15) | P-value | |
|---|---|---|---|
| Time domain | |||
| Average RR (s) | 1.197±0.261 | 0.871±0.104 | <0.001* |
| Median RR (s) | 1.202±0.262 | 0.877±0.113 | <0.001* |
| SDRR (ms) | 51.47±29.45 | 55.35±28.44 | 0.874 |
| Average rate (bpm) | 52.56±16.02 | 69.05±7.98 | <0.001* |
| RMSSD (ms) | 51.88±18.92 | 32.42±19.75 | 0.016* |
| pRR50 (%) | 40.11±35.32 | 11.21±19.99 | 0.014* |
| Frequency domain | |||
| LF nu | 32.82±26.07 | 68.58±14.34 | <0.001* |
| HF nu | 60.47±23.22 | 32.91±17.53 | <0.001* |
| LF/HF | 0.5623±0.7572 | 2.084±1.421 | <0.001* |
| Total power (ms2) | 3216±2712 | 2568±3669 | 0.917 |
The HRR parameters are shown in [Table 3 and Figure 1]. Percentage HRR2, HRR3 and HRR5 were significantly higher (P < 0.05) in the EEA group than in the NAH group. In [Figure 2], EEA showed faster HRR as compared to NAH.
| EEA group (n=15) | NAH group (n=16) | P-value | |
|---|---|---|---|
| HRR1 (bpm) | 30.33±8.5 | 30.13±13.2 | 0.95 |
| HRR2 (bpm) | 53.2±10.78 | 47.06±12.16 | 0.14 |
| HRR3 (bpm) | 63.4±11.93 | 56.5±12.78 | 0.13 |
| HRR5 (bpm) | 72.93±11.44 | 63.38±13.33 | 0.04* |
| %HRR1 | 16.93±4.47 | 15.9±6.64 | 0.61 |
| %HRR2 | 29.69±5.32 | 24.66±5.46 | 0.015* |
| %HRR3 | 35.4±5.89 | 29.6±5.43 | 0.008* |
| %HRR5 | 40.8±5.96 | 33.17±5.32 | 0.008* |
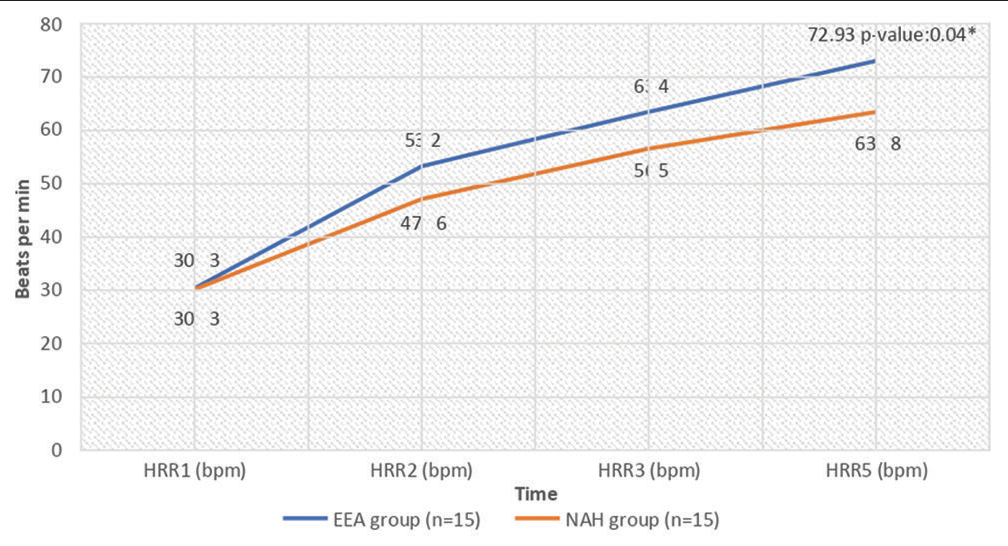
- Comparison of recovery heart rate in the elite endurance athletes and non-athletics healthy groups. EEA: Elite endurance athlete, NAH: Non-athletic healthy, HRR: Heart rate recovery, *Statistically significant value.
[Table 4] represents the relationship between HRV, VO2 max and HRR parameters. The VO2 max had a positive correlation with all the HRV and HRR parameters except LF/HF ratio. The correlation between LF and HRR parameters was significant. VO2 was negatively correlated with LF/HF ratio. LF/HF ratio has a significant positive relationship with LF, while a significant negative correlation with RMSSD and HF. LF/HF ratio had a weak negative correlation with HRR parameters which were not statistically significant. RMSSD had a significant correlation with HRV parameters while there was no relationship found with HRR parameters. When compared with other studies, we were unable to find a correlation between HRV and HRR parameters.
| LF nu | RMSSD ms | HFnu | LFHF | VO2 | HRR1 | HRR2 | HRR3 | HRR5 | |
|---|---|---|---|---|---|---|---|---|---|
| LF nu | 1 | −0.629** | −0.972** | 0.99** | −0.384* | −0.11 | −0.246 | −0.242 | −0.243 |
| RMSSD ms | −0.629** | 1 | 0.632** | −0.623** | 0.22 | 0.053 | 0.098 | 0.086 | 0.1 |
| HFnu | −0.972** | 0.632** | 1 | −0.986** | 0.33 | 0.086 | 0.173 | 0.158 | 0.145 |
| LF/HF | −0.99** | −0.623** | −0.986** | 1 | −0.353 | −0.102 | −0.221 | −0.209 | −0.195 |
| VO2max | −0.384* | 0.22 | 0.33 | −0.353 | 1 | 0.465** | 0.621** | 0.636** | 0.631** |
| HRR1 | −0.11 | 0.053 | 0.086 | −0.102 | 0.465** | 1 | 0.756** | 0.755** | 0.659** |
| HRR2 | −0.246 | 0.098 | 0.173 | −0.221 | 0.621** | 0.756** | 1 | 0.93** | 0.86** |
| HRR3 | −0.242 | 0.086 | 0.158 | −0.209 | 0.636** | 0.755** | 0.93** | 1 | 0.947** |
| HRR5 | −0.243 | 0.1 | 0.145 | −0.195 | 0.631** | 0.659** | 0.86** | 0.947** | 1 |
Spearman’s Correlation Coefficient values. **Correlation is significant at 0.01 level of significance. VO2 max: Calculated maximum oxygen consumption, RHR: Resting heart rate, SBP: Systolic blood pressure, DBP: Diastolic blood pressure. RMSSD: Root mean square of sequential deviations, LFnu: Low-frequency power––normalised units, HFnu: High-frequency power––normalised units, LF/HF: Low-frequency/high-frequency ratio, HRR: Heart rate recovery, HRV: Heart rate variability
[Table 5] represents group-wise correlation tables for HRV parameters and HRR. The HRR 1–3 was negatively weakly correlated to LF nu in the EEA group while they were positively correlated in the NAH group. HRR 1–3 positively correlated to HF nu in the EEA group and negatively correlated to the NAH group. HRR5 in EEA showed a negative correlation with RMSSD while the NAH group showed a positive correlation. LF nu correlation increased from negative to positive in HRR1 to HRR5 in the EEA group while it was positive in the NAH group.
| HRR1 | HRR2 | HRR3 | HRR5 | |||||
|---|---|---|---|---|---|---|---|---|
| EEA | NAH | EEA | NAH | EEA | NAH | EEA | NAH | |
| RMSSD ms | 0.286 | −0.339 | 0.184 | −0.159 | −0.038 | 0.015 | −0.168 | 0.069 |
| LFnu | −0.263 | 0.363 | −0.286 | 0.432 | −0.192 | 0.242 | 0.011 | 0.256 |
| HFnu | 0.136 | −0.337 | 0.125 | −0.495 | 0.004 | −0.323 | −0.177 | −0.34 |
| LFHF | −0.216 | 0.366 | −0.285 | 0.454 | −0.195 | 0.294 | 0.004 | 0.299 |
| VO2max | 0.394 | 0.222 | 0.516* | 0.373 | 0.432 | 0.383 | 0.272 | 0.438 |
| HRR1 | 1 | 1 | 0.81** | 0.55* | 0.775** | 0.544* | 0.689** | 0.492 |
| HRR2 | 0.81** | 0.55* | 1 | 1 | 0.899** | 0.859** | 0.675** | 0.865** |
| HRR3 | 0.775* | 0.544* | 0.899** | 0.859** | 1 | 1 | 0.855** | 0.959** |
| HRR5 | 0.689** | 0.492 | 0.675** | 0.865* | 0.855* | 0.959* | 1 | 1 |
Spearman’s Correlation Coefficient values. **Correlation is significant at 0.01 level of significance. EEA: Elite endurance athlete, NAH: Non-athletic healthy VO2 max: Calculated maximum oxygen consumption, RHR: Resting heart rate, SBP: Systolic blood pressure, DBP: Diastolic blood pressure. RMSSD: Root mean square of sequential deviations, LFnu: Low-frequency power––normalised units, HFnu: High-frequency power––normalised units, LF/HF: Low-frequency/high-frequency ratio, HRR: Heart rate recovery, HRV: Heart rate variability
DISCUSSION
In this study, we have observed that athletes’ average RHR was significantly lower than controls’, 52 ± 16 bpm versus 69 ± 8 bpm. The resting RMSSD and the pRR50(%) were both significantly higher in athletes than in controls: 51.9 (18.9) versus 32.4 (19.7) ms and 40.1 (35.3) versus 11.2 (20)%, respectively. A Stanley et al. study described how HRV indices and training load were used to monitor adaptation to training of an elite male triathlete, and that the decrease in RHR, along with the increase in RMSSD, was consistently indicative of positive adaptation.[12]
In athletes, the resting HF vagal component was significantly higher than that of controls, at 60.4 (23.2) versus 32.9 (17.5) nu. Athletes had significantly lower resting LF peak power, 32.8 (26) versus 68.5 (14.3) in controls. Hence, the LF/HF ratio was significantly lower in athletes at 0.5 versus 2 in controls. Similar findings were found in a study by Dixon et al.[13] These results suggest that endurance training leads to positive modifications in autonomic control of the heart and high resting parasympathetic activity.
The total power of the spectrum represents the general level of autonomic activation, low-frequency activity (<0.15 Hz) is mainly due to baroreceptor reflex modulation and related to both vagal and sympathetic influence, and high-frequency activity is mainly indicated with vagal activity. A low- to high-frequency ratio is accepted to indicate sympathovagal balance.
The VO2 max is the athlete’s maximum capacity to utilise oxygen in a graded exercise test which indicates his/her exercise capacity. In our study, the VO2 max of athletes was significantly high as compared to controls at 49 (5.9) versus 40.5 (5.4) mL/kg/min. This finding implies that regular long-term training has increased VO2 max in athletes. VO2 max correlated positively with all HRV and HRR parameters except LF and LF/HF ratio. The VO2 max was negatively correlated with LF and LF/HF ratio. Studies have been done to show that cardiorespiratory fitness can be improved effectively using HRV for daily training prescriptions.[14,15] Studies have shown that daily exercise prescriptions can be formulated based on HRV which could help to increase cardiorespiratory fitness.[14]
A study by Jabbour and Iancu. showed that after 6 weeks of submaximal exercise testing (SET) in obese and normal weight control groups, there was a significant improvement in HRV indicators associated with VO2 max improvement. After SET, the frequency domain marker improved significantly for both groups in comparison to the baseline.[16]
Our study showed that the EEA group showed faster HRR than the NAH group. The rate of decrease in heart rate and length of time of recovery after moderate to severe exercise is commonly used as cardiovascular fitness.[17]
The HRR results of our study showed that the percentages HRR2, HRR3 and HRR5 were significantly higher (P < 0.05) in the EEA group than in the NAH group. A study by Lazic et al. showed that higher values of HRR1 should be expected in older athletes, and HRR3 could be used as an index of aerobic capacity, irrespective of age.[18] HRR after exercise is a valid measure of sympathovagal balance. Many studies have shown that HRR immediately after exercise is accelerated in endurance-trained athletes.[19,20] Parasympathetic activation is the main mechanism underlying rapid cardio deceleration after exercise.[21]
In both the EEA and NAH groups, we did not find a significant correlation between HRR and resting HRV. This suggests that parasympathetic activity which results in a rapid drop-in heart rate after exercise is independent of basal parasympathetic tone. The post-exercise exponential decrease in heart rate is an intrinsic property of circulation independent of autonomic functions.[22]
In a study by Javorka et al., heart rate decline post-exercise did not correlate with resting HRV indices but positively correlated with recovery HRV indices.[7] HRR1 in the EEA group showed a negative correlation with LFnu and LF/HF ratio while the NAH group showed a positive correlation while HRR5 in the EEA group showed a negative correlation with RMSSD while the NAH group showed a positive correlation. LF nu correlation increased from negative to positive in HRR1–HRR5 in the EEA group while it was positive in NAH. However, a significant correlation was absent.
The HRR is divided into two phases: the fast phase and the slow phase, fast phase is the first 60 s due to vagal reactivation and the slow phase is after 60 s until the heart rate reaches its resting value due to vagal reactivation and sympathetic withdrawal.[23,24] The time course for parasympathetic reactivation post-exercise has been studied earlier, the exact timing of these changes can be impacted by an individual’s health and training status and, hence, can show interindividual variation.[25] The exercise modality also appears to influence post-exercise parasympathetic reactivation and sympathetic withdrawal in an intensity-dependent manner.[26]
RMSSD is the natural-logarithm of the root mean square of successive differences, reflects beat-to-beat HR variation and is the primary time domain measure for estimating vagally mediated changes in HRV.[2] The HF range is from 0.15 Hz to 0.4 Hz, which corresponds to rhythms whose periods fall between 2.5 s and 7 s. This band reflects parasympathetic or vagal activity. The LF range is between 0.04 Hz and 0.15 Hz, which corresponds to rhythms or modulations with periods that occur between 7 s and 25 s. It primarily reflects baroreceptor activity at rest. The RMSSD is correlated with HF power.[27] The increase in HRV and decrease in resting HR indicate that the athlete is coping well with training while the decrease in HRV and increase in resting HR are an indicator of accumulated fatigue in athletes. Increases in resting vagal-related indices and faster post-exercise HRR are evident when positive adaptation to training has occurred which is allowing for performance increases.[28]
Experimental challenges and limitations
Breathing rate was not controlled for when assessing HRV and may have influenced HRV. An important issue in HRV analysis is the non-stationarity of the heart rate signal, which is especially problematic during exercise.[29] One of the limitations of our study is that the recovery HRV could not be compared with HRR. Our study showed that athletes have better sympathovagal balance and have better adapted cardiac autonomic function. HRR did not correlate with resting HRV in either group, suggesting that parasympathetic activity causing a rapid decrease in heart rate post-exercise is independent of basal parasympathetic tone. This study was an attempt to use HRV as a part of exercise testing to determine cardiac autonomic modifications in endurance athletes.
CONCLUSION
Our study showed that resting time-domain HRV parameters were significantly higher in athletes than in controls. Resting HF value which is an indicator of vagal functions was significantly higher and LF and LF/HF ratio was significantly lower in athletes. These findings indicate that athletes have better sympathovagal balance and have better adapted cardiac autonomic function. HRR did not correlate with resting HRV in either group, suggesting that parasympathetic activity causing a rapid decrease in heart rate post-exercise is independent of basal parasympathetic tone.
Future scope of the study
A larger sample size study can be planned to ascertain the findings of the present study. Direct parameters of a sympathetic system like muscle nerve sympathetic activity (MSNA) can be included in future studies.
Acknowledgements
The authors acknowledge Colonel Devraj Gill, Commandant and Staffs of High-Performance Lab of Army Sports Institute, Pune, India, for their support during the conduct of the study.
Declaration of patient consent
The authors certify that they have obtained all appropriate patient consent.
Conflicts of interest
There are no conflicts of interest.
Financial support and sponsorship
Nil.
References
- Exercise and the cardiovascular system. Cardiol Res Pract. 2012;2012:210852.
- [CrossRef] [PubMed] [Google Scholar]
- An overview of heart rate variability metrics and norms. Front Public Health. 2017;5:258.
- [CrossRef] [PubMed] [Google Scholar]
- The association between endurance training and heart rate variability: The confounding role of heart rate. Front Physiol. 2018;9:756.
- [CrossRef] [PubMed] [Google Scholar]
- Autonomic control of heart rate during and after exercise: Measurements and implications for monitoring training status. Sports Med. 2008;38:633-46.
- [CrossRef] [PubMed] [Google Scholar]
- Effect of endurance exercise on autonomic control of heart rate. Sports Med. 2003;33:33-46.
- [CrossRef] [PubMed] [Google Scholar]
- Heart rate recovery after exercise: Relations to heart rate variability and complexity. Braz J Med Biol Res. 2002;35:991-1000.
- [CrossRef] [PubMed] [Google Scholar]
- Post-exercise heart rate recovery and its speed are associated with cardiac autonomic responsiveness following orthostatic stress test in men. Scand Cardiovasc J. 2021;55:220-6.
- [CrossRef] [PubMed] [Google Scholar]
- Heart rate monitoring in team sports-a conceptual framework for contextualizing heart rate measures for training and recovery prescription. Front Physiol. 2018;9:639.
- [CrossRef] [PubMed] [Google Scholar]
- The international physical activity questionnaire (IPAQ): A study of concurrent and construct validity. Public Health Nutr. 2006;9:755-62.
- [CrossRef] [PubMed] [Google Scholar]
- Pathophysiology of exercise heart rate recovery: A comprehensive analysis. Ann Noninvasive Electrocardiol. 2013;18:107-17.
- [CrossRef] [PubMed] [Google Scholar]
- Cardiac parasympathetic activity and race performance: An elite triathlete case study. Int J Sports Physiol Perform. 2015;10:528-34.
- [CrossRef] [PubMed] [Google Scholar]
- Neural regulation of heart rate variability in endurance athletes and sedentary controls. Cardiovasc Res. 1992;26:713-9.
- [CrossRef] [PubMed] [Google Scholar]
- Endurance training guided individually by daily heart rate variability measurements. Eur J Appl Physiol. 2007;101:743-51.
- [CrossRef] [PubMed] [Google Scholar]
- HRV-based training for improving VO2max in endurance athletes. A systematic review with meta-analysis. Int J Environ Res Public Health. 2020;17:7999.
- [CrossRef] [PubMed] [Google Scholar]
- Supramaximal-exercise training improves heart rate variability in association with reduced catecholamine in obese adults. Front Physiol. 2021;12:654695.
- [CrossRef] [PubMed] [Google Scholar]
- Normographic approach for the estimation of heart rate recovery time after exercise. J Appl Physiol. 1971;31:962-4.
- [CrossRef] [PubMed] [Google Scholar]
- Heart rate recovery in elite athletes: The impact of age and exercise capacity. Clin Physiol Funct Imaging. 2017;37:117-23.
- [CrossRef] [PubMed] [Google Scholar]
- Vagally mediated heart rate recovery after exercise is accelerated in athletes but blunted in patients with chronic heart failure. J Am Coll Cardiol. 1994;24:1529-35.
- [CrossRef] [PubMed] [Google Scholar]
- Heart rate variability and recovery following maximal exercise in endurance athletes and physically active individuals. Appl Physiol Nutr Metab. 2020;45:1138-44.
- [CrossRef] [PubMed] [Google Scholar]
- Parasympathetic reactivation after maximal CPET depends on exercise modality and resting vagal activity in healthy men. Springerplus. 2015;4:100.
- [CrossRef] [PubMed] [Google Scholar]
- Endocrinology of Physical Activity and Sport. (2nd ed). Germany: Springer; 2013.
- [CrossRef] [Google Scholar]
- Plasma norepinephrine and heart rate dynamics during recovery from submaximal exercise in man. Eur J Appl Physiol. 1989;58:879-83.
- [CrossRef] [PubMed] [Google Scholar]
- Heart rate recovery fast-to-slow phase transition: Influence of physical fitness and exercise intensity. Ann Noninvasive Electrocardiol. 2018;23:e12521.
- [CrossRef] [PubMed] [Google Scholar]
- Heart rate dynamics during acute recovery from maximal aerobic exercise in young adults. Front Physiol. 2021;12:627320.
- [CrossRef] [PubMed] [Google Scholar]
- Influence of cardiopulmonary exercise testing protocol and resting VO(2) assessment on% HRmax,% HRR,% VO(2max) and% VO2R relationships. Int J Sports Med. 2010;31:319-26.
- [CrossRef] [PubMed] [Google Scholar]
- Heart rate variability: New perspectives on physiological mechanisms, assessment of self-regulatory capacity, and health risk. Glob Adv Health Med. 2015;4:46-61.
- [CrossRef] [PubMed] [Google Scholar]
- Monitoring training status with HR measures: Do all roads lead to Rome? Front Physiol. 2014;5:73.
- [CrossRef] [Google Scholar]
- Heart rate variability and physical exercise. Current status. Herz. 2006;31:544-52.
- [CrossRef] [PubMed] [Google Scholar]


