
Translate this page into:
Age-associated changes in physiological and biochemical arterial stiffness markers in apparently healthy individuals
*Corresponding author: Manisha Kar, Department of Physiology, AIIMS Bhubaneswar, Sijua, Patrapada, Bhubaneswar - 751 019, Odisha, India. physio_manisha@aiimsbhubaneswar.edu.in
-
Received: ,
Accepted: ,
How to cite this article: Kar M, Panigrahi M, Mahapatra SC. Age-associated changes in physiological and biochemical arterial stiffness markers in apparently healthy individuals. Indian J Physiol Pharmacol 2020:64(2):129-36.
Abstract
Objectives:
Arterial stiffness occurs with increasing age and it is an independent cardiovascular risk factor. Brachial ankle pulse wave velocity (baPWV) and serum osteoprotegerin (OPG) are relatively new physiological and biochemical parameters to ascertain arterial stiffness. We determined age-associated changes in physiological and biochemical parameters of arterial stiffness.
Materials and Methods:
It was a cross-sectional, observational study conducted on apparently healthy 118 male and 114 female subjects of age group 30–>60 years without any cardiovascular or peripheral vascular disease or on any antihypertensive and lipid-lowering therapy. Brachial systolic blood pressure (bSBP), brachial diastolic blood pressure, central systolic blood pressure (cSBP), central diastolic blood pressure (cDBP), heart rate, augmentation index (AIx[%]) and baPWV were recorded after 10 min of rest. Mean arterial pressure (MAP), pulse pressure (PP) and PP ratio (PPR) were derived from the recorded data. Serum samples were analysed to estimate OPG level and lipid profile. Kruskal–Wallis test was performed to compare the differences of the parameters. Spearman correlation analysis was performed to determine any association between baPWV and other parameters. Multiple linear regression analysis was performed to determine the factors associated with baPWV. P < 0.05 was considered as statistically significant.
Results:
Males had significantly higher value of height, weight and PPR than females. Females had significantly higher values of BMI, AIx (%), cSBP, cPP and brachial PP than males. Aged males had significantly higher AIx (%), cPP and brachial PP in comparison to younger males. Aged females showed significantly higher AIx (%), cPP, brachial PP, serum cholesterol, triglyceride (TG), low-density lipoprotein cholesterol (LDLc) and very LDLc (VLDLc) in comparison to younger females. Serum OPG level was found to be a major factor influencing the values of baPWV in both males and females. Other cardiovascular parameters such as cSBP, cDBP, cMAP, brachial SBP and MAP influenced baPWV values in both genders, but biochemical parameters such as serum cholesterol, LDLc influenced baPWV values in the male participants in the present study. Regression analysis revealed that serum TG and OPG levels were strongly associated with baPWV in both genders.
Conclusion:
With increasing age, cardiovascular parameters such as central blood pressure, peripheral blood pressure and AIx (%) were increased in both genders, and PPR was decreased in males. The values of baPWV also exhibited an increasing trend with age. Serum cholesterol, TG, LDLc and VLDLc levels in females were increased with age. Serum OPG level and serum TG levels emerged as major influencing factors of baPWV values in both genders irrespective of age.
Keywords
Arterial stiffness
Brachial-ankle pulse wave velocity
Serum osteoprotegerin

INTRODUCTION
Ageing of the arterial system is accompanied by structural changes, including fragmentation and degeneration of elastin, increase in collagen, thickening of the arterial wall and progressive dilatation of arteries.[1] These changes result in a gradual stiffening of the vasculature and an increase in the velocity of the pressure wave as it travels down the aorta. In a normal elastic aorta, the pressure wave reflects from the periphery and returns to the heart during diastole. This reflected wave helps augment pressure during diastole when coronary blood flow occurs. As the aorta stiffens, the velocity of the pressure wave increases and the reflected pressure wave eventually reaches the heart earlier i.e., at systole. It causes augmentation of systolic blood pressure (SBP) and increased cardiac afterload. The stiffening of the aorta, combined with the absence of diastolic augmentation from the reflected pressure wave, has the potential to reduce coronary filling.[2] Arterial stiffening is associated with a widened pulse pressure (PP) that eventually progresses to isolated systolic hypertension, a condition affecting 30% of adults by the time they reach 80 years of age.[3] Vascular calcification, which leads to arterial stiffening, is an active process that resembles bone formation and is controlled by complex enzymatic and cellular pathways.[4] It resembles more of orthotopic or skeletal bone formation. In this process, endochondral or intramembranous ossification occurs before mineralisation. Intramembranous ossification results from osteoblast-induced calcification of collagen extracellular matrix in the absence of collagen template. The pathophysiological mechanisms fall into two categories: Induction of osteogenesis and loss of inhibitors of mineralisation.[5] Induction of osteogenesis is brought about by osteoblast-type cells. The inducers of the osteochondrogenic phenotype are bone morphogenetic protein, phosphate, parathormone, Vitamin D, glucocorticoids and to name a few. The other predominant mechanism by which vascular calcification occurs is through a loss of physiological inhibitors of vascular calcification or their inadequate quantity in the milieu. These inhibitors are necessary to prevent soft-tissue calcification under basal conditions. Inorganic pyrophosphate, osteopontin, osteoprotegerin (OPG) and Fetuin and Smad 6 are such inhibitors of vascular calcification.[5]
OPG is a soluble glycoprotein belonging to tumour necrosis factors-α (TNFα) superfamily and is related to vascular atherosclerosis and calcification. It is expressed by vascular smooth muscle cells, endothelial cells and megakaryocytes. It inhibits activation of specific pro-inflammatory and pro- apoptotic pathways by neutralizing receptor activator of nuclear factor-kappa B ligand (RANKL) and TNF-related apoptosis-inducing ligand.[6] On the contrary, there are few reports which have shown that pro-inflammatory cytokines also upregulate the expression of OPG in vascular smooth muscle cells and endothelial cells.[7] Endothelial dysfunction is a critical element in the pathogenesis of atherosclerosis and is associated with increased levels of von Willebrand factor (VWF), which is an endothelial cell-derived molecule.[8] OPG is stored and secreted from endothelial cells in complex with VWF in human plasma. Several in vitro studies documented that OPG and RANKL could be essential modulators in atherosclerosis.[9] A positive association between serum OPG and atherosclerosis disease was also reported.[10] Moreover, several prospective studies reported that serum OPG and RANK levels might predict cardiovascular disease and mortality.[11] However, more evidence is required to evaluate the predictive and diagnostic value of serum OPG levels for clinical use as well as its pathologic importance.
Arterial stiffness is a major contributor to cardiovascular disease and is becoming a focal point in the efforts of early detection and prevention of cardiovascular disease. A number of physiological indices such as central blood pressure and augmentation index (AIx (%)) have been introduced to determine arterial stiffness. Among these, pulse wave velocity (PWV) is most frequently applied to clinical medicine because it can be measured easily and noninvasively.[11] Carotid-femoral PWV (cfPWV) serves as a reference standard technique to quantify arterial stiffness. It is accurate and reproducible. However, the method requires technical precision to locate carotid and femoral pulses. To implement the measurement of arterial stiffness in daily clinical practice, an accurate, reproducible and simple measurement that does not require technical expertise is needed. Brachial-ankle PWV (baPWV) is one such technique that demonstrates a strong correlation with cfPWV.[11] To this end, the present study was conducted to determine changes in physiological parameters such as baPWV, AIx (%), central blood pressure and biochemical parameters such as serum OPG, serum cholesterol and triglyceride (TG), which may be regarded as markers of arterial stiffness with increasing age in both genders and to determine the correlation of the other parameters with baPWV, which is one of the most important non-invasive parameters to ascertain arterial stiffness.
MATERIALS AND METHODS
Subjects
Ours was an observational, cross-sectional study conducted between May 2017 and March 2019. Apparently, healthy 118 males and 114 females of age group 30–>60 years without any cardiovascular or peripheral vascular disease or on any antihypertensive and lipid-lowering therapy were recruited in the study. [Table 1] shows the age-specific subgroups of the participants.
| Age group | Male subjects (n=118) | Female subjects (n=114) |
|---|---|---|
| 30–40 years | 38 | 28 |
| 41–50 years | 43 | 44 |
| 51–60 years | 21 | 28 |
| >60 years | 16 | 14 |
Procedure
The ethical clearance for the project was obtained from Institute Ethics Committee, AIIMS Bhubaneswar. The recruited subjects were asked to report at Clinical Physiology Laboratory at around 10–10:30 a.m. and were requested to refrain from tea, coffee for 2–3 h before the test. After obtaining the informed consent from the participants, the detail medical, personal, nutritional and family history relevant to cardiovascular system were recorded in the prescribed data pro forma. The anthropometric indices were estimated. The subject was examined in a supine position after resting for 10 min. All parameters were recorded at 25°C in Clinical Physiology Laboratory in supine position. Peripheral (brachial artery) diastolic blood pressure (DBP), SBP, Central BP and AIx (%) were using USCOM BP+ (USCOM Ltd., Sydney, Australia). USCOM BP+ equipment employs supra systolic oscillometric technology to compute central blood pressure. For the recording of baPWV, pulse waveform of brachial artery and posterior tibial artery was recorded simultaneously with pulse transducers for 5 min using PowerlabTM 4/35 hardware and LabchartTM 8 reader software was used to analyse the data (AD Instruments, Sydney, Australia). The sample acquisition frequency was set at 1000 Hz. The components below 50 Hz were stored using a low pass filter and the wavefront was determined. The time interval between the foot of the wavefront of brachial and ankle waveform was designated as Δ Tba. The distance between the sampling points of baPWV was calculated in earlier report as follows: baPWV=(La-Lb)/ΔTba where, Lb = (0.2195 × height of the patient [in cm] –2.0734) and La = (0.8129 × height of the patient [in cm]+12.328), La and Lb are distances and ΔTba is pulse transit time.[12] However, in the present study, a minor modification was done in the equation. For calculation of Lb, superficial length from suprasternal notch to brachium, where pulse transducer was placed, was noted and for calculation of La, superficial length from suprasternal notch to ankle, where pulse transducer was placed, was noted. Therefore, the modified equation used in the present study is as follows: baPWV = (La-Lb)/ΔTba where, Lb = (0.2195 × suprasternal notch to brachium [in cm] –2.0734) and La = (0.8129 × suprasternal notch to ankle [in cm]+12.328), La and Lb are distances and ΔTba is pulse transit time.[13] Moreover, the coefficient of variation was calculated for these two measurements and was found to be 0.05%. In the present study, mean arterial pressure (MAP) and PP ratio (PPR) were derived from recorded brachial and central blood pressure. PPR is the ratio of peripheral PP to central PP. The representative record is shown in [Figure 1].
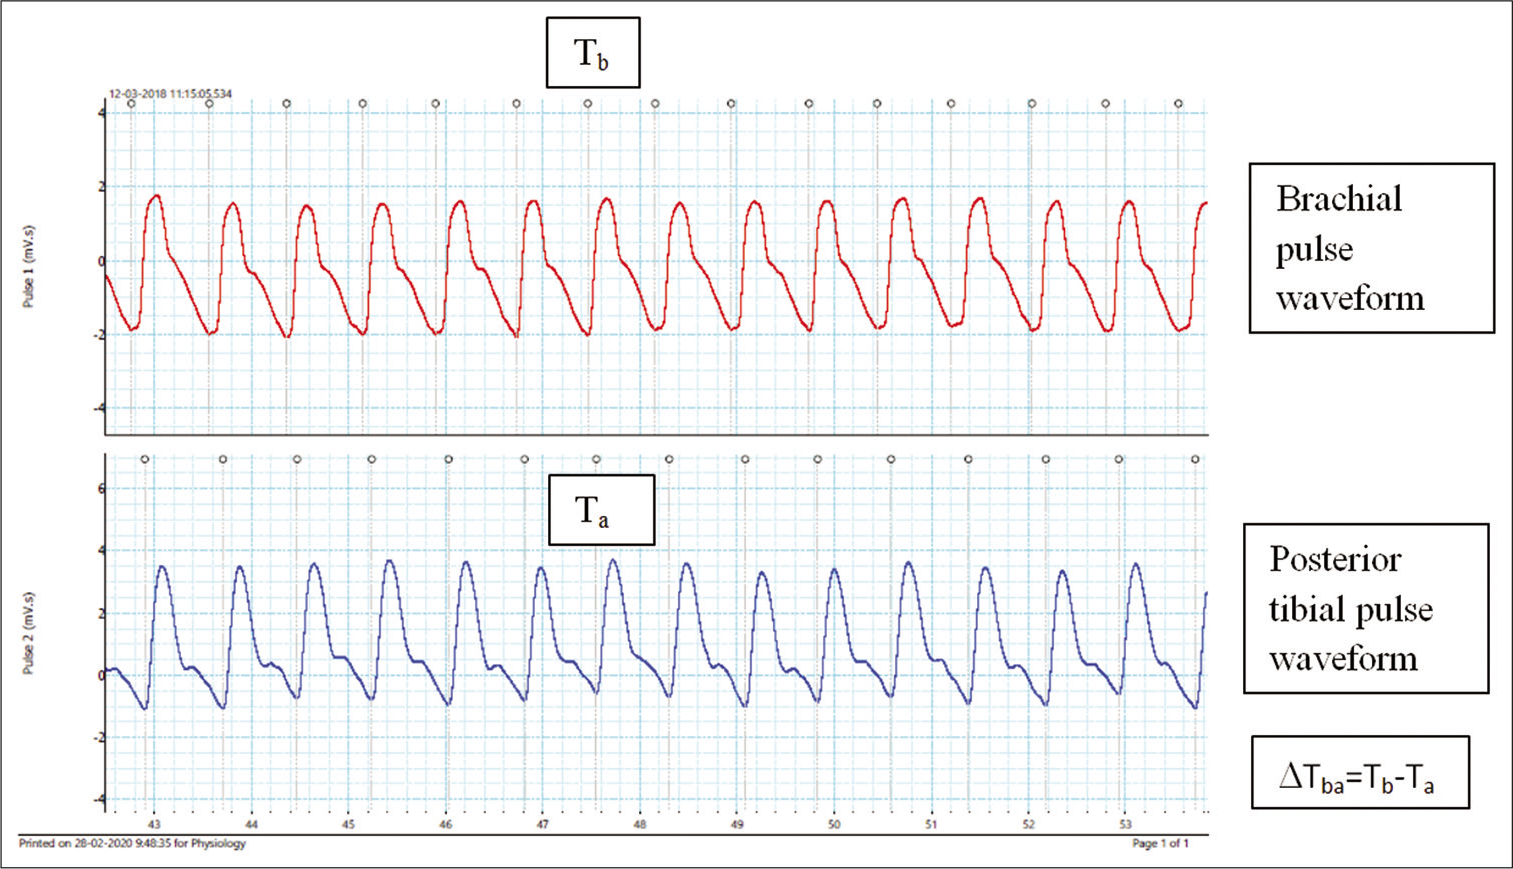
- Representative record showing brachial pulse waveform in the upper panel and posterior tibial pulse waveform in the lower panel. Grey dot, along with a grey line denotes the foot of the pulse wave front.
Five millilitres of whole blood were collected from anterior cubital vein of the participants under aseptic precautions and serum was separated following standard protocol. The separated serum samples were stored at −20°C. The serum was utilised for the estimation of lipid profile. The coloured product was estimated by colorimetric method (Erba Diagnostics, Germany). The serum was utilized for estimation of OPG level as well. OPG was measured by enzyme immunoassay method as per the manufacturer’s protocol (Sigma Chemical, St Louis, USA). The absorbance (A450) reading of the standards was used to plot the standard curve. The range of detectable concentrations of OPG by this assay was 1.23–900 pg/ml. All samples were tested in one single run.
Statistical analysis
Shapiro–Wilk normality test was applied to assess the distribution pattern of the data. The parameters were found to be non-normally distributed. The data were presented as median (Interquartile range). The differences between variables were compared using Kruskal–Wallis test followed by post hoc analysis. Spearman correlation analysis was performed to determine the association between baPWV and other parameters. Multiple linear regression analysis was performed to determine the factors associated with baPWV. P < 0.05 was considered statistically significant. The data were analysed using an appropriate statistical tool (SPSS software, version 20 SPSS, IBM Inc., Chicago, IL).
RESULTS
A total of 232 apparently healthy subjects in the age group of 30 to more than 60 years participated in the study. Out of them, 118 were male and 114 were female subjects. The data are shown in [Table 1]. The median age with an interquartile range of male subjects was 45.5 (37–54) years and that of female subjects was 47 (40.8–53.3) years. Anthropometric and clinical characteristics of the subjects are shown in [Table 2].
| Variables | Male subjects (n=118) | Female subjects (n=114) |
|---|---|---|
| Age (years) | 45.5 (37.0–54.0) | 47.0 (40.8–53.3) |
| Height (cm) | 163.3 (159.0–168.3)*** | 151.8 (147.0–155.0) |
| Weight (kg) | 65.0 (56.0–72.0)* | 62.5 (55.0–70.0) |
| BMI (kg/m2) | 24.4 (22.4–26.7) | 27.1 (24.1–29.3)*** |
| baPWV (cm/s) | 1211.1 (1045.1–1477.4) | 1289.6 (1073.8–1458.1) |
| Augmentation index (%) | 66.0 (52.0–81.3) | 85.5 (69.0–105.3)*** |
| Central SBP (mmHg) | 117.5 (108.8–130.3) | 125.5 (113.8–138.0)* |
| Central DBP (mm Hg) | 78.0 (73.5–89.0) | 81.0 (72.0–89.0) |
| Central pulse pressure (mm Hg) | 39.0 (34.0–48.0) | 43.5 (38.0–53.0)** |
| Central MAP (mm Hg) | 90.0 (85.6–103.3) | 95.0 (86.2–105.3) |
| Brachial SBP (mm Hg) | 128.5 (118.0–142.3) | 133.0 (121.0–146.3) |
| Brachial DBP (mm Hg) | 79.0 (73.0–90.0) | 79.0 (72.0–87.3) |
| Brachial pulse pressure (mm Hg) | 49.0 (43.0–59.3) | 52.0 (45.0–64.0)* |
| Brachial MAP (mm Hg) | 96.0 (87.8–104.9) | 96.2 (89.0–106.1) |
| Pulse pressure ratio | 1.3 (1.1–1.4)** | 1.2 (1.1–1.3) |
| Heart rate (bpm) | 78.0 (68.0–86.0) | 78.0 (72.0–88.5) |
| Serum cholesterol (mg/dl) | 190.0 (180.0–210.0) | 191.0 (180.0–210.3) |
| Serum triglyceride (mg/dl) | 142.0 (116.0–166.0) | 148.5 (125.8–164.0) |
| Serum LDLc (mg/dl) | 122.5 (109.0–137.5) | 121.0 (112.0–137.3) |
| Serum HDLc (mg/dl) | 40.0 (37.0–44.0) | 41.0 (38.0–42.3) |
| Serum VLDLc (mg/dl) | 28.4 (23.1–33.2) | 29.7 (25.2–32.9) |
| Serum osteoprotegerin (pg/ml) | 45.0 (28.0–90.0) | 45.0 (28.0–90.0) |
Data are represented as median (IQR), baPWV: Brachial ankle pulse wave velocity, *P<0.05, **P<0.01, ***P<0.0005. BMI: Body mass index, SBP: Systolic blood pressure, DBP: Diastolic blood pressure, MAP: Mean arterial pressure, LDLc: Low-density lipoprotein cholesterol, HDLc: High-density lipoprotein cholesterol, VLDLc: Very-density lipoprotein cholesterol
The analysis revealed that males had significantly higher values with respect to height (P < 0.0005), weight (P < 0.05) and PPR (P < 0.01) than females. Females had significantly higher values with respect to BMI (P < 0.0005), AIx (P< 0. 0005), central SBP (P < 0.05), central PP (P < 0.01) and brachial PP (P < 0.05) than males. There was no significant difference in other variables between the groups. [Table 3] shows the anthropometric and clinical characteristics of male subjects in different age groups.
| Variables | Group 1 (30–40 years) (n=38) | Group 2 (41–50 years) (n=43) | Group 3 (51–60 years) (n=21) | Group 4 (>60 years) (n=16) |
|---|---|---|---|---|
| Height (cm) | 162.3 (159.0–165.3) | 165.0 (160.0–170.0) | 166.0 (161.5–169.0) | 162.0 (151.0–168.8) |
| Weight (kg) | 66.0 (60.0–73.0) | 65.0 (56.0–72.0) | 64.0 (53.0–72.5) | 60.0 (53.5–71.5) |
| BMI (kg/m2) | 24.7 (23.1–27.1) | 24.8 (22.0–26.8) | 23.5 (21.6–25.4) | 23.7 (21.5–27.0) |
| baPWV (cm/s) | 1204.2 (1022.9–1503.9) | 1222.8 (1045.5–1415.8) | 1156.5 (1062.2–1488.2) | 1257.8 (1079.2–1473.8) |
| Augmentation index (%) | 56.0 (46.0–68.0) | 68.0 (52.0–82.0) | 80.0 (57.5–97.5)**(1,3) | 81.5 (63.0–127.0)***(1,4) |
| Central SBP (mmHg) | 114.0 (107.0–126.8) | 115.0 (110.0–-130.0) | 124.0 (114.5–147.5) | 132.0 (108.8–156.8) |
| Central DBP (mm Hg) | 78.0 (71.8–86.0) | 78.0 (74.0–89.0) | 80.0 (76.0–89.0) | 79.0 (69.0–96.0) |
| Central pulse pressure (mm Hg) | 36.0 (31.3–40.3) | 36.0 (32.0–48.0) | 43.0 (35.5–53.0) | 51.5 (41.0–62.5)***(1,4),*(2,4) |
| Central MAP (mm Hg) | 88.9 (83.7–98.8) | 89.7 (86.3–103.3) | 95.3 (89.3–106.4) | 97.7 (81.4–117.6) |
| Brachial SBP (mm Hg) | 126.5 (117.8–138.0) | 127.0 (117.0-140.0) | 132.0 (124.5-143.5) | 141.5 (114.8-165.8) |
| Brachial DBP (mm Hg) | 78.0 (71.0–88.0) | 79.0 (73.0–90.0) | 80.0 (74.5–89.0) | 79.0 (68.0–94.0) |
| Brachial pulse pressure (mm Hg) | 49.0 (42.8–55.0) | 47.0 (42.0–59.0) | 52.0 (44.5–62.0) | 65.0 (47.0–72.0)*(1,4) |
| Brachial MAP (mm Hg) | 93.9 (86.9–104.3) | 93.0 (88.7–104.7) | 98.3 (90.9–106.2) | 101.4 (83.3–118.2) |
| Pulse pressure ratio (PPR) | 1.3 (1.2–1.5)*(4,1) | 1.3 (1.1–1.4) | 1.2 (1.1–1.3) | 1.2 (1.1–1.2) |
| Heart rate (bpm) | 82.0 (75.8–88.3) | 76.0 (68.0–84.0) | 73.0 (65.0–82.5) | 73.5 (68.0–85.8) |
| Serum cholesterol (mg/dl) | 190.0 (180.0–206.3) | 190.0 (176.0–210.0) | 200.0 (177.0–218.5) | 204.0 (178.5–218.5) |
| Serum triglyceride (mg/dl) | 131.0 (117.0–158.5) | 148.0 (112.0–166.0) | 144.0 (116.0–165.0) | 161.0 (121.0–195.3) |
| Serum LDLc (mg/dl) | 124.5 (113.8–136.3) | 121.0 (106.0–133.0) | 125.0 (108.5–150.5) | 121.5 (108.3–149.5) |
| Serum HDLc (mg/dl) | 40.0 (38.0–44.0) | 41.0 (38.0–44.0) | 40.0 (37.0–44.5) | 39.5 (33.3–43.5) |
| Serum VLDLc (mg/dl) | 26.2 (23.4–31.7) | 29.6 (22.4–33.2) | 28.8 (23.2–33.0) | 32.2 (23.0–39.1) |
| Serum osteoprotegerin (pg/ml) | 45.0 (28.0–116.7) | 45.0 (28.0–90.0) | 45.0 (17.1–95.0) | 45.0 (28.0–45.0) |
Data are represented as median (IQR), baPWV: Brachial ankle pulse wave velocity, ****P<0.0005, ***P<0.001, *P<0.05. BMI: Body mass index, SBP: Systolic blood pressure, DBP: Diastolic blood pressure, MAP: Mean arterial pressure, LDLc: Low-density lipoprotein cholesterol, HDLc: High-density lipoprotein cholesterol, VLDLc: Very-density lipoprotein cholesterol
We observed that males of Group 4 (P < 0.001) and Group 3 (P< 0.005) had significantly higher AIx (%) in comparison to Group 1. Central PP in males of Group 4 was significantly higher in comparison to age Group 1 (P < 0.001) and in comparison to Group 2 (P < 0.05). Brachial PP is significantly higher in Group 4 (P < 0.05) in comparison to Group 1. PPR (P < 0.05) declined significantly with ageing. There was no significant difference in other variables in different age groups of male participants. [Table 4] shows the anthropometric and clinical characteristics of female subjects in various age groups.
| Variables | 30–40 years (n=28) | 41–50 years (n=44) | 51–60 years (n=28) | >60 years (n=14) |
|---|---|---|---|---|
| Height (cm) | 151.0 (146.6–157.0) | 152.8 (146.3–157.6) | 151.0 (149.0–152.8) | 152.5 (145.5–154.0) |
| Weight (kg) | 59.5 (54.3–65.8) | 65.0 (55.0–73.0) | 60.0 (55.0–65.0) | 65.0 (54.5–70.5) |
| BMI (kg/m2) | 25.9 (22.6–28.2) | 28.0 (23.8–30.4) | 26.4 (24.8–28.3) | 28.3 (23.6–32.0) |
| baPWV (cm/s) | 1312.4 (1089.0–1511.3) | 1267.6 (1015.1–1453.3) | 1222.2 (1010.9–1422.3) | 1415.1 (1200.0–1690.5) |
| Augmentation index (%) | 76.0 (62.5–87.8) | 86.0 (74.0–106.8) | 90.5 (68.5–106.5) | 95.5 (70.5-128.3)*(1,4) |
| Central SBP (mmHg) | 119.5 (110.8–130.0) | 133.5 (116.3–140.8) | 125.5 (111.3–137.0) | 126.5 (118.8–141.5) |
| Central DBP (mm Hg) | 79.0 (72.0–89.0) | 86.0 (76.3–93.8) | 78.0 (69.8–88.0) | 76.0 (67.8–83.3) |
| Central pulse pressure (mm Hg) | 40.5 (36.3–45.8) | 44.0 (37.0–55.8) | 44.0 (40.3–55.3) | 50.5 (42.8–55.8)*(1,4) |
| Central MAP (mm Hg) | 92.3 (85.3–102.0) | 100.7 (89.1–108.9) | 93.2 (85.7–104.7) | 93.0 (85.5–100.1) |
| Brachial SBP (mm Hg) | 128.5 (120.3–137.8) | 137.5 (123.3–148.0) | 133.0 (119.3–145.3) | 129.0 (125.5–150.0) |
| Brachial DBP (mm Hg) | 79.0 (73.5–87.5) | 83.0 (75.3–91.8) | 77.5 (70.3–86.8) | 75.0 (66.8–82.3) |
| Brachial pulse pressure (mm Hg) | 49.0 (41.0–57.5) | 52.0 (45.0–66.0) | 53.5 (47.5–63.8) | 62.5 (51.8–68.5)*(1,4) |
| Brachial MAP (mm Hg) | 95.2 (90.3–102.3) | 100.9 (90.7–109.8) | 94.7 (88.4–104.9) | 94.2 (85.7–104.1) |
| Pulse pressure ratio | 1.2 (1.1–1.3) | 1.2 (1.1–1.3) | 1.1 (1.1–1.2) | 1.2 (1.2–1.3) |
| Heart rate (bpm) | 80.5 (74.3–91.8) | 81.0 (72.5–89.5) | 76.0 (71.0–85.0) | 73.5 (64.5–85.0) |
| Serum cholesterol (mg/dl) | 188.0 (175.3–195.3) | 193.0 (179.3–211.0) | 197.5 (182.8–207.8) | 212.5 (187.0–231.0)*(1,4) |
| Serum triglyceride (mg/dl) | 140.0 (118.0–157.5) | 145.5 (118.0–164.0) | 150.0 (140.0–161.8) | 165.0 (144.8–185.0)*(1,4) |
| Serum LDLc (mg/dl) | 114.0 (107.5–124.0) | 122.5 (112.3–136.8) | 122.5 (112.0–137.0) | 137.5 (116.8–149.3)*(1,4) |
| Serum HDLc (mg/dl) | 40.0 (37.0–42.0) | 41.0 (39.0–43.0) | 40.5 (37.3–43.0) | 42.0 (40.8–43.5) |
| Serum VLDLc (mg/dl) | 28.0 (23.6–31.5) | 29.1 (23.6–32.8) | 30.0 (28.0–33.1) | 33.0 (29.0–37.0)*(1,4) |
| Serum osteoprotegerin (pg/ml) | 45.0 (28.0–97.5) | 45.0 (6.2–90.0) | 45.0 (45.0–90.0) | 45.0 (28.0–190.0) |
Data are represented as median (IQR), baPWV: Brachial ankle pulse wave velocity, *P<0.05. BMI: Body mass index, SBP: Systolic blood pressure, DBP: Diastolic blood pressure, MAP: Mean arterial pressure, LDLc: Low-density lipoprotein cholesterol, HDLc: High-density lipoprotein cholesterol, VLDLc: Very-density lipoprotein cholesterol
We observed that females of Group 4 had significantly higher AIx (%) (p<0.05), central PP (cPP) (P < 0.05), brachial PP (P < 0.05), serum cholesterol (P < 0.05), serum TG (P < 0.05), serum low-density lipoprotein cholesterol (LDLc) (P < 0.05) and serum very LDLc (VLDLc) (P < 0.05) in comparison to Group 1. There was no significant difference in other variables in different age groups of female participants.
Spearman correlation analysis showed that serum OPG level (r = 0.537, P < 0.0005) was major factor influencing the values of baPWV in male subjects [Figure 2]. However, central SBP (r = 0.181, P < 0.05), central DBP (r = 0.249, P < 0.01), central MAP (cMAP) (r = 0.227, P < 0.05), brachial SBP (r= 0.219, P < 0.05), brachial DBP (r = 0.275, P< 0.01), brachial MAP (r = 0.261, P < 0.01), serum cholesterol level (r = 0.193, P < 0.05) and serum LDLc level (r = 0.188, P = 0.05) were also other factors influencing the values of baPWV in male subjects. It is to be noted that weight is negatively associated (r = −0.216, P < 0.05) with baPWV values in male subjects. In the female subjects also, serum OPG level (r = 0.499, P < 0.0005) was major factor influencing the values of baPWV as per Spearman correlation analysis [Figure 3]. Moreover, central SBP (r = 0.268, P < 0.01), central DBP (r = 0.223, P < 0.05), central PP (r = 0.2, P < 0.05), cMAP (r = 0.245, P< 0.01), brachial SBP (r = 0.217, P < 0.05) and brachial MAP (r = 0.217, P < 0.05) were other factors influencing the values of baPWV in female subjects. [Table 5] shows multiple regression analysis using baPWV as the dependent variable in male and female subjects.
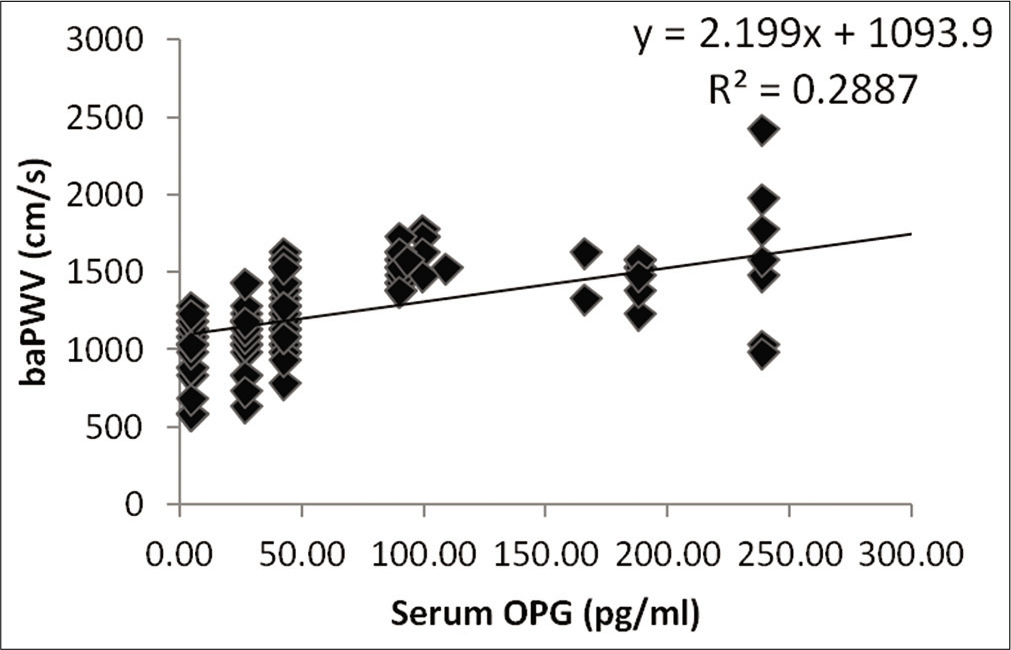
- Relationship of brachial systolic blood pressure measured in male participants with their serum osteoprotegerin level.
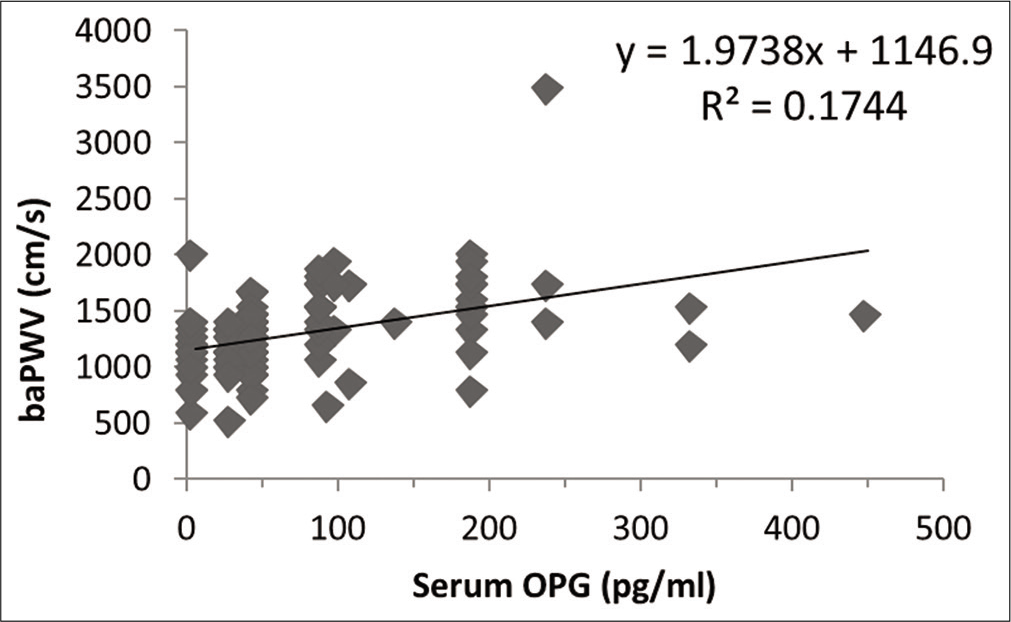
- Relationship of brachial systolic blood pressure measured in female participants with their serum osteoprotegerin level.
| Variables | Unstandardised coefficients | t-values | P | R2 |
|---|---|---|---|---|
| 0.318 | ||||
| Serum triglyceride (mg/dl) | 24.698 | 2.502 | 0.013* | |
| Serum VLDLc (mg/dl) | −122.836 | −2.499 | 0.013* | |
| Serum osteoprotegerin (pg/ml) | 2.192 | −2.007 | 0.0005*** |
*P<0.05, **P<0.005. VLDLc: Very-density lipoprotein cholesterol
The results of multiple regression analysis revealed that both in males and females, serum TG and OPG levels were strongly associated with baPWV. However, serum VLDLc was negatively associated with baPWV.
The predictive regression equations for serum TG, VLDLc and OPG considering baPWV as the dependent variable were calculated as follows.
baPWV = −0.854 (TG) + 1570.84
baPWV = −4.638(VLDL) + 1581.65
baPWV = 6.607(OPG) + 974.615
DISCUSSION
A total of 232 (118 males and 114 females) apparently healthy subjects (30 to > 60 years of age) participated in the present study. The participants of these varied age groups are exposed to the stress of daily life, which takes a toll on their cardiovascular system. Over and above, the process of aging leaves its natural signature on the structure of the vessel wall. Altogether, it may affect the functioning of the vascular system, which translates into imposing afterload on the heart. Various physiological and biochemical markers of arterial stiffness were utilised in the present study to ascertain the arterial stiffness in the participating individuals. One of the physiological parameters utilised was baPWV. Several studies have demonstrated that PWV is an independent predictor of coronary heart disease and stroke in apparently healthy subjects.[14,15] baPWV measurement reflects the flexibility of aorta and medium-sized arteries. There is an increasing trend of baPWV values found in both genders; however, it is not statistically significant. In postmenopausal females, baPWV is higher than males of similar age group, though it was not statistically significant. The previous studies have demonstrated that there is an association between baPWV and age.[16] However, in the present study, no association was observed between baPWV and age. It may be because of the lesser number of the participants, especially in the higher age group of both the genders in the present study.
AIx (%) quantitates the contribution of wave reflection in the generation of central pressure waveform. It is considered as a surrogate measure of arterial stiffness.[17] The present study demonstrated that with increasing age, AIx (%) was significantly higher irrespective of gender. Moreover, it was observed that AIx (%) in females was significantly more than males. This report supports a previous finding.[18] The females have smaller and stiffer blood vessels than males, which results in an earlier return of the reflected wave. It causes a significant increase in AIx (%) in females than males irrespective of age group.[19]
Besides, we observed a significant rise in central PP and brachial PP in both genders with increasing age. It is in agreement with the prevailing knowledge of the structural change in the arterial wall with ageing.[17] This biological alteration in elastic arterial wall is responsible for arterial stiffness, which causes earlier wave reflection during systole that, in turn, causes an increase in central SBP. Therefore, it is a fact that SBP and PP increase with age. The present study also documented a rise in central and brachial systolic pressure with increasing age irrespective of gender.
PP varies throughout the vascular tree. It varies because of the structural difference in the vascular system, which gives rise to varying vascular compliance, which is region-specific, and it gives rise to a varied pattern of reflection of the wave. These two factors influence peripheral PP. Moreover, physiological factors such as posture, exercise and ageing also influence PP amplification.[17] Therefore, peripheral PP cannot determine precisely left ventricular workload. It is the central PP that can determine left ventricular workload.[20] One of the derived vascular parameters, PPR (amplification of PP between aorta and brachial artery) declined significantly with increasing age in males, which is in agreement with a previous report.[17] It is the ratio of peripheral PP to central PP. Age-related decline in amplification is due to earlier wave reflection, which causes a change in the aortic waveform. Biochemical analysis revealed that serum cholesterol and LDLc level were significantly high in females with increasing age. Endothelial dysfunction may contribute to arterial stiffness in dyslipidaemia.[18] Hormonal changes during menopause may also add to further stiffening of arteries in females.
Correlation analysis showed that serum OPG level was strongly associated with baPWV in both male and female subjects. Furthermore, central SBP, DBP and MAP, as well as brachial SBP, DBP and MAP, were also associated with baPWV.
An age-dependent increase in serum OPG level was documented previously.[21] This increase in serum OPG level, which has anti-bone resorptive activity, may reflect bone protective action with increasing age. Furthermore, OPG serum concentration displayed low variability below 45 years of age, whereas more considerable variability was observed in older men.[21] Interestingly, its role in vascular calcification is also well known. Therefore, higher serum OPG level is implicated in the atherogenesis in the older age group. Pro-inflammatory cytokines such as TNF-α stimulates the expression of OPG by vascular smooth muscle cells and endothelial cells.[22] In turn, OPG promotes the expression of adhesion molecules for leucocyte adhesion to endothelial cells in the presence of TNFα.[23] It was documented that serum OPG was associated with future risk of myocardial infarction, ischaemic stroke, total mortality and the mortality of ischaemic heart disease.[24]
The present study did not reveal any age-associated significant change in serum OPG levels in both genders. However, linear regression analysis revealed that irrespective of age group, serum OPG level and TG level was strongly associated with baPWV in both males and females. However, serum VLDLc was negatively associated with baPWV. It was reported that high TG was significantly associated with high baPWV values as measured in the Japanese population.[25]
Limitations of the study and future direction
The number of participants in the present study is limited. A large number of participants across various age groups and both genders are required to estimate the cutoff value of baPWV in the given population.
CONCLUSION
It may be concluded that with increasing age, cardiovascular parameters such as central blood pressure, peripheral blood pressure and AIx (%) were increased in both genders and PPR was decreased in males. The values of baPWV also exhibited an increasing trend with age, though statistically not significant. Serum cholesterol, TG, LDLc and VLDLc level in females were increased with age. Serum OPG level and serum TG levels emerged as major factors, which influence baPWV values in both genders irrespective of age.
Acknowledgement
The contribution made by the participants is acknowledged by the authors. The authors also acknowledge the helping hand provided by laboratory technician Mr. Pramod Kumar Das for biochemical analysis. The authors also acknowledge the help provided by Dr. Dinesh Prasad Sahu, Senior Resident, Department of Community and Family Medicine, AIIMS Bhubaneswar in formulating regression equation.
Declaration of patient consent
Patient’s consent not required as there are no patients in this study.
Financial support and sponsorship
The present study was funded by AIIMS Bhubaneswar under the scheme of Intramural funded project (2016-2017).
Conflicts of interest
There are no conflicts of interest.
References
- Arterial and cardiac aging: Major shareholders in cardiovascular disease enterprises, Part III: Cellular and molecular clues to heart and arterial aging. Circulation. 2003;107:1-28.
- [CrossRef] [PubMed] [Google Scholar]
- Elevated aortic pulse wave velocity, a marker of arterial stiffness, predicts cardiovascular events in well-functioning older adults. Circulation. 2005;111:3384-90.
- [CrossRef] [PubMed] [Google Scholar]
- Calcification in atherosclerosis. Nat Rev Cardiol. 2009;6:681-8.
- [CrossRef] [PubMed] [Google Scholar]
- Vascular calcification: Pathobiological mechanisms and clinical implications. Circ Res. 2006;99:1044-59.
- [CrossRef] [PubMed] [Google Scholar]
- Osteoclast differentiation factor is a ligand for osteoprotegerin/osteoclastogenesis-inhibitory factor and is identical to trance/rankl. Proc Natl Acad Sci USA. 1998;95:3597-602.
- [CrossRef] [PubMed] [Google Scholar]
- PDGF induces osteoprotegerin expression in vascular smooth muscle cells by multiple signal pathways. FEBS Lett. 2002;521:180-4.
- [CrossRef] [Google Scholar]
- Endothelial dysfunction and systemic inflammation in persons with echolucent carotid plaques. Thromb Haemost. 2006;96:53-9.
- [CrossRef] [PubMed] [Google Scholar]
- RANKL regulates endothelial cell survival through the phosphatidylinositol 3'-kinase/akt signal transduction pathway. FASEB J. 2003;17:2163-5.
- [CrossRef] [PubMed] [Google Scholar]
- Serum osteoprotegerin levels are associated with the presence and severity of coronary artery disease. Circulation. 2002;106:1192-4.
- [CrossRef] [PubMed] [Google Scholar]
- Soluble receptor activator of nuclear factor kappa B ligand and risk for cardiovascular disease. Circulation. 2007;116:385-91.
- [CrossRef] [PubMed] [Google Scholar]
- Pulse brachial-ankle pulse wave velocity: Myths, misconceptions, and realities. Pulse (Basel). 2015;3:106-13.
- [CrossRef] [PubMed] [Google Scholar]
- Validity, reproducibility, and clinical Significance of noninvasive brachial-ankle pulse wave velocity measurement. Hypertens Res. 2002;25:359-64.
- [CrossRef] [PubMed] [Google Scholar]
- Effect of laboratory stressor on arterial compliance in young women. Indian J Physiol Pharmacol. 2019;63:242-5.
- [Google Scholar]
- Pulse wave velocity in patients with obesity and hypertension. Am Heart J. 1986;112:136-40.
- [CrossRef] [Google Scholar]
- Cigarette smoking and hypertension, factors independently associated with blood hyperviscosity and arterial rigidity. Arteriosclerosis. 1987;7:572-7.
- [CrossRef] [PubMed] [Google Scholar]
- Reference value of brachial-ankle pulse wave velocity for the eastern Chinese population and potential influencing factors. Braz J Med Biol Res. 2011;44:1000-5.
- [CrossRef] [PubMed] [Google Scholar]
- Heart rate dependency of pulse pressure amplification and Arterial Stiffness. Am J Hypertens. 2002;15:24-30.
- [CrossRef] [Google Scholar]
- Reference values for the augmentation index and pulse pressure in apparently healthy Korean subjects. Korean Circ J. 2010;40:165-71.
- [CrossRef] [PubMed] [Google Scholar]
- Gender differences in the timing of arterial wave reflection beyond differences in body height. J Hypertens. 2001;19:2197-203.
- [CrossRef] [PubMed] [Google Scholar]
- Haemodynamic basis for the development of left ventricular failure in systolic hypertension and for its logical therapy. J Hypertens. 1995;13:943-52.
- [CrossRef] [PubMed] [Google Scholar]
- Osteoprotegerin serum levels in men: Correlation with age, estrogen, and testosterone status. J Clin Endocrinol Metab. 2001;86:3162-5.
- [CrossRef] [PubMed] [Google Scholar]
- Osteoprotegerin upregulates endothelial cell adhesion molecule response to tumor necrosis factor-alpha associated with induction of angiopoietin-2. Cardiovasc Res. 2007;76:494-505.
- [CrossRef] [PubMed] [Google Scholar]
- Osteoprotegerin increases leukocyte adhesion to endothelial cells both in vitro and in vivo. Blood. 2007;110:536-43.
- [CrossRef] [PubMed] [Google Scholar]
- Serum osteoprotegerin is a predictor for incident cardiovascular disease and mortality in a general population: The Tromso study. J Thromb Haemost. 2011;9:638-44.
- [CrossRef] [PubMed] [Google Scholar]
- Association of serum triglycerides with arterial stiffness in subjects with low levels of low-density lipoprotein cholesterol. Circ J. 2018;82:3052-7.
- [CrossRef] [PubMed] [Google Scholar]


