
Translate this page into:
Correlation between epicardial fat thickness and maximum oxygen utilisation in obese adult males: A cross-sectional study

*Corresponding author: Dr. Ekta Khandelwal, Professor, Department of Physiology, All India Institute of Medical Sciences, Raipur, Chhattisgarh, India. khandelwaldrekta@aiimsraipur.edu.in
-
Received: ,
Accepted: ,
How to cite this article: Suryawanshi G, Singh S, Ingle AS, Khandelwal E. Correlation between epicardial fat thickness and maximum oxygen utilisation in obese adult males: A cross-sectional study. Indian J Physiol Pharmacol. 2024;68:189-95. doi: 10.25259/IJPP_28_2024
Abstract
Objectives:
In general, the accumulation of fats causes a decrease in exercise tolerance. The effect of various obesity parameters on exercise tolerance is not clear. Theoretically, epicardial fat is an energy source for myocardial contraction but also releases pro-inflammatory factors, limiting coronary blood flow. No data are available about the influence of epicardial fats on exercise tolerance.
Materials and Methods:
The present cross-sectional study was conducted on 31 obese males aged 25–35. The parameters recorded were body mass index (BMI), waist-to-hip ratio (W/H ratio), and percentage body fat (%BF), which were calculated by measuring skinfold thickness at various standard sites. To determine aerobic exercise performance, VO2 max was determined using a treadmill. The epicardial fat thickness (EFT) was measured by echocardiography, at short and long axis.
Results:
Demographic values for 31 subjects BMI (26.50 ± 1.34) kg/m2, W/H ratio (1.02 ± 0.013) and %BF (25.09 ± 4.29) showed obesity. The EFT on ultrasound showed EFT at the short axis (3.45 ± 1.39 mm) and EFT at the long axis (3.09 ± 1.24 mm). Cardiopulmonary exercise testing showed an estimated VO2 max (32.74 ± 5.38 mL/kg/min) for 31 subjects. On Pearson’s correlation analysis and multivariate linear regression analysis, it was noted that only the EFT at the short axis showed a statistically significant negative correlation with VO2 max (P < 0.05), along with 13.7% of independent prediction.
Conclusion:
The results suggested that epicardial fat (measured in short axis view) plays an important role as a limiting factor for exercise affecting aerobic capacity, particularly in obese young adults.
Keywords
VO2 max
Epicardial fat thickness
Percentage body fat
Body mass index
Waist-to-hip ratio

INTRODUCTION
It is a general consideration that the accumulation of fats, that is, obesity, causes a decrease in exercise tolerance. The fats accumulate at various sites such as subcutaneous regions, omentum, mediastinum and various visceral organs. A small percentage of the visceral fats are accumulated around the heart as well. The adipose tissue accumulated between the visceral pericardium and the myocardium is known as epicardial fat. The right ventricular wall, atrioventricular and interventricular grooves predominantly accommodate the majority of epicardial fat.[1] A small amount of adipose tissue and the adventitia of the coronary arteries extend from the epicardial surface into the myocardium. Thus, epicardial fat and myocardium share the same microcirculation arising from the coronary arteries.[2]
Many studies have documented the positive correlation of epicardial fat thickness (EFT) with coronary artery disease (CAD) risk and left ventricular dysfunction.[3,4] As epicardial fat and myocardium share the same microcirculation, it is postulated that the epicardial fat contributes as the energy source for the heart during exercise. On the contrary, few of the researchers have noted that it releases pro-inflammatory factors causing harm to coronary vessels and myocardium. [5-7] Thus, epicardial fat might be playing a dual role, which is unfavourable and supportive. Hence, our research question is whether epicardial fat has any role in limiting or promoting exercise compared to the conventionally used parameters of obesity. The present study aimed to investigate the association between EFT and aerobic capacity in young obese adults.
MATERIALS AND METHODS
The present observational cross-sectional study was conducted on 31 obese males of age group 25–35 years to assess the influence of body composition on their exercise performance. This sample size calculation was based on the University of California San Francisco, clinical and translational science institute and correlational sample calculator. The sample size was calculated using the formula, sample size = n = ([Zα + Zβ]/C) 2 + 3.
To achieve this, the following parameters were recorded: physical, anthropometrical parameters (body mass index [BMI], waist-to-hip [W/H] ratio, percentage body fat [%BF] and EFT) and aerobic exercise performance (VO2max) obtained on a treadmill with maximal heart rate (HRmax) as per modified Bruce protocol. All the recordings were performed in the cardiopulmonary exercise testing (CPET) laboratory, Department of Physiology, All India Institute of Medical Sciences, Raipur (Chhattisgarh), India, after obtaining Institute Ethical Committee approval (IEC) approval.
The participants were recruited from the general community consisting of volunteers and staff. In general, the volunteers were healthy, were not consuming any medication and on any physical training program known to alter lipid metabolism and were reportedly free of any diagnosed cardiovascular disease, any contraindication to exercise, or any known metabolic disorder. The nature, purpose and potential risks of the study were explained to all the subjects, and voluntary informed written consent was obtained from all subjects before participation in the study. The study was initiated after obtaining approval from the Institute Ethics Committee. Written informed consent was obtained from all the subjects, who met inclusion and exclusion criteria after explaining and giving the participant information sheet as per institute ethical guidelines.
Inclusion criteria
The following criteria were included in the study:
(1) Males of 25–35 years of age, (2) participants having a waist circumference (WC) of >90 cm, BMI 25 kg/m2–30 kg/m2 and W/H ratio >1 (all three criteria were mandatory for inclusion of subject), (3) apparently healthy, not consuming any medication and were reportedly free of any diagnosed cardiovascular disease, or metabolic disorder and (4) not on any physical training program, known to alter lipid metabolism.
Exclusion criteria
The following criteria were excluded from the study: (1) Fasting blood glucose >110 mg/dL. (2) Total cholesterol >200 mg/dL, triglyceride >150 mg/dL. (3) Forced expiratory volume over 1 second <80% predicted, forced vital capacity <80% predicted and peak expiratory flow rate <400 lit/min. (4) Anaemic individuals. (5) Smoking, alcohol and drug abuse history. (6) Undergoing any physical conditioning programme. (7) The subjects with a previous history of any abdominal injury/surgery, patients with metabolic, cardiovascular, respiratory, neurological, kidney diseases, or any musculoskeletal abnormality.
Methodology
After recording the vitals, standing height (cm) and body weight (kg) were measured to calculate the BMI. The WC and hip circumference were measured by standard methods to estimate the W/H ratio.[8]
%BF was estimated using skin fold calliper
It is an indicator of excess overall subcutaneous fats, which was calculated by taking skin fold thickness at various standard sites on the dominant side using a skin fold calliper (Harpenden, HSB-BI by Baty international) in a standing erect position, with arms relaxed. Two readings were taken at each skin fold of the following sites and then averaged: All skinfold measurements (i.e. triceps, biceps, suprailiac and subscapular) were picked up between the thumb and forefinger, pinching the skin and pulling it away from the underlying muscle; thereafter applying callipers 1 cm from the ridge of the skin thus formed and reading taken 3 s after an application of the callipers, to standardise any effects produced by deformation of tissue.[9]
Estimation of EFT
An echocardiogram was performed with a portable ultrasound (4D Phillips Affiniti 50 ultrasound machine) in the echo room of the cardiology unit. The EFT was identified as the echo-free space between the outer wall of the myocardium and the visceral layer of the pericardium. The thickness was measured perpendicularly on the free wall of the right ventricle at the end-systole in three to ten cardiac cycles post-expiration.[10,11] To avoid errors in inter-subject measurements, anatomical landmarks, such as the position of the interventricular septum and the aortic annulus, were used.[12] The images were stored in the device for accurate measurement along both the parasternal long (PLAx) and short axis (PSAx) (in millimetres).
Estimation of VO2 max
Based on the haemoglobin level, fasting glucose, lipid profile and pulmonary function test (PFT) values, participants were evaluated for potential exclusion from the study due to safety concerns/contraindications for conducting an exercise stress test for estimation of VO2 max. Participants who successfully fulfilled inclusion criteria were then scheduled for exercise performance, most preferably the following morning or a minimum of 3 hours after a meal.[13]
The measurements of maximum oxygen uptake (VO2 max) were done during a step-vice increased physical workload up to the maximum on the treadmill jogging test. The equipment consists of a metabolic cart (Quark CPET, COSMED) and a treadmill (CARDIOTRACK 900EXL). The metabolic cart contains a gas analyser (Quark CPET, COSMED), a computer, and screens that display 12-lead electrocardiogram, ST segment analysis (Omnia software ver. 1.6.8), and graphical displays of the physiological changes continuously as they occur during exercise.
The flow calibration was done before each test. The test was performed in a well-lit room with all resuscitation facilities. The maximum aerobic capacity, that is, VO2 max, is the highest VO2 recorded when a patient’s VO2 value reaches a peak or a plateau with work rate increments. Before the commencement of the exercise test, absolute and relative contraindications of CPET for each subject were ruled out.[13-15]
The exercise tests were performed on a treadmill with a modified Bruce protocol having 10 steps with a starting speed of 2.74 km/h, which is then increased periodically (3 min) to increase the work rate by 10–20 W/min to a maximum duration of 30 min with a maximum speed of 12.07 km/h. The optimal duration of the test was decided by the subject’s HRmax (220 – age of subject) value. Whatever value of VO2 peak was obtained at this HRmax value represented the VO2 max of that individual. Simultaneous monitoring of vital parameters such as heart rate, oxygen saturation, blood pressure and 12 lead ECG, along with breath-by-breath gas analysis, was observed and recorded.
Statistical data analysis
The correlation analysis between the study variables is performed using Pearson’s method. Multivariate linear regression analysis (MLRA) is used to obtain the statistically significant and independent predictors of the outcome variable (VO2 max). The underlying normality assumption was tested before subjecting the study variables to Pearson’s correlation analysis and MLRA (dependent variable only).[16] All results are shown in tabular as well as graphical format to visualise the statistically significant difference more clearly. Scatter diagrams are used along with lines of regression and R2 values to study the correlations.
In the entire study, P < 0.05 are considered to be statistically significant. All the hypotheses were formulated using two-tailed alternatives against each null hypothesis (hypothesis of no difference). The entire data are statistically analysed using the Statistical Package for the Social Sciences 20.0, IBM Corporation, USA for MS Windows.
RESULTS
This study involved 37 male participants, but only 31 were included, as six participants denied performing exercise tests. The demographic profile is shown in Table 1.
| Parameters | Descriptive statistics measures |
|---|---|
| Mean±SD | |
| Age (years) | 30.26±2.93 |
| BMI (kg/m2) | 26.50±1.34 |
| Waist-to-hip ratio | 1.02±0.013 |
| Body fat (%) | 25.09±4.29 |
| Epicardial fat thickness (Short axis) (mm) | 3.45±1.39 |
| Epicardial fat thickness (Long axis) (mm) | 3.09±1.24 |
| VO2 max (mL/kg/min) | 32.74±5.38 |
BMI: Body mass index, SD: Standard deviation
Distribution of level of aerobic exercise capacity as measured by VO2 max
The present study’s mean VO2 max of 31 obese participants is 32.74 ± 5.38 mL/kg/min [Table 1]. Although there are no normative values for the categorisation of the level of VO2 max, according to Robert Wood, ‘Norm values for VO2max’.[17] Figure 1 represents the pie chart distribution of VO2 max of studied subjects based on categories.
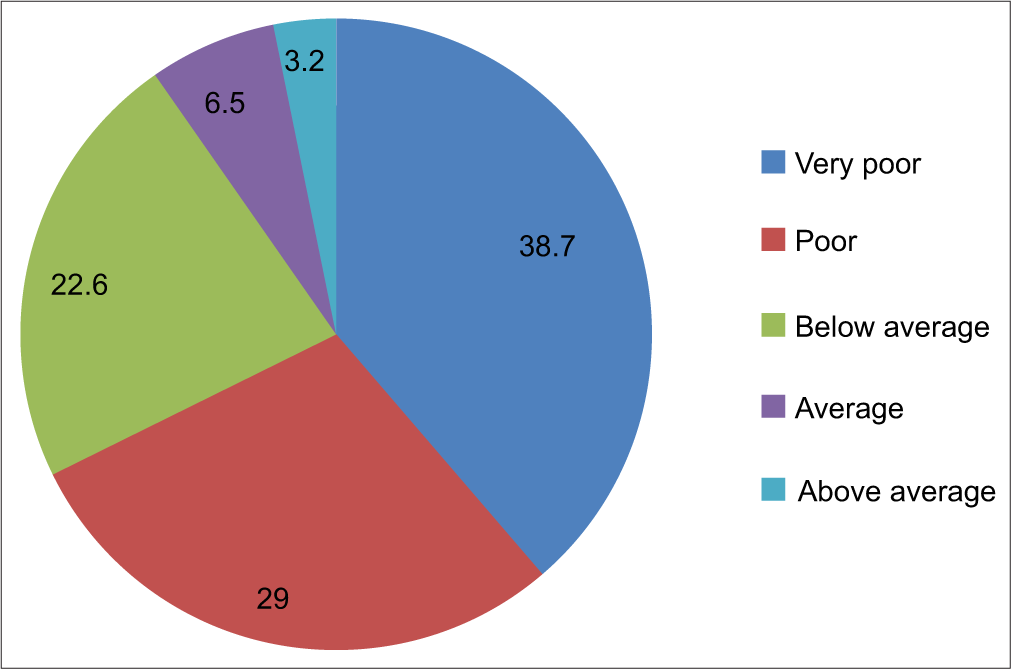
- Distribution of level of aerobic exercise capacity as measured by VO2 max among the cases studied.
Correlation analysis of age and body composition parameters with VO2 max
The correlation of age and body composition parameters with VO2 max was analysed using Pearson’s two-tailed correlation. On Pearson’s correlation analysis, age, BMI, W/H ratio, %BF and EFT (Long axis) with VO2 max showed a statistically non-significant negative correlation. However, EFT (Short axis) showed a statistically significant negative correlation with VO2 max (P < 0.05). Higher EFT (Short axis) is significantly associated with lower VO2 max and vice-versa (P < 0.05) [Table 2].
| Parameters | VO2 max (mL/kg/min) | ||
|---|---|---|---|
| r-value | P-value | Statistical significance | |
| Age (years) | −0.253 | 0.169 | NS |
| BMI (kg/m2) | −0.120 | 0.521 | NS |
| Waist-to-hip ratio | −0.045 | 0.812 | NS |
| Body fat (%) | −0.237 | 0.198 | NS |
| Epicardial fat thickness (short axis) (mm) | −0.408 | 0.023* | sig. |
| Epicardial fat thickness (long axis) (mm) | −0.307 | 0.093 | NS |
Correlation analysis using Pearson’s method. P<0.05 is considered to be statistically significant. *P<0.05, NS: Statistically non-significant. sig.: Statistically significant, BMI: Body mass index
We noted that the EFT short axis, that is EFTSAx (r = −0.408), correlated negatively with VO2 max with the percentage R2 value (16.7%) along with the regression line shows a statistically significant (P = 0.023) inverse relation between two variables, as shown in the scattered diagram [Figure 2].
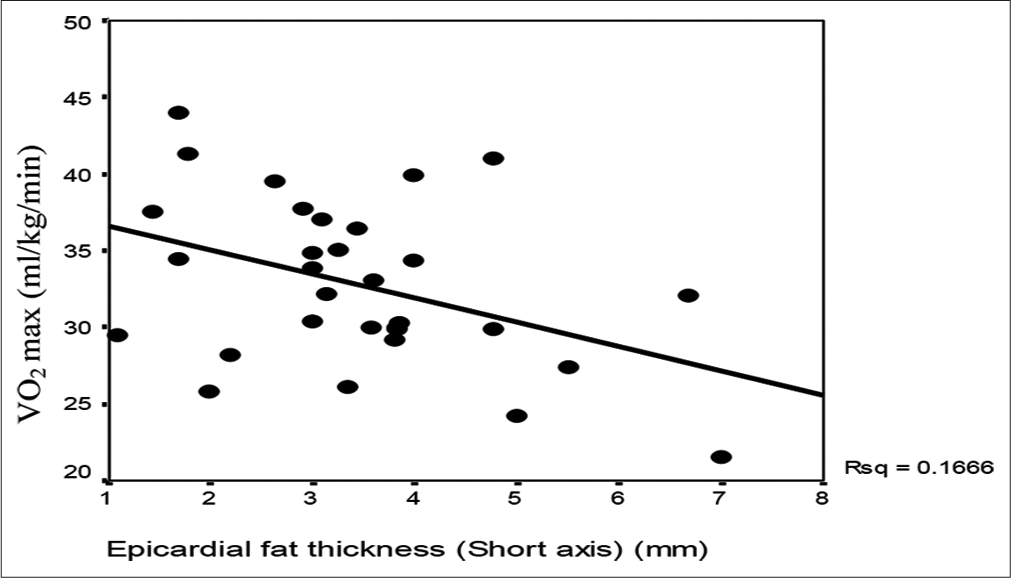
- Scatter diagram showing correlation analysis of epicardial fat thickness (short axis) and VO2 max among the cases studied.
The scatter diagram of Figure 3 shows a strong positive correlation (r = 0.838) between EFT (short axis) and EFT (long axis) among the studied participants. The percentage R2 value (70.3%), along with the regression line, shows a statistically significant (P = 0.001) direct relationship between the two variables.
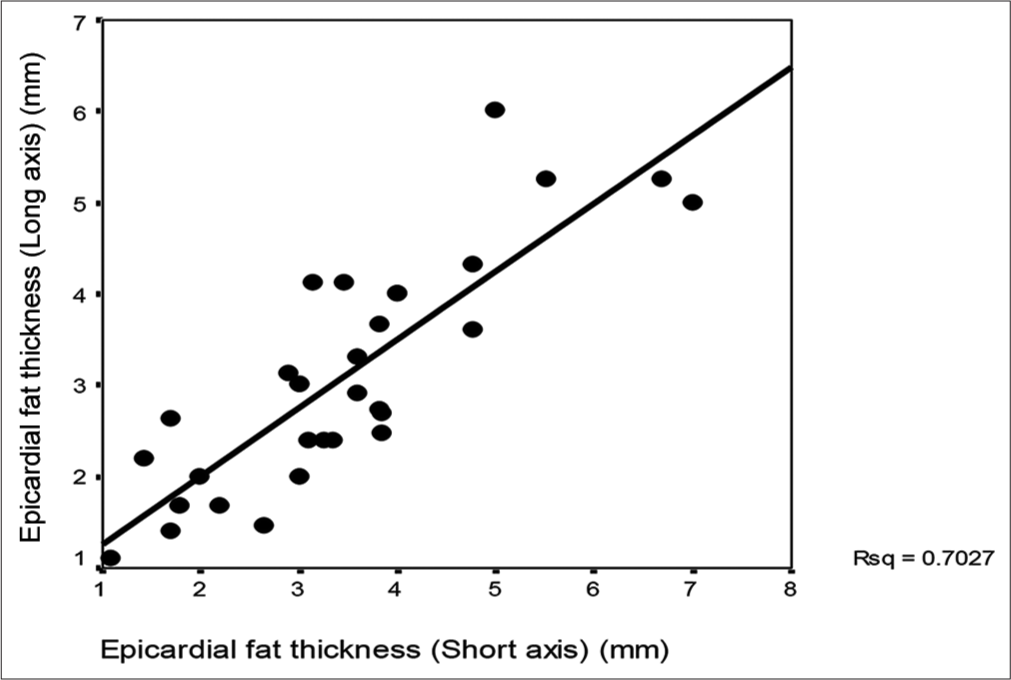
- Scatter diagram showing correlation analysis of epicardial fat thickness (EFT) (short axis) and EFT.
MLRA
MLRA was used to obtain the independent predictors of VO2 max in the study group. Variables such as age, %BF, and EFT (short axis) were used as the independent variables (IVs) regarding the inter-relationship correlation analysis performed. The correlated variables were not used in the regression model to avoid the influence of collinearity.
On MLRA, the lower value of EFT (Short axis) was the independent and significant predictor of a higher value of VO2 max after adjusting for age and %BF (P < 0.05). The adjusted R2 value (by considering the number of IVs used in the model) in the associated linear regression model was 13.7% [Table 3].
| Variables in the model | Beta | Std. Beta | T-value | P-value | Adjusted R2 (%) |
|---|---|---|---|---|---|
| Constant | 50.73 | -- | 5.273 | 0.001* | 13.7% |
| Age | −0.327 | −0.178 | −0.931 | 0.360NS | |
| Body fat % | −0.122 | −0.097 | −0.504 | 0.618NS | |
| Epicardial fat thickness (Short axis) | −1.460 | −0.379 | −2.210 | 0.036† |
Dependent variable: VO2 max. P<0.05 is considered to be a statistically significant independent predictor. *P<0.001, †P<0.05, NS: Statistically non-significant, MLRA: Multivariate linear regression analysis
DISCUSSION
In this study, we evaluated the influence of various body composition parameters (BMI, W/H, %BF and EFT) on aerobic capacity (VO2 max) of Indian obese adult males and found only EFT (short axis) to be significantly correlating with VO2 max. We also recorded that EFT (short axis) independently and maximally predicts the VO2 max in obese, young adult Indian males. In our study, BMI showed a non-significant, weak negative correlation with VO2 max; similar findings were also reported by Mondal and Mishra while studying young adult obese males.[18] However, Gondoni et al.[19] showed a very strong negative correlation between BMI and VO2 max among elderly, obese, ischemic heart disease patients. Setty et al.[20] and Laxmi et al.[21] also reported a significant negative correlation between BMI and VO2 max in normal BMI young adults. The reduction in aerobic capacity can be attributed to the observation that an excessive amount of body fat exerts an unfavourable burden as well as hinders action toward cardiac function, particularly during exhaustive exercise.
The W/H ratio is known to be a better predictor of cardiovascular disease than BMI, with an increase in age. Our study shows a non-significant negative correlation between the W/H ratio and VO2 max. Vivek et al.[22] reported a significant negative correlation between the W/H ratio and VO2 max, stating that the decrease in exercise capacity in obese patients might be due to the added energy needed to move fat mass during exercise.
%BF is a measurement of body composition identifying how much of the weight of the body is fat. The percentage of the body that is not fat is fat-free mass. %BF is a better parameter than BMI for the prediction of VO2 max. [19] Our study showed a non-significant negative correlation between %BF and VO2max. This was in accordance with Goran et al.[23], Shete et al.[24] and Sharma et al.[25], who reported non-significant impaired VO2 max in overweight and obese individuals. They argued that %BF does not necessarily reduce the maximal oxygen consumption at the initial stages of exercise but hampers tremendously as the workload or longevity of exercise increases, thus reducing VO2 max.
The mean EFT (short axis) and (long axis) of our participants are 3.45 ± 1.39 mm and 3.09 ± 1.24 mm, respectively. Shah et al. [26] in 2014, while studying Indian male obese subjects, reported a mean EFT of 1.3 mm. Vivek et al.[27] while studying the correlation of epicardial fat, anthropometric measurements in middle-aged healthy Asian-Indian reported mean epicardial fat in both the parasternal long axis and short axis as 2.6 ± 1.3 mm. Similarly, Meenakshi et al.[11] reported mean EFT of 5.55 mm and 5.91 mm in Indian elderly obese, disease-free males and females, respectively. This implies that an increase in age among obese individuals might be the cause of a relatively higher EFT in our study population. When comparing EFT with another ethnicity, Capristo et al.[28], while studying European middle-aged men with and without metabolic syndrome, reported a mean EAT thickness of 4.1 ± 1.8 mm among the subjects without metabolic syndrome. The exact cutoff value has not yet been established, but recently, Pruthvi et al.[29], in 2020, while studying the correlation between EFT and CAD among elderly Indian patients, suggested an EFT cutoff of 6.25 mm for CAD severity. Hence, suggesting that increased EFT is seen in disease conditions, but increased EFT independently predicting disease is yet to be determined.
Our study showed that EFT (short axis) is significantly inversely correlated to VO2 max. Among the limited body composition parameters studied, only EFT (short axis) was able to independently predict 13.7% of the VO2 max attained by the subject. Our finding is in congruence with the reporting of Bairapareddy et al.[30], who recorded a significant improvement in VO2 max with a reduction in EFT among both mildly obese Indian males and females. Similar findings were also reported by Kim et al.[31] in Japanese obese males. This correlation deepens with comorbidity, as reported by Gorter et al.[32] while studying heart failure patients with preserved ejection fraction.
A significant correlation between EFT and BMI was reported by Iacobellis et al.,[33] Meenakshi et al. [11], and Vivek et al.[27] A significant correlation between EFT and WC was reported by Vivek et al.[27] and Pruthvi et al.[29] in their respective studies. In our study, EFT did not correlate significantly with any of the other body composition parameters (BMI, W/H or %BF). The selection of a relatively young and narrow age group of 25–35 years, along with mild obesity, might be the probable reason for the non-significant correlation.
Scope and limitations of the study
The complete lockdown of COVID-19 forced us to restrict the sample size from 47 to 31 participants only. Our study showed non-significant negative correlations between BMI, W/H ratio, %BF and EFT (long axis) with VO2 max. This can be attributed to a reduction in sample size due to the complete lockdown of COVID-19. EFT was measured utilising a relatively simple and inexpensive method of echocardiography, rather than the comparatively more precise computed tomography, which could have exactly measured the total volume of epicardial adiposity instead of thickness. Our study also pointed out that EFT (short axis) has a 13.7% independent predictability of one’s aerobic capacity. It may have an important role in predicting aerobic capacity more accurately with other independent factors beyond the scope of this study, such as total cholesterol, inflammatory markers, and hormones like leptin and adipokines. Further researchers are encouraged to study for larger sample sizes and correlations in other genders as well.
CONCLUSION
We found that EFT measurement (P = 0.023) is a better reflector of aerobic capacity in obese Indian males as compared to BMI, W/H ratio and %BF. Our study also pointed out that EFT (short axis) has a 13.7% independent predictability of one’s aerobic capacity.
Ethical approval
The research/study approved by the Institutional Review Board at All India Institute of Medical Sciences Raipur, number AIIMSRPR/IEC/2018/195, dated 22 September 2018.
Declaration of patient consent
The authors certify that they have obtained all appropriate patient consent.
Conflicts of interest
There are no conflicts of interest.
Use of Artificial Intelligence (AI)-Assisted Technology for manuscript preparation
The authors confirm that there was no use of artificial intelligence (AI)-assisted technology for assisting in the writing or editing of the manuscript and no images were manipulated using AI.
Financial support and sponsorship
Nil.
References
- Clinical arrhythmology and electrophysiology. (3rd ed). Netherlands: Elsevier; 2019. p. :907-24.
- [CrossRef] [Google Scholar]
- Epicardial fat: Definition, measurements and systematic review of main outcomes. Arq Bras Cardiol. 2013;101:e18-28.
- [CrossRef] [Google Scholar]
- Multiple risk factors for cardiovascular disease and diabetes mellitus. Am J Med. 2007;120(3 Suppl 1):S3-11.
- [CrossRef] [Google Scholar]
- Worldwide trends in body-mass index, underweight, overweight, and obesity from 1975 to 2016: A pooled analysis of 2416 population-based measurement studies in 128•9 million children, adolescents, and adults. Lancet. 2017;390:2627-42.
- [Google Scholar]
- Interplay between adipose tissue and blood vessels in obesity and vascular dysfunction. Rev Endocr Metab Disord. 2013;14:49-58.
- [CrossRef] [Google Scholar]
- The double role of epicardial adipose tissue as pro-and anti-inflammatory organ. Horm Metab Res. 2008;40:442-5.
- [CrossRef] [Google Scholar]
- Site-specific properties of pericardial and epicardial adipose tissue: The effects of insulin and high-fat feeding on lipogenesis and the incorporation of fatty acids in vitro. Int J Obes. 1990;14:1013-22.
- [Google Scholar]
- Waist circumference and waist-hip ratio. Available from: http://www.who.int/nutrition/publications/obesity/who_report_waistcircumference_and_waisthip_ratio/en [Last accessed on 2020 Sep 25]
- [Google Scholar]
- Body fat assessed from total body density and its estimation from skinfold thickness: Measurements on 481 men and women aged from 16 to 72 years. Br J Nutr. 1974;32:77-97.
- [CrossRef] [Google Scholar]
- Echocardiographic epicardial fat: A review of research and clinical applications. J Am Soc Echocardiogr. 2009;22:1311-418.
- [CrossRef] [Google Scholar]
- Epicardial fat thickness: A surrogate marker of coronary artery disease-assessment by echocardiography. Indian Heart J. 2016;68:336-41.
- [CrossRef] [Google Scholar]
- Visceral adiposity and arterial stiffness: Echocardiographic epicardial fat thickness reflects, better than waist circumference, carotid arterial stiffness in a large population of hypertensives. Eur J Echocardiogr. 2009;10:549-55.
- [CrossRef] [Google Scholar]
- Exercise standards for testing and training. Circulation. 2001;104:1694-740.
- [CrossRef] [Google Scholar]
- Cardiopulmonary exercise testing: A review of techniques and applications. J Anesth Clin Res. 2013;4:7.
- [CrossRef] [Google Scholar]
- ATS/ACCP statement on cardiopulmonary exercise testing. Am J Respir Crit Care Med. 2003;167:211-77.
- [CrossRef] [Google Scholar]
- Fundamentals of biostatistics: Rosner, Bernard (Bernard A.): Free download, borrow, and streaming: Internet archive. Available from: https://archive.org/details/fundamentalsofbi00bern [Last accessed on 2020 Oct 22]
- [Google Scholar]
- Norm values for VO2max. Available from: https://www.topendsports.com/testing/norms/VO2max.htm [Last accessed on 2020 Oct 07]
- [Google Scholar]
- Effect of BMI, body fat percentage and fat free mass on maximal oxygen consumption in healthy young adults. J Clin Diagn Res. 2017;11:CC17-20.
- [CrossRef] [Google Scholar]
- A simple tool to predict exercise capacity of obese patients with ischaemic heart disease. Heart. 2006;92:899-904.
- [CrossRef] [Google Scholar]
- Correlation between obesity and cardio respiratory fitness. Int J Med Sci Public Health. 2013;2:300.
- [CrossRef] [Google Scholar]
- Effect of body mass index on cardiorespiratory fitness in young healthy males. Int J Sci Res Publ. 2014;4:1-4.
- [Google Scholar]
- A study of effect of waist to hip ratio on cardio-respiratory fitness in young healthy males. J Evol Med Dent Sci. 2013;2:7658-63.
- [CrossRef] [Google Scholar]
- Total body fat does not influence maximal aerobic capacity. Int J Obes Relat Metab Disord. 2000;24:841-8.
- [CrossRef] [Google Scholar]
- A study of VO2 max and body fat percentage in female athletes. J Clin Diagn Res JCDR. 2014;8:BC01-3.
- [CrossRef] [Google Scholar]
- Evaluation of body composition and its association with cardio respiratory fitness in south Indian adolescents. Indian J Physiol Pharmacol. 2013;57:399-405.
- [Google Scholar]
- Epicardial adipose tissue thickness in young Indian overweight and obese individuals. Ann Med Health Sci Res. 2014;4(Suppl 1):S56-7.
- [CrossRef] [Google Scholar]
- Correlation of epicardial fat and anthropometric measurements in Asian-Indians: A community based study. Avicenna J Med. 2012;2:89.
- [CrossRef] [Google Scholar]
- Epicardial fat thickness correlates with body fat stores, insulin resistance and alanine aminotransferase in patients affected by non-alcoholic steatohepatitis (NASH) Nutr Ther Metab. 2010;28:137-42.
- [Google Scholar]
- Correlation of epicardial adipose tissue thickness by echocardiography with waist circumference, lipid profile, and severity of lesion by coronary angiography in patients with acute coronary syndrome. J Pract Cardiovasc Sci. 2020;6:7.
- [CrossRef] [Google Scholar]
- Effect of aerobic exercise on echocardiographic epicardial adipose tissue thickness in overweight individuals. Diabetes Metab Syndr Obes. 2018;11:303-12.
- [CrossRef] [Google Scholar]
- Aerobic exercise training reduces epicardial fat in obese men. J Appl Physiol (1985). 2009;106:5-11.
- [CrossRef] [Google Scholar]
- Epicardial adipose tissue and invasive hemodynamics in heart failure with preserved ejection fraction. JACC Heart Fail. 2020;8:667-76.
- [CrossRef] [Google Scholar]
- Echocardiographic epicardial adipose tissue is related to anthropometric and clinical parameters of metabolic syndrome: A new indicator of cardiovascular risk. J Clin Endocrinol Metab. 2003;88:5163-8.
- [CrossRef] [Google Scholar]


