
Translate this page into:
Correlation of body mass index with handgrip strength and blood pressure indices among young adults
*Corresponding author: Smrti Salim, Department of Physiology, Government Thirumala Devaswom Medical College, Alappuzha, Kerala, India. smrti91@gmail.com
-
Received: ,
Accepted: ,
How to cite this article: Salim S, Davy CR. Correlation of body mass index with handgrip strength and blood pressure indices among young adults. Indian J Physiol Pharmacol 2023;67:113-7.
Abstract
Objectives:
Hand grip strength (HGS) is an important quantitative measure to evaluate the overall muscle strength of an individual. It is affected by factors such as age, sex, body mass index (BMI) and cardiovascular risk factors such as obesity and hypertension. This study aims to find out the correlation of BMI with HGS and blood pressure indices among young adults.
Materials and Methods:
Three hundred and eighty-two medical students between the age group of 18–20 years with no history of systemic illness, musculoskeletal disorder, hand pain or deformity were selected. Informed consent was obtained. Biodata and anthropometric measurements were documented in a proforma. HGS and endurance of the dominant hand were measured using a hand-held dynamometer. Blood pressure was recorded using a mercury sphygmomanometer. Data on BMI was sub grouped into underweight, normal weight, overweight and obese participants to compare the HGS among them.
Results:
There was a statistically significant negative correlation between BMI and HGS (r = −0.513; P < 0.01), BMI and grip strength ratio (r = −0.750; P < 0.01), and between BMI and handgrip endurance (r = −0.359; P < 0.01). Statistically significant decrease in HGS was found among underweight (29.36 ± 7.01), overweight (26.18 ± 5.45) and obese participants (20.48 ± 3.12) with Kruskal–Wallis value χ2 = 14.231. Furthermore, a statistically significant positive correlation was found between BMI and systolic blood pressure (r = 0.603; P < 0.01), BMI and diastolic blood pressure (r = 0.514; P < 0.01), BMI and pulse pressure (r = 0.228; P < 0.01) and between BMI and mean arterial pressure (r = 0.572; P < 0.01).
Conclusion:
BMI was found to be negatively correlated with HGS and positively correlated with blood pressure indices. This can influence the compatibility of medical students with the physical and emotional stress of course. Determinants such as grip span, hand span, skeletal muscle bulk, and arm and calf muscle circumference are to be considered for further research to improve the endurance of young adults.
Keywords
Body mass index
Hand grip strength
Blood pressure indices

INTRODUCTION
“A sound mind in a sound body.” The English translation of a famous quotation by the pre-Socratic Greek philosopher Thales of Miletus shows the close links between physical exercise, mental equilibrium and the ability to perform and to enjoy life. Physical fitness has increasingly been recognised as an important predictor of morbidity and mortality.[1] Fast food consumption and gadgets simplifying life can lead to physical inactivity and thereby obesity in youngsters. When they become medical students, they have to do cognitive, affective and psychomotor applications appropriately for learning the vast syllabus. However, it will be impaired by their physical unfitness. Hence an assessment of physical endurance and proper guidance is necessary among the 1st year MBBS students to help their academic performance.
Body mass index (BMI) is an acceptable tool for measuring thinness and fatness and is directly linked to health risks and death rates.[2] It is a better index of body fatness compared to waist-hip ratio. Muscle strength is directly related to the functional activities and assessing muscle strength will help to identify individuals at higher risk of impaired mobility in their later life. Hand grip strength (HGS) is a quick and inexpensive way to measure an individual’s muscle strength and studies have shown that it highly correlates with the total muscle strength.[3] The previous studies have shown that increasing BMI is associated with reduced grip strength.[4] A possible explanation for this finding could be deposition of excess fat in the muscle leading to a change in the distribution of Type 1 and Type 2 muscle fibres thereby altering the muscle strength and endurance.[5]
Pre-hypertension is another condition prevalent among medical students. This could be because medical education is stressful throughout the whole course of training. The amount of material to be absorbed, social isolation, pressure of examination, and discrepancies between expectation and reality all can be anticipated to bring psychological stress.[6] Studies have shown that high BMI is also associated with increasing blood pressure in addition to declining grip strength.[7] The physiological basis for this observation could be that hand grip is an example of isometric contraction wherein tension is generated without change in muscle length. Therefore, when muscle contracts in an isometric fashion, blood flowing through the vessels and arteries get interrupted and pressure develops inside the circulatory system. If the blood pressure of the individual is already elevated, then this interruption of blood flow will affect the muscle contraction and thereby grip strength.[8]
The present study is an endeavour to assess the health status of young adults in terms of BMI and to find out whether there is any correlation between BMI with HGS and blood pressure indices. Assessment of grip strength and blood pressure indices in individuals with different BMI can be used to identify those individuals with poor muscle strength. Thus lifestyle changes such as adoption of resistance and strength training exercises at a younger age itself can improve the muscle strength and tone. Furthermore, practicing the intake of healthy nutritious diet can help in building muscle mass which, in turn, can help to improve their BP indices.
MATERIALS AND METHODS
After obtaining Institutional Research Committee and Ethics Committee approval, the study was conducted in the research laboratory of Department of Physiology, Govt. Thirumala Devaswom Medical College, Alappuzha, from November 2017 to April 2019.
Study design
Sample size was calculated using nMaster 2.0 software developed by Christian Medical College Vellore; sample size was calculated based on the study by Ravisankar et al.[9] using the formula:
Where ρ0 = population correlation coefficient which has been taken as 0.5
ρ1 = sample correlation coefficient which from the study is 0.6
Z1-α/2 = desired confidence interval (95%); α error = 5% 1–β = power (80%)
Accordingly, 382 healthy medical students of both sexes between the age group of 18–20 years were selected as study participants and a cross-sectional study was done after obtaining their written consent.
Procedure
All participants were assured that the information obtained from them would be kept confidential. Participants with history of systemic illness, musculoskeletal disorder, hand pain or deformity were excluded from the study. Data were collected on a pre-structured proforma thrice a week between 1 p.m. and 4 p.m. Height was measured using a stadiometer attached to the wall. Reading was taken in centimetres and expressed in meters. Weight was recorded using a digital platform weighing scale and expressed in kilograms with participants standing barefoot and looking straight. BMI was calculated using the formula:- BMI = Weight in kilograms/(Height in meters)2 and categorised according to the World Health Organization defined cutoff values for BMI among Asian population[2] as follows:
Underweight <18.5 kg/m2
Normal weight 18.5–23.0 kg/m2
Overweight >23–27.5 kg/m2
Obese >27.5 kg/m2
HGS and endurance of the dominant hand were measured using a hand held dynamometer. The participants were instructed to keep their dominant hand on the table with the angle in the elbow maintained at 90° and they were asked to press the handle of the dynamometer with maximum strength. The HGS was quantified in kilograms from the maximum voluntary contraction sustained for at least 3 s. Before the test each participant was given verbal instruction and demonstration of the test. Three readings were taken with brief pauses of 10–20 s and the best result was taken for analysis.
To avoid the potential bias effect of body weight on estimation of HGS, grip strength ratio was calculated from HGS and weight of the participant. In males, HGS more than or equal to 35 kg was considered as normal HGS and below 35 kg was considered as reduced HGS. In females, HGS more than or equal to 19 kg was considered as normal HGS and below 19 kg was considered as reduced HGS.[10] Hand grip endurance (HGE) was measured by asking the subject to maintain 1/3rd of maximal voluntary contraction for as long as he/she could and was expressed in seconds.
After a period of rest for about 5 min, blood pressure was recorded on the right arm in sitting posture using a mercury sphygmomanometer and expressed in millimetres of mercury. Two readings were taken at an interval of at least 5 min and the average of the two readings was used for analysis. Pulse pressure (PP) was calculated as the difference between systolic and diastolic blood pressure (DBP). Mean arterial pressure (MAP) was calculated as DBP +1/3 PP.
The data were analysed by SPSS version 17. Results were summarised in tables and figures. Comparison of variables between male and female participants was done using unpaired t-test. Comparison of variables among different BMI groups was done using one-way analysis of variance. Correlation of BMI with handgrip parameters and blood pressure indices was assessed by Pearson Correlation coefficient. Kruskal–Wallis test and Chi-square test were done to find out the statistical difference in HGS among different BMI groups. P < 0.05 was considered statistically significant.
RESULTS
Among 382 healthy medical students (159 male and 223 female students), 25 students (6%) were underweight, 187 students (49%) were normal weight, 114 students (30%) were overweight and 56 students (15%) were obese. These results demonstrate that nearly half of the participants were of normal weight, while the rest were either overweight or obese and very few participants were underweight. Out of 25 underweight participants, 44% (11) were males and 56% (14) were females. Out of 187 normal weight participants, 43% (81) were males and 57% (106) were females. Out of 114 overweight participants, 45% (51) were males and 55% (63) were females. Out of 56 obese participants, 29% (16) were males and 71% (40) were females The mean BMI among males and females were 22.83 ± 3.44 and 23.29 ± 3.64, respectively (P ≥ 0.215).
There was statistically significant difference in Handgrip parameters and Blood pressure indices among different BMI groups [Table 1]. Correlation between BMI and handgrip parameters is summarised in [Figures 1 and 2]. A statistically significant difference in HGS was found among underweight, overweight and obese participants. (χ2 = 14.231, P ≤ 0.001). Furthermore, there was a statistically significant difference in HGS between underweight and obese participants and between overweight and obese participants [Tables 2 and 3]. However, there was no statistically significant difference in HGS between underweight and overweight participants (χ2 = 3.656, P ≥ 0.056). There was significant positive correlation between BMI and all BP indices (systolic blood pressure [SBP], DBP, PP, and MAP) [Table 4].
| Variables | Underweight | Normal weight | Overweight | Obese | P-value |
|---|---|---|---|---|---|
| HGS (kg) | 29.36±7.01 | 35.11±7.65 | 26.18±5.45 | 20.48±3.12 | <0.0001 |
| GS ratio | 0.60±0.10 | 0.63±0.10 | 0.39±0.07 | 0.28±0.04 | <0.0001 |
| HGE (seconds) | 20.20±3.63 | 33.51±12.05 | 23.96±6.91 | 17.89±3.19 | <0.0001 |
| SBP (mmHg) | 108.08±8.44 | 110.12±6.45 | 118.35±4.45 | 119.79±4.24 | <0.0001 |
| DBP (mmHg) | 70.96±7.00 | 71.83±6.00 | 77.81±5.03 | 79.79±5.27 | <0.0001 |
| PP (mmHg) | 37.12±4.62 | 38.29±4.49 | 40.54±4.13 | 40.00±3.66 | <0.0001 |
| MAP (mmHg) | 83.33±7.19 | 84.59±5.78 | 91.32±4.44 | 93.12±4.64 | <0.0001 |
BMI: Body mass index, HGS: Hand grip strength, GS ratio: Grip strength ratio, HGE: Hand grip enduarance, SBP: Systolic blood pressure, DBP: Diastolic blood pressure, PP: Pulse pressure, MAP: Mean arterial pressure
| Underweight (n=25) | Obese (n=56) | Chi-square value (χ2) | P-value | |
|---|---|---|---|---|
| Reduced HGS (%) | 20% (5) | 62.5% (35) | 12.490 | <0.0001 |
| Normal HGS (%) | 80% (20) | 37.5% (21) |
BMI: Body mass index, HGS: Hand grip strength, n: Number
| Overweight (n=114) | Obese (n=56) | Chi-square value (χ2) | P-value | |
|---|---|---|---|---|
| Reduced HGS (%) | 40% (46) | 62.5% (35) | 7.385 | <0.007 |
| Normal.HGS(%) | 60% (68) | 37.5% (21) |
BMI: Body mass index, HGS: Hand grip strength, n: Number
| BMI | ||
|---|---|---|
| r-value | P-value | |
| SBP | 0.603** | 0.000 |
| DBP | 0.514** | 0.000 |
| PP | 0.228** | 0.000 |
| MAP | 0.572** | 0.000 |
BMI: Body mass index, SBP: Systolic blood pressure, DBP: Diastolic blood pressure, PP: Pulse pressure, MAP: Mean arterial pressure, **P < 0.01
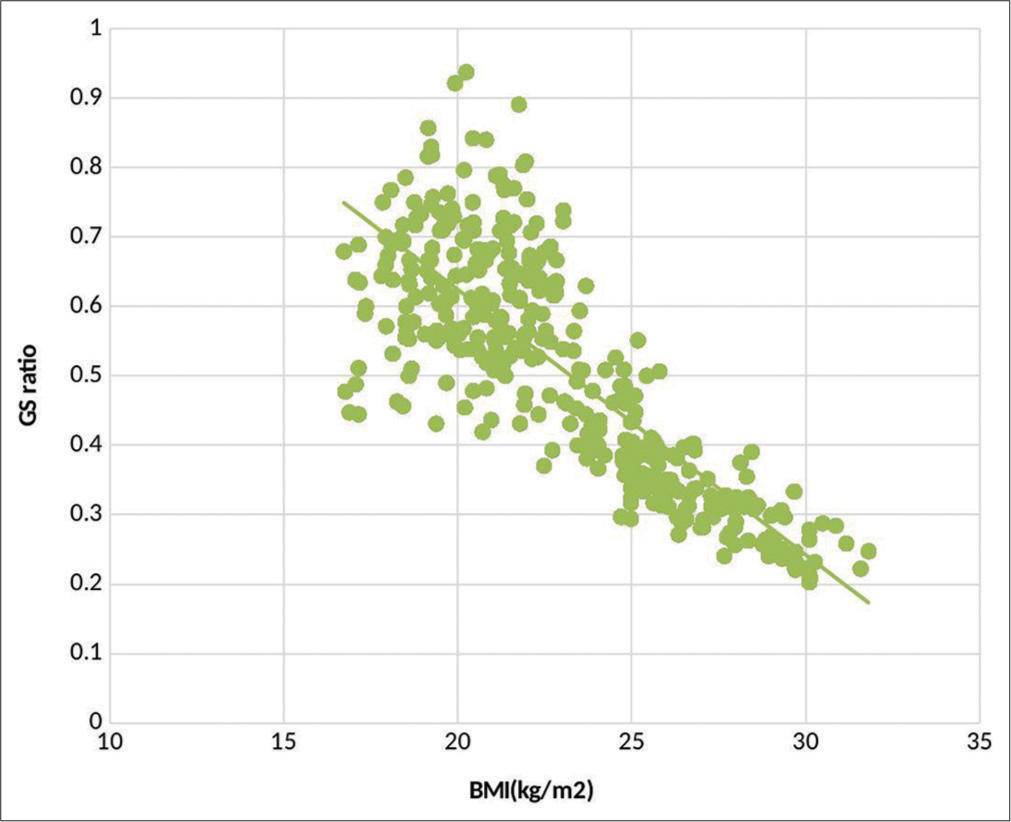
- Statistically significant negative correlation between body mass index (BMI) and grip strength (GS) ratio with Pearson correlation coefficient r = −0.750; P < 0.01.
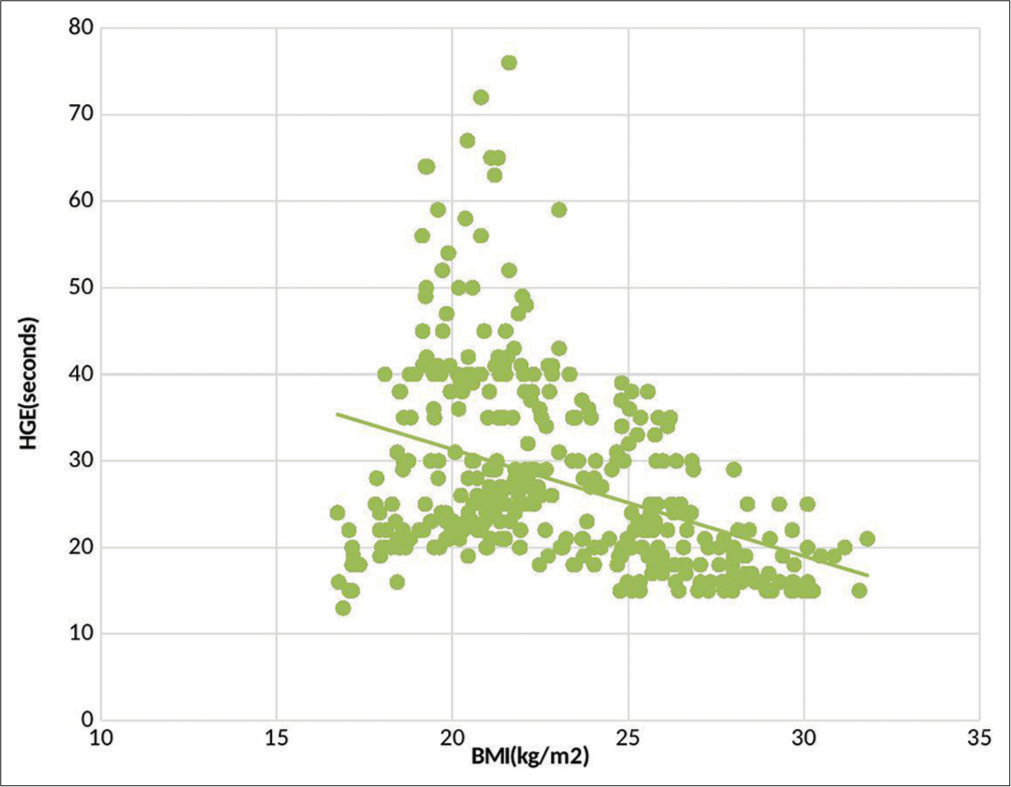
- Statistically significant negative correlation between body mass index (BMI) and Hand grip endurance (HGE) with Pearson correlation coefficient r = −0.359; P < 0.01.
DISCUSSION
The main objective of this study was to find out the correlation of BMI with HGS and blood pressure indices. The mean values of HGS went on declining from normal (35.11 ± 7.65) to overweight (26.18 ± 5.45) to obese (20.48 ± 3.12) groups. This was found to be statistically significant by Kruskal–Wallis test (χ2 =14.231, P < 0.05). A statistically significant negative correlation (r= −0.513) was seen between BMI and hand grip parameters. In the study by Thong-Ngam et al.,[11] subjects with higher BMI tended to have less muscle strength indicating the negative impact of obesity on physical performance apart from increasing the risk of various diseases. With declining physical performance, they tend to have functional limitations, to be less physically active, and will consequently gain more weight. It was found that the HGS between underweight and obese participants as well as overweight and obese participants were statistically significant. Similar results were seen in the study of Shetty et al. which suggested that physical activity hindered the accumulation of body fat and extensive use of hand and finger muscles which enable to achieve greater strength.[12]
HGE was another parameter that was found to be significantly correlated with BMI. Normal weight individuals had a higher HGE (33.51 ± 12.05) than the underweight (20.20 ± 3.63) and overweight (23.96 ± 6.91) individuals and this difference was statistically significant. Our results were in agreement with those of Bovet et al.[13] Lad et al. in their study suggested that increase in body fat percentage might decrease the HGE but not the HGS.[5]
SBP, DBP and MAP were highest in the obese (119.79 ± 4.24, 79.79 ± 5.27, 93.12 ± 4.64) participants followed by overweight participants, (118.35 ± 4.45, 77.81 ± 5.03, 91.32 ± 4.44) intermediate in normal weight (110.12 ± 6.45, 71.83 ± 6.00, 84.59 ± 5.78) participants and least in underweight participants (108.08 ± 8.44, 70.96 ± 7.00, 83.33 ± 7.19). This could be possibly due to differences in sympathetic tone between underweight and overweight participants. A study by Ahad and Nowreen also showed a positive significant correlation between BP indices and both BMI and neck circumference.[14] BMI was consistently associated with SBP and DBP in all age and gender-matched groups.[15] Ibhazehiebo et al. found both diastolic and systolic hypertension (12%) in medical students (BMI >30) that positively correlated with BMI.[16] There are also reports of isolated diastolic or systolic hypertension in obese children correlating positively with BMI.[17] A number of proposed mechanisms link obesity with sympathetic nervous system including baroreceptor dysfunction, hypothalamic-pituitary axis dysfunction, hyperinsulinemia/insulin resistance and elevated circulating angiotensin II concentrations. However, Simran and Vidushi have observed that there is impaired function of both sympathetic and parasympathetic divisions of autonomic nervous system in obese adults.[18]
CONCLUSION
Increased BMI is related to both low HGS and high blood pressure indices among young adults which is statistically proven. Hence, HGS can be used as a measure of physical endurance among young adults which is consistent with those of Bovet et al.[13] Accordingly, we can motivate them to do remedial physical fitness and yoga programmes.
Declaration of patient consent
The authors certify that they have obtained all appropriate patient consent.
Conflicts of interest
There are no conflicts of interest.
Financial support and sponsorship
Nil.
References
- Handgrip strength and blood pressure in children and adolescents: Evidence from NHANES 2011 to 2014. Am J Hypertens. 2018;31:792-6.
- [CrossRef] [PubMed] [Google Scholar]
- Appropriate body-mass index for Asian populations and its implications for policy and intervention strategies. Lancet. 2004;363:157-63.
- [CrossRef] [PubMed] [Google Scholar]
- Is grip strength a predictor for total muscle strength in healthy children, adolescents, and young adults? Eur J Pediatr. 2010;169:281-7.
- [CrossRef] [PubMed] [Google Scholar]
- Hand grip strength: Outcome predictor and marker of nutritional status. Clin Nutr Edinb Scotl. 2011;30:135-42.
- [CrossRef] [PubMed] [Google Scholar]
- A study on the correlation between the body mass index (BMI), the body fat percentage, the handgrip strength and the handgrip endurance in underweight, normal weight and overweight adolescents. J Clin Diagn Res. 2013;7:51-4.
- [CrossRef] [PubMed] [Google Scholar]
- Prevalence of overweight and obesity among students of a medical college in South India: A pilot study. Indian J Clin Pract. 2014;25:333-7.
- [Google Scholar]
- The association between blood pressure and grip strength in adolescents: Does body mass index matter? Hypertens Res. 2016;39:919-25.
- [CrossRef] [PubMed] [Google Scholar]
- Exercise Physiology (5th ed). Philadelphia, PA: Lippincott Williams and Wilkins; 2001. p. :506-7.
- [Google Scholar]
- Correlation between body mass index and blood pressure indices, handgrip strength and handgrip endurance in underweight, normal weight and overweight adolescents. Indian J Physiol Pharmacol. 2005;49:455-61.
- [Google Scholar]
- Body mass index and percentage of body fat determined physical performance in healthy personnel. Asian Biomed. 2012;6:313-8.
- [Google Scholar]
- Influence of various anthropometric parameters on handgrip strength and endurance in young males and females. Int J Biol Med Res. 2012;3:2153-7.
- [Google Scholar]
- Strong inverse association between physical fitness and overweight in adolescents: A large school-based survey. Int J Behav Nutr Phys Act. 2007;4:24.
- [CrossRef] [PubMed] [Google Scholar]
- Prevalence of prehypertension among medical students and its correlation with anthropometric indices. Int J Med Sci Public Health. 2018;7:1018-22.
- [CrossRef] [Google Scholar]
- Weight loss improves neurovascular and muscle metaboreflex control in obesity. Am J Physiol Heart Circ Physiol. 2003;285:H974-82.
- [CrossRef] [PubMed] [Google Scholar]
- Hypertension, and blood pressure response to graded exercise in young obese and non-athletic Nigerian university students. Niger J Physiol Sci. 2007;22:37-42.
- [CrossRef] [PubMed] [Google Scholar]
- Relationship between body composition and blood pressure in Bahraini adolescents. Br J Nutr. 2003;90:837-44.
- [CrossRef] [PubMed] [Google Scholar]


