
Translate this page into:
Derangement of metabolic homeostasis, detoxifying ability and CA 15-3 in young adult female rats by fructose (15%) drinking is akin to known carcinogens: A missed fiend?
*Corresponding author: Rajani Mathur, Department of Pharmacology, Delhi Institute of Pharmaceutical Sciences and Research, DPSRU, New Delhi, India. mathurajani@gmail.com
-
Received: ,
Accepted: ,
How to cite this article: Kaur A, Prasad C, Mathur S, Mathur R. Derangement of metabolic homeostasis, detoxifying ability and CA 15-3 in young adult female rats by fructose (15%) drinking is akin to known carcinogens: A missed fiend? Indian J Physiol Pharmacol 2023;67:163-71.
Abstract
Objectives:
Breast cancer (BC) has been the bane of peri-and post-menopausal women, but is now increasingly incident in adolescent/young adult (AYA) females. Pari-passu, there has been a >1000% increase in consumption of fructose as a caloric sweetener in soft drinks, whose top consumers are AYAs. The link between fructose consumption and mammary gland (MG) carcinogenesis is not well-established and the same is investigated and compared against known carcinogens such as 7,12-dimethylbenz(a)anthracene (DMBA) and electromagnetic radiations from mobile phone (EMF-MP).
Materials and Methods:
Weaned female Wistar rats were randomly grouped as normal control (NOR), fructose control (FRC), DMBA control (DMC), and exposure control (EXC). For 8 weeks, the NOR was provided chow and water, ad libitum, while FRC, DMC, and EXC additionally received 15% fructose drinking solution, ad libitum, DMBA (20 mg/Kg, p.o; at weaning) and EMF-MP (Global System for Mobile Communications [GSM]), 2 h/day daily), respectively. At the end of the study, the groups were compared for the biomarkers of insulin resistance (IR), carbohydrate and lipid metabolism, liver function, cardiometabolic function, oxidative stress, and MG carcinogenesis.
Results:
The serum markers of MG carcinogenesis (CA 15–3), IR (homeostasis model assessment-IR, area under the curve – oral glucose tolerance test), and liver and cardiometabolic function (serum glutamicoxaloacetic transaminase and homocysteine) were significantly raised (P < 0.05) in FRC versus NOR. The metabolic homeostasis (leptin, ghrelin, triglyceride-Glucose index, glucose-6-phosphatase, triglyceride, high-density lipoprotein, serum glutamic pyruvic transaminase, alkaline phosphatase, and glycogen) and detoxifying ability (free-radical scavenging activity [%] and superoxide dismutase) in FRC were not different from DMC, or EXC.
Conclusion:
The development of early indicators of MG carcinogenesis due to unhindered fructose drinking by AYA female rats is akin to exposure to DMBA or EMF-MPs that evidence the propensity of the former.
Keywords
Mammary gland carcinogenesis
Adolescent/young adults
Fructose
7,12-dimethylbenz(a)anthracene
Electromagnetic field from a mobile phone
Insulin resistance

INTRODUCTION
Globally, breast cancer (BC) is the most frequently diagnosed cancer and a common cause of cancer-related death. It is no longer restricted to the peri-and post-menopausal age group, and in fact, 7% of the BC are seen in women who are adolescent/young adults (AYAs) under 40 years.[1,2]
The 7,12-dimethylbenz(a)anthracene (DMBA), a polyaromatic hydrocarbon, is tumour initiator (IARC group I carcinogen) and a risk factor for BC among women, and adolescents.[3,4] Exposure to electromagnetic field radiations from mobile phones (EMF-MP) has also been implicated in the pathogenesis of BC.[5] Pari-passu, there has been a >1000% increase in consumption of fructose as a caloric sweetener in soft drinks, whose top consumers are AYAs.[6,7]
Recently, preliminary reports indicate that a fructose-laden diet could be a risk factor, for triple-negative BC in AYAs, although concrete evidence is lacking.[8]
It is well-understood that impaired metabolism and insulin resistance (IR) are central to carcinogenesis, especially BC. Pre-clinical and clinical studies have implicated exposure to DMBA and EMF-MP with the pathogenesis of IR and metabolic derangements as demonstrated by impaired secretary actions of pancreatic beta cells, hepatic insulin signalling, triglyceride (TG) metabolism, de novo lipogenesis, hepatic inflammation, visceral adiposity, type-II-diabetes mellitus, fatty liver, and obesity.[9-11] Furthermore, obesity is known to promote DMBA-mediated mammary gland (MG) carcinogenesis in premenopausal women.[12]
Although fructose-rich diet is clearly correlated with the pathogenesis of IR, its role in MG carcinogenesis has neither been considered nor investigated. Natural fructose in fruits and honey has been consumed by humans since time immemorial. Alarmingly, in the last five decades, the mean fructose intake per person has surged by more than 32% in the guise of confectionaries, colas, beverages, juices, candies, pastries, etc.[13] On the one hand, the AYAs are the compulsive consumers of a fructose-rich diet, while, on the other hand, they are facing an increased incidence of BC.[14] A systematic investigation is warranted to understand the correlation between fructose consumption the MG carcinogenesis in AYAs, if any.
To address the paucity of data, the present study was designed, wherein, weaned female Wistar rats were challenged with either fructose (15% as drinking solution), EMF-MP (GSM, 2 h/day × 8 weeks), or DMBA (20 mg/Kg p.o. single dose at weaning) and assessed for paradigms of carbohydrate and lipid metabolism and MG carcinogenesis. This pioneering pre-clinical study highlights that the markers of MG carcinogenesis in AYA female rats are skewed due to a fructose-rich diet akin to known carcinogens such as DMBA or EMF-MP, and paves the way for future clinical studies.
MATERIALS AND METHODS
Animals
Wistar albino rats (female, 28 days old, 45–55 g) were housed in a standard pathogen-free environment at an in-house Animal Facility. The study was approved by the Institutional Animal Ethics Committee (IAEC/2018-I/Prot.No. 02 dated October 29, 2018) on and conducted in compliance with the guidelines laid down by the Committee for the Purpose of Control and Supervision of Experiments on Animals.
Experimental design
The rats were allocated to four groups (n = 6), that is, normal control (NOR), fructose control (FRC), DMBA control (DMC) and exposure control (EXC) using the method of minimisation based on sex, weight and age. The NOR was provided a standard pellet diet (RRD Enterprises, Pune) and filtered drinking water, ad libitum, whereas, FRC additionally received fructose (15%), ad libitum. In addition to standard conditions, DMC received DMBA (20 mg/Kg in sesame oil, p.o, single dose at weaning) and EXC was exposed to EMFMP (GSM, 2 h/day, for 8 weeks).
Exposure to EMF radiations from mobile phone
The exposure chamber consisted of a ventilated (2 mm diameter holes) plexiglas cage that could comfortably hold one animal at a time. On top of the chamber, a platform was tied to a pulley through string and its movement was controlled by a stepper motor which was programmed to undergo angular movement (45o). For the exposure duration (2 h/day × 8 weeks), an animal from the EXC group was placed in the chamber and the mobile phone (1760 MHz, 0.3988 mW/cm2, GSM, specific absorption rate 0.217 W/Kg) in ‘switched-on mode’ was placed on the platform that cyclically underwent angular motion.[15,16]
Food, water/fructose solution (15%), body weight, and total calorie intake
Parameters such as food intake and water/fructose solution (15%) intake were recorded by weighing the leftover portion from the pre-weighed amount and body weight, which were recorded daily using the sensitive digital weighing balance over the period of 24 h. The total calorie (=Kcal metabolising energy from feed+Kcal metabolising energy from fructose solution (15%) intake) of each group over the study duration was calculated.[17]
Fasting blood glucose (FBG)
Every week, following 12 h food but not water deprivation, the tail of the animals was pricked to measure the blood glucose concentration using the digital glucometer (Accu Chek Active, Roche, USA).
Oral glucose tolerance test (OGTT) and insulin tolerance test (ITT)
After study completion, the OGTT was conducted. The fasted rats (12 h) were force-fed glucose (2 g/kg, p.o.) and the blood glucose concentration was repeatedly recorded at 0, 30, 60, 90, 120, and 180 min post-administration.[18]
At the end of the study, the ITT was conducted by administering regular human insulin (0.75 IU/kg, s.c., Huminsulin R, Eli Lilly, and Company India Pvt., Ltd.) to 12 h fasted rats, as described elsewhere.[18]
Blood collection
At the end of the study, the animals were anaesthetised (Ketamine hydrochloride 80 mg/kg, i.p.) and the blood was collected by cardiac puncture.
Visceral weight
Still, under anaesthesia, the animals were perfused with phosphate-buffered saline (0.1 M, pH 7.4), and the viscera and MGs were excised, washed dried, weighed, and stored (−20°C).
Biochemical assessment
Insulin, homeostatic model assessment- estimated insulin resistance (HOMA-IR) index, leptin, ghrelin, and homocysteine (Hcy)
The serum levels of insulin, leptin, ghrelin, and Hcy were measured using the commercially available kit (Elabscience, USA), and the HOMA-IR was calculated (= glucose level (mgdL−1) × insulin/405).[17]
Tumour marker-CA 15-3
The tumour marker CA 15-3 was measured in the serum using a solid-phase enzyme-linked immunosorbent (MyBioSource, USA) assay.
Lipid profile
The lipid profile, that is, total cholesterol, TGs, and high-density lipoprotein (HDL) was measured using commercially available kits in accordance with the manufacturer’s method (Diaspertz, Microlyn Healthcare Pvt. Ltd. India).
Hepatic enzymes
The hepatic enzymes, that is, serum glutamic-oxaloacetic transaminase (SGOT), serum glutamic pyruvic transaminase (SGPT), and alkaline phosphatase (ALP) were measured using commercially available colorimetric kits in accordance with the manufacturer’s method (Diaspertz, Microlyn Healthcare private Ltd. India).
Triglyceride-glucose index (TyG Index) measurements
TyG index was calculated using the formula: Ln (fasting TG [mg/dL] × fasting serum glucose [mg/dL]/2). The index value of 4.49 or greater is suggestive of IR with a likely diagnosis of non-alcoholic fatty liver disease (NAFLD) and proportionally increased risk of BC in female rats.[19]
Glycogen and carbohydrate metabolism enzymes
The hepatic glycogen was estimated as per the standard anthrone test.[20] The activities of the enzymes of the carbohydrate metabolism, that is hexokinase, phosphofructokinase (PFK), and glucose-6-phosphatase (G6Pase) were estimated in the MG using ultravioletspectrophotometric biochemical assays.[21-23]
Oxidative stress
The sections of hepatic and MG were homogenised (10% w/v in potassium phosphate buffer, 0.1 M, pH 7.4) to estimate the concentration of the reduced glutathione.[24] The homogenate thus obtained was centrifuged at 15,000 rpm and the debris-free clear supernatant was used for the estimation of superoxide dismutase (SOD), catalase, and protein using a UV spectrophotometer.[24]
Histopathological analysis
The MG from the right inguinal regions was formalin-fixed (10%), paraffin-embedded, sectioned (5 mm), and stained (H&E) for morphological evaluation. The glands were evaluated to analyse any neoplastic changes in histoarchitecture such as terminal duct lobule, fatty tissue (F), terminal ducts, ductal epithelial cells (DEC), and myoepithelial cells (MC) surrounding basement membrane (BM).
Statistical analysis
All the values are expressed as mean±SEM; (n = 6), two-way analysis of variance (ANOVA) followed by Bonferroni post-test is applied for comparison between groups in case of physiological parameters, that is, body weight, water/fructose, and food intake over 8 weeks study. The biochemical data were analysed using one-way ANOVA followed by Dunnett’s multiple comparison tests versus NOR and FRC. P ≤ 0.05 was considered statistically significant. The statistical analysis was done using GraphPad Prism ver 5.0.
RESULTS
Effect of fructose intake, DMBA, and EMF-MP on, food, water/fructose intake body weight, and total calorie intake
The food, water/fructose intake, and body weight were measured daily and the weekly average was calculated for analysis. The food intake by FRC was significantly less (P < 0.001) than NOR, DMC, and EXC. The body weight of FRC was significantly lower (P < 0.05) than NOR, DMC, and EXC in the 3rd and 4th week, but increased thereafter. The FRC derived about 24% of its total calories by drinking fructose and 62% from the standard chow diet [Figure 1].
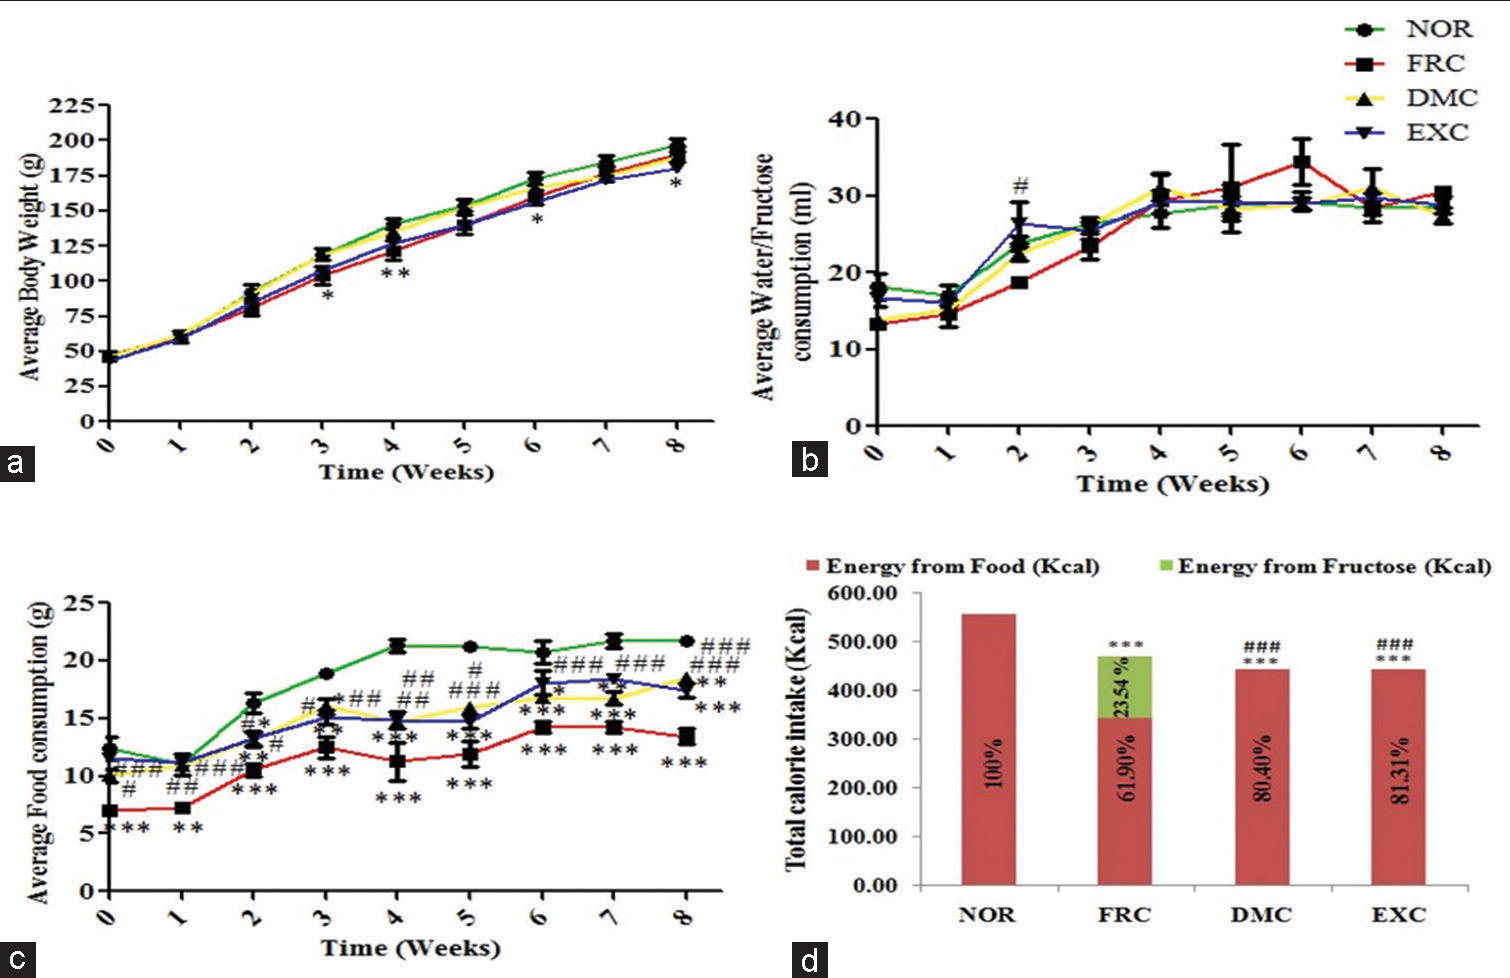
- Physiological parameters (a) body weight, (b) water/fructose intake, (c) food intake, and (d) calorie intake. The average body weight and food intake were significantly less in FRC versus NOR, DMC, and EXC and fructose consumption increased from the 5th week onwards. Values are expressed as mean±SEM, (n* = 6), analysed using two-way repeated measures analysis of variance (RM ANOVA) followed by Bonferroni post-test to compare replicate means by row. *P < 0.05, **P < 0.01 and ***P < 0.001 versus NOR, #P < 0.05, ##P < 0.01 and ###P < 0.001 versus FRC was considered as significant. NOR: Normal control, FRC: Fructose control, DMC: 7,12-dimethylbenz(a)anthracene (DMBA) control, EXC: Exposure control, SEM: Standard error of the mean, RM ANOVA: Repeated measures analysis of variance, *: Sample size.
Effect of fructose intake, DMBA, and EMF-MP on FBG, OGTT, and ITT
The weekly FBG of DMC was 83.83 ± 4.19, 95.50 ± 2.14, 79.17 ± 6.34, and 88.00 ± 2.96 mg/dL, during 2nd, the 3rd and 4th week of the study, respectively, significantly higher than NOR, FRC and EXC [Figure 2a].
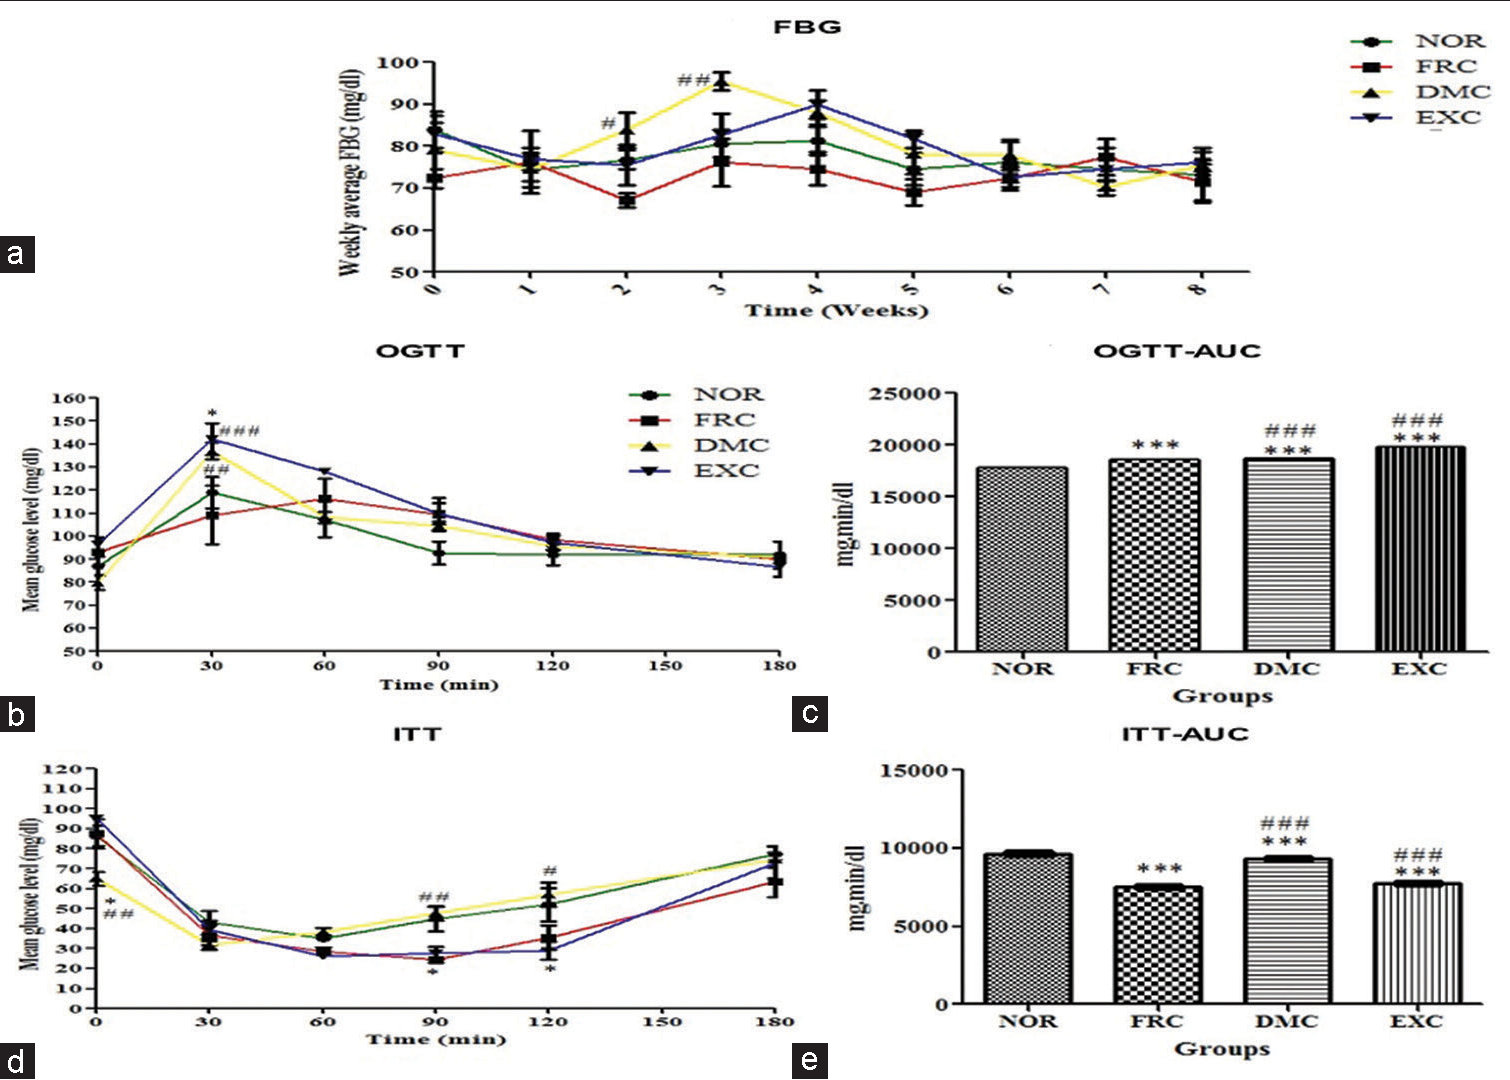
- Blood glucose levels (a) FBG, (b) OGTT, (c) OGTT-AUC, (d) ITT and (e) ITT-AUC. The AUC-OGTT was higher in FRC, DMC, and EXC groups vs NOR and vice versa in the case of AUCITT. Values are expressed as mean±SEM, (n* = 6) where *P < 0.05, **P < 0.01 and ***P < 0.001 versus NOR, #P < 0.05 ,##P < 0.01 and ###P < 0.001 versus FRC, was considered significant. AUC was calculated using XY analysis and time interval comparison was analysed using two-way repeated measures analysis of variance (RM ANOVA). FBG: Fasting blood glucose, OGTT: Oral glucose tolerance test, ITT: Insulin tolerance test, AUC: Area under the curve, NOR: Normal control, FRC: Fructose control, DMC: 7,12-dimethylbenz(a)anthracene (DMBA) control, EXC: Exposure control, SEM: Standard error of the mean, RM ANOVA: Repeated measures analysis of variance, *:sample size.
In the OGTT, the mean blood glucose level at T = 30 min, of DMC and EXC was 137 ± 3.64 and 142.25 ± 6.80 mg/dL, respectively, that was significantly (P < 0.05) higher than NOR and FRC [Figure 2b]. The OGTT area under the curve (AUC) of FRC, DMC, and EXC was significantly greater (P < 0.001) than that of NOR [Figure 2c].
In ITT, the mean blood glucose level at T = 0 min, of DMC was 31.67 ± 2.16 mg/dL that was significantly lower (P < 0.05) than NOR, FRC, and EXC [Figure 2d]. The AUC-ITT of FRC was significantly lower (P < 0.05) than that of NOR, DMC, and EXC [Figure 2e].
Effect of fructose intake, DMBA, and EMF-MP on biochemical parameters
At the end of the study, the FRC serum levels of insulin were raised. The values of HOMA-IR, Hcy, and SGOT were significantly higher in FRC versus NOR (P < 0.05). The SGPT, ALP, leptin, ghrelin, CA 15-3, and TG were raised and the serum HDL levels were significantly less (P < 0.001) in FRC versus NOR [Table 1].
Effect of fructose intake, DMBA, and EMF-MP on TyG index
At the end of the study, the calculated TyG Index in NOR, FRC, DMC, and EXC was 4.117 ± 0.164, 4.740 ± 0.149, 4.693 ± 0.111 and 4.550 ± 0.203, respectively.
Effect of fructose intake, DMBA, and EMF-MP on tissue glycogen and carbohydrate metabolism enzymes
The hepatic glycogen and G6Pase activity in the MG of DMC was significantly greater (P < 0.05) versus NOR [Table 1]. The PFK activity in FRC was not different from DMC and EXC.
Effect of fructose intake, DMBA, and EMF-MP on oxidative stress
The levels of SOD and % FRS were significantly less (P < 0.05) in FRC versus NOR [Table 2].
Effect of fructose intake, DMBA and EMF-MP on histopathology of MG
The histoarchitecture of sections of MG from NOR, FRC, DMC and EXC showed normal lobular structure (L), and ducts (D) lined by DEC and surrounded by MC in BM and F. In FRC, the sections of MGs were in the lobular stage while that of EXC appeared to be in the ductal stage as compared to the alveolar bud stage in NOR. There was no evidence of neoplasm in the histopathology of either NOR, FRC, DMC or EXC (×10) [Figure 3].
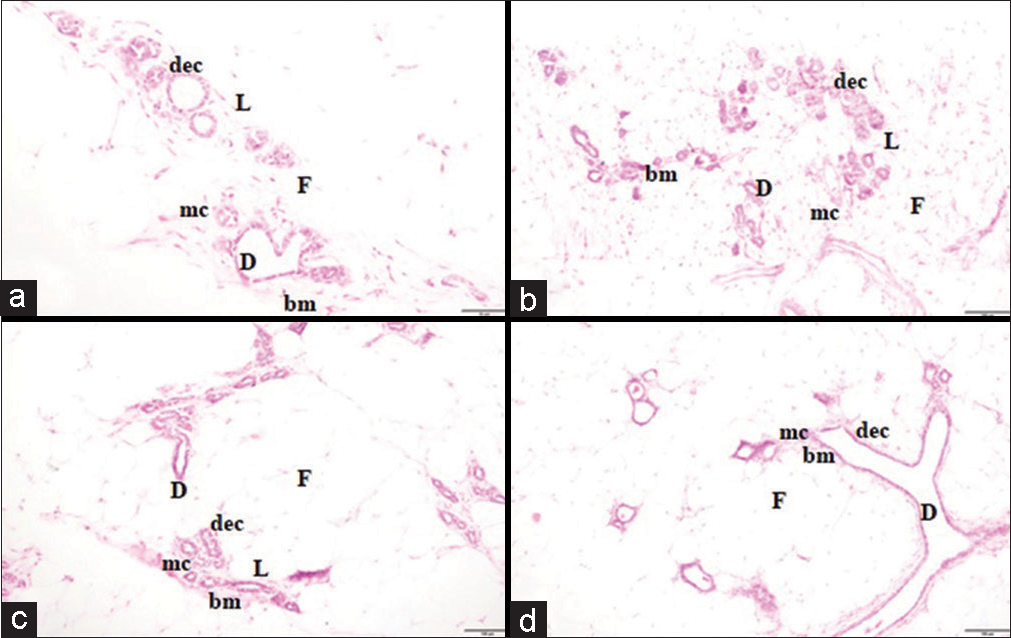
- Histopathology (a) NOR, (b) FRC, (c) DMC, and (d) EXC group. The mammary tissue of (a) NOR (alveolar bud stage), (b) FRC (lobular stage), (c) DMC (alveolar bud stage), and (d) EXC (ductal stage) group shows the normal lobular structure (L), ducts (D) and fatty tissue (F) with no evidence of neoplasm (×10). NOR: Normal control, FRC: Fructose control, DMC: DMBA control, EXC: Exposure control, DEC: Ductal epithelial cells, MC: myoepithelial cells.
| Parameters | NOR | FRC | DMC | EXC |
|---|---|---|---|---|
| Insulin (ng/mL) | 0.68±0.004 | 0.70±0.004 | 0.60±0.01***### | 0.61±0.004***### |
| HOMA-IR | 0.12±0.01 | 0.14±0.01* | 0.11±0.002## | 0.12±0.001# |
| LEP (ng/mL) | 2.50±0.08 | 2.92±0.12 | 2.10±0.12# | 2.31±0.30 |
| GHR (pg/mL) | 0.33±0.02 | 0.40±0.01 | 0.47±0.03* | 0.40±0.04 |
| Hcy (pg/mL) | 0.86±0.01 | 0.92±0.01* | 1.05±0.02***## | 0.95±0.02** |
| CA 15-3 U/mL | 1.21±0.05 | 1.48±0.10 | 0.64±0.32 | 0.22±0.02*# |
| TC (mg/dL) | 134.51±6.78 | 122.70±5.52 | 86.40±2.42**## | 72.60±7.48***## |
| TG (mg/dL) | 64.75±13.34 | 182.85±61.00 | 168.07±34.28 | 139.70±59.36 |
| HDL (mg/dL) | 26.42±0.82 | 3.96±0.93*** | 11.18±1.04***## | 5.97±0.40*** |
| SGOT (IU/L) | 94.30±29.47 | 218.05±21.25** | 200.37±15.60* | 194.48±17.70* |
| SGPT (IU/L) | 64.83±11.80 | 88.40±10.21 | 94.30±15.60 | 94.30±5.90 |
| ALP (IU/L) | 73.44±9.80 | 98.46±16.17 | 130.02±12.13 | 139.81±24.54* |
| Glycogen (ng/mg) | 0.98±0.01 | 1.14±0.02 | 0.92±0.08# | 1.01±0.02 |
| HK (µmoL of NADH formed/min/mg protein) | 0.28±0.05 | 0.25±0.04 | 0.25±0.02 | 0.23±0.01 |
| PFK (µmoL of NADH formed/min//mg protein) | 1.44±0.14 | 1.40±0.11 | 1.42±0.11 | 1.60±0.26 |
| G-6Pase (µmoL of phosphate liberated/min/mg protein) | 1.60±0.26 | 2.64±0.45 | 4.22±0.67* | 3.55±0.54 |
Values are expressed as mean±standard error mean (SEM), (n*=3), *P<0.05, **P<0.01 and ***P<0.001 versus NOR, #P<0.05 , ##P<0.01 and ###P<0.001 versus FRC, analysed using One-way RM ANOVA followed by Dunnett’s multiple comparison test. Glycogen values are expressed as glucose equivalents, NOR: Normal control, DMC: DMBA control, FRC: Fructose control, EXC: Exposure control, LEP: Leptin, GHR: Ghrelin, Hcy: Homocysteine, CA: Cancer antigen, TC: Total cholesterol, TG: Triglyceride, HDL: High-density lipoprotein SGOT: Serum glutamic-oxaloacetic transaminase, SGPT: Serum glutamic pyruvic transaminase, ALP: Alkaline phosphatase, HK: Hexokinase, PFK: Phosphofructokinase, HOMA-IR: Homeostatic model assessment-estimated insulin resistance index, NADH: Nicotinamide adenine dinucleotide reduced, G-6Pase: Glucose 6-phosphatase, *sample size, RM ANOVA: Repeated measures analysis of variance
| Parameters | Liver | Mammary gland | ||||||
|---|---|---|---|---|---|---|---|---|
| NOR | FRC | DMC | EXC | NOR | FRC | DMC | EXC | |
| Tissue weight (g) | 8.30±0.70 | 7.33±0.28 | 5.47±0.34***## | 5.97±0.33*# | 2.15±0.11 | 1.55±0.03** | 1.90±0.16 | 1.41±0.18** |
| GSH (µmoL GSH/g liver tissue) |
306.03±65.76 | 222.03±5.66 | 325.60±59.38 | 428.17±25.41# | 423.37±60.20 | 354.90±7.81 | 478.05±75.60 | 564.17±19.91# |
| CAT(mM of H2O2degraded/mg of protein) | 33.31±8.40 | 18.94±7.12 | 40.85±24.78 | 40.87±10.31 | 165.10±1.92 | 143.90±6.98 | 130.15±2.62** | 113.51±7.90***# |
| SOD (IU/mg protein) |
8.80±0.37 | 4.93±0.75* | 6.50±0.98 | 5.65±0.58* | 162.10±33.50 | 62.77±17.10* | 66.57±4.70* | 40.56±9.63** |
| %Free radical scavenging | 72.90±1.96 | 39.55±3.44** | 53.67±7.35* | 48.60±3.96* | 38.33±6.67 | 23.33±4.41 | 23.33±3.33 | 13.33±3.33* |
Values are expressed as mean±standard error mean (SEM), (n*=3), *P<0.05, **P<0.01 and ***P<0.001 versus NOR, #P<0.05, ##P<0.01 and ###P<0.001 versus FRC, analysed using one-way RM ANOVA followed by Dunnet’s Multiple comparison test. NOR: Normal control, FRC: Fructose control, DMC: DMBA control, EXC: Exposure control, GSH: Glutathione reduced, CAT: Catalase, SOD: Superoxide dismutase, H2O2: Hydrogen peroxide, *sample size, RM ANOVA: Repeated measures analysis of variance
DISCUSSION
The present-day AYAs are oblivious to the menace posed by the unrestricted consumption of fructose-based diet on their health and the present study evidences that its deleterious effects are no less than those posed by either DMBA or EMF-MP. To dispel the paucity of substantive correlative data, the present study simulated the condition in developing female rats and compared the propensity of ingesting unlimited fructose (15%) to derange the mechanisms involved in the MG carcinogenesis and its risk stratification against DMBA and EMF-MP.
Here, we report that ingesting unlimited fructose (15%) during adolescence had a greater propensity than pubertal exposure to either DMBA or EMF-MP to raise circulating levels of CA15-3, leptin, ghrelin, Hcy, and insulin. On the other hand, the food intake, calorie intake, body weight, glucose tolerance, and insulin sensitivity were reduced by ingesting fructose (15%) akin to DMBA and EMF-MP. Further, the raised activities of G6Pase, glycogen destocking, and hypertriglyceridemia proportionately reduce the HDL levels and perturb the liver function. The development of the state of IR was confirmed by raised indices of HOMA-IR in FRC and TyG in all three FRC, DMC, and EXC.
The present study indicates that when the weanlings were provided unrestricted access to fructose (15%) during adolescence, they underwent a metabolic reprogramming toward IR and MG carcinogenesis, by early adulthood. The unrestricted intake of fructose (15%) solution by FRC significantly reduced (P < 0.001) preference for conventional chow diet to 62%, but the total calories consumed were significantly higher (P < 0.001) Kcal than that consumed by DMBA or EMF-MPs. As compared to DMBA and EMF-MPs, the HOMA-IR and Hcy of FRC were significantly higher (P < 0.05). The impaired glucose tolerance in FRC, DMBA and EMF-MPs underlies IR as the common pathway for initiating MG carcinogenesis, irrespective of the causative insult. Golbahar et al. studied the association between Hcy levels and IR in an in vivo study and concluded that hyperhomocysteinaemia induces IR.[25] Kallamadi et al. concluded in their study that impaired glucose tolerance or pre-diabetes increase the risk of BC development.[26] According to similar findings by Emam et al., higher levels of CA 15-3 with fructose (51%) consumption clearly associate the role of this natural sweetener in commencing metabolic events favouring the development of mammary carcinogenesis.[27] Hypertriglyceridemia and high liver enzymes (SGOT and SGPT) have been correlated with NAFLD and IR, which are in consonance with present findings.[28] In comparison to NOR, the DMBA, EMF-MPs, and FRC had high TyG indices. As previously established, the indices of IR, such as the TyG index, are closely associated with the risk of MG carcinogenesis in young females.[29]
Further, the fructose-drinking inflicted prominent oxidative damage generated ROS, and retarded the activities of antioxidant enzymes present in the liver and MG. It may be postulated that the metabolic reprogramming entailed insulin insufficiency, triggered incomplete α oxidation in mitochondria, and generated ROS that may have initiated the pathogenesis of BC.[30] Lewis et al. have reported that women with IR may have slightly elevated levels of circulating estradiol, which may raise their chance of developing BC. IR, on the other hand, heightens oxidative stress in breast tissue and may encourage carcinogenesis through oxidative DNA damage.[31] Studies are ongoing in our laboratory to further corroborate the underlying pathogenesis.
EMF-MP and DMBA are known genotoxic stressors that have also been reported to cause metabolic reprogramming, perturbations in health markers, and MG carcinogenesis, but their propensity increases exponentially when the animals are repeatedly exposed at mature age for chronic duration.[32-34] In sharp contrast, the evidence presented, here, indicates that the ingestion of fructose (15%) during pre-, peri- and post-puberty, derange homeostasis and initiates disease pathogenesis by early adulthood.
For the 1st time, this study pins the role of neuropeptidergic signal-leptin as an early, direct, and independent beacon that can be developed to call out potential cases of MG carcinogenesis. It is an adipocytokine, secreted by mammary epithelial tissue and positively associated with changes in body weight. Considerably higher levels of leptin and ghrelin but significantly lower (P < 0.05) body weight until puberty in FRC need to be highlighted. The role of hyperinsulinaemia and hyperleptinaemia in MG carcinogenesis is being accepted globally.[35-37]
The study investigates the early metabolic events initiated in AYAs by known carcinogens such as DMBA and EMFMP for a better understanding of the disease initiation. Interestingly, IR emerges as a common pathway towards MG carcinogenesis, and incessant consumption of fructose (15%) induced a tougher onslaught on metabolic milieu (TyG) than either DMBA or EMF-MP.
The study is the first of its type and shows how the IR and metabolic derangement caused by fructose (15%) administration increases the risk of MG carcinogenesis in AYAs. The findings, further, highlight the importance of profiling IR while screening BC in AYAs.
CONCLUSION
This study provides evidence that fructose (15%) drinking by adolescent female rats-initiated insulin and leptin resistance, raised lipolysis, glycogen levels, gluconeogenesis, oxidative stress, TyG, and CA15-3 by early adulthood akin to DMBA and EMF-MP.
Acknowledgment
The research was funded by the Indian Council of Medical Research (ICMR)-Extramural and AICTE-NDF-2018, which the authors gratefully acknowledge.
Declaration of patient consent
The authors certify that they have obtained all appropriate consent.
Conflicts of interest
There are no conflicts of interest.
Use of artificial intelligence (AI)-assisted technology for manuscript preparation
The author(s) confirms that there was no use of artificial intelligence (AI)-assisted technology for assisting in the writing or editing of the manuscript and no images were manipulated using AI.
Financial support and sponsorship
The Indian Council of Medical Research (ICMR)-Extramural (Sanction No. 5/10/FR/71/2020RBMCH) and AICTENDF-2018 provided financial support for this work.
References
- Breast cancer in adolescent and young adult women under the age of 40 years. JCO Oncol Pract. 2021;17:305-13.
- [CrossRef] [PubMed] [Google Scholar]
- Breast cancer in adolescents and young adults. Pediatr Blood Cancer. 2018;65:e27397.
- [CrossRef] [PubMed] [Google Scholar]
- Mammary tumour induction in animals as a model for human breast cancer In: Alison MR, ed. The cancer handbook. Philadelphia, PA: John Wiley & Son's Ltd.; 2005. p. :1-11.
- [CrossRef] [Google Scholar]
- Exposure to polycyclic aromatic hydrocarbons during pregnancy and breast tissue composition in adolescent daughters and their mothers: A prospective cohort study. Breast Cancer Res. 2022;24:47.
- [CrossRef] [PubMed] [Google Scholar]
- Multifocal breast cancer in young women with prolonged contact between their breasts and their cellular phones. Case Rep Med. 2013;2013:354682.
- [CrossRef] [PubMed] [Google Scholar]
- Adolescent high-fructose corn syrup consumption leads to dysfunction in adult affective behaviors and mesolimbic proteins in male Sprague-Dawley rats. Behav Brain Res. 2022;419:113687.
- [CrossRef] [PubMed] [Google Scholar]
- Consumption of high-fructose corn syrup in beverages may play a role in the epidemic of obesity. Am J Clin Nutr. 2004;79:537-43.
- [CrossRef] [PubMed] [Google Scholar]
- Dietary fructose consumption and triple-negative breast cancer incidence. Front Endocrinol (Lausanne). 2019;10:367.
- [CrossRef] [PubMed] [Google Scholar]
- Fructose and hepatic insulin resistance. Crit Rev Clin Lab Sci. 2020;57:308-22.
- [CrossRef] [PubMed] [Google Scholar]
- Effect of the electromagnetic field radiation of cell phones on the level of blood glucose in rats. IJNSCFRT. 2021;12:17-23.
- [Google Scholar]
- Obesity promotes 7,12-dimethylbenz(a) anthracene-induced mammary tumor development in female zucker rats. Breast Cancer Res. 2005;7:R627-33.
- [CrossRef] [PubMed] [Google Scholar]
- Obesity and breast cancer in premenopausal women: Current evidence and future perspectives. Eur J Obstet Gynecol Reprod Biol. 2018;230:217-21.
- [CrossRef] [PubMed] [Google Scholar]
- Fructose intake: Metabolism and role in diseases In: Martin IJ, ed. Sugar intake-risks and benefits and the global diabetes epidemic (1st ed). London, UK: IntechOpen; 2021. p. :1-25.
- [CrossRef] [Google Scholar]
- Metabolic syndrome and outcomes following early-stage breast cancer. Breast Cancer Res Treat. 2014;148:363-77.
- [CrossRef] [PubMed] [Google Scholar]
- Simultaneous exposure to electromagnetic field from mobile phone and unimpeded fructose drinking during pre-, peri-, and post-pubertal stages perturbs the hypothalamic and hepatic regulation of energy homeostasis by early adulthood: Experimental evidence. Environ Sci Pollut Res Int. 2022;29:7438-51.
- [CrossRef] [PubMed] [Google Scholar]
- Comparison of theoretical and experimental absorption of radiofrequency power. Report SAM-75-52 Utah Univ Salt Lake City: Department of Bioengineering. Available from: https://apps.dtic.mil/sti/citations/tr/ADA022890 [Last accessed on 2023 Jan 09]
- [Google Scholar]
- Molecular and metabolic markers of fructose induced hepatic insulin resistance in developing and adult rats are distinct and Aegle marmelos is an effective modulator. Sci Rep. 2018;8:15950.
- [CrossRef] [PubMed] [Google Scholar]
- Protective effect of thymoquinone against high-fructose diet-induced metabolic syndrome in rats. Eur J Nutr. 2015;54:1117-27.
- [CrossRef] [PubMed] [Google Scholar]
- Optimal cutoff for the evaluation of insulin resistance through triglyceride-glucose index: A cross-sectional study in a Venezuelan population. F1000Res. 2017;6:1337.
- [CrossRef] [PubMed] [Google Scholar]
- Effects of myricetin on glycemia and glycogen metabolism in diabetic rats. Life Sci. 2000;67:1695-705.
- [CrossRef] [PubMed] [Google Scholar]
- Hexokinase In: Red cell metabolism: A manual of biochemical methods (3rd ed). New York, US: Grune and Stratton Inc; 1984. p. :39-40.
- [Google Scholar]
- Pathological occurrence of glucose-6-phosphatase in serum in liver diseases. Clin Chim Acta. 1959;4:554-61.
- [CrossRef] [PubMed] [Google Scholar]
- The colorimetric determination of phosphorus. J Biol Chem. 1925;66:375-400.
- [CrossRef] [Google Scholar]
- Oxidative stress induced by aluminum oxide nanomaterials after acute oral treatment in Wistar rats. J Appl Toxicol. 2012;32:436-45.
- [CrossRef] [PubMed] [Google Scholar]
- Hyperhomocysteinemia induces insulin resistance in male Sprague-Dawley rats. Diabetes Res Clin Pract. 2007;76:1-5.
- [CrossRef] [PubMed] [Google Scholar]
- Obesity Associated with prediabetes increases the risk of breast cancer development and progression-a study on an obese rat model with impaired glucose tolerance. Int J Mol Sci. 2023;24:11441.
- [CrossRef] [PubMed] [Google Scholar]
- Assessment of wheat germ oil role in the prevention of induced breast cancer in rats. ACS Omega. 2022;7:13942-52.
- [CrossRef] [PubMed] [Google Scholar]
- Induction of non-alcoholic fatty liver disease and insulin resistance by feeding a high-fat diet in rats: Does coenzyme Q monomethyl ether have a modulatory effect? Nutrition. 2009;25:1157-68.
- [CrossRef] [PubMed] [Google Scholar]
- The Association between triglyceride-glucose index as a marker of insulin resistance and the risk of breast cancer. Front Endocrinol (Lausanne). 2021;12:745236.
- [CrossRef] [PubMed] [Google Scholar]
- Early effects of a low fat, fructose-rich diet on liver metabolism, insulin signaling, and oxidative stress in young and adult rats. Front Physiol. 2018;9:411.
- [CrossRef] [PubMed] [Google Scholar]
- Obesity, insulin resistance and oxidative stress: Implication for breast carcinogenesis. Can Res. 2009;69(2 Suppl):6025.
- [CrossRef] [Google Scholar]
- Chemically induced carcinogenesis in rodent models of aging: Assessing organismal resilience to genotoxic stressors in geroscience research. Geroscience. 41:209-27.
- [CrossRef] [PubMed] [Google Scholar]
- Blood chemistry profiles of DMBA-induced mammary tumor in female Sprague dawley rats In: AIP Conference Proceedings. Vol 2108. New York: AIP Publishing LLC; 2019. p. :20043.
- [CrossRef] [Google Scholar]
- Non-ionizing radiation as possible carcinogen. Int J Environ Health Res. 2022;32:916-40.
- [CrossRef] [PubMed] [Google Scholar]
- Adiponectin, ghrelin, and leptin in cancer cachexia in breast and colon cancer patients. Cancer. 2006;106:966-73.
- [CrossRef] [PubMed] [Google Scholar]
- Insulin resistance and body composition in cancer patients. Ann Oncol. 2018;29(Suppl 1):ii18-26.
- [CrossRef] [Google Scholar]
- Linkage between obesity leptin and breast cancer. Breast Cancer (Auckl). 2020;14:1-8.
- [CrossRef] [PubMed] [Google Scholar]


