
Translate this page into:
Evaluation of an association between maternal prenatal psychological stress and insulin resistance during pregnancy and postpartum
*Corresponding author: Shailaja S. Moodithaya, Department of Physiology, K.S. Hegde Medical Academy, NITTE (Deemed to be University), Mangaluru, Karnataka, India. shailaja.moodithaya@nitte.edu.in
-
Received: ,
Accepted: ,
How to cite this article: Kishan A, Shetty PK, Moodithaya SS. Evaluation of an association between maternal prenatal psychological stress and insulin resistance during pregnancy and postpartum. Indian J Physiol Pharmacol 2023;67:105-12.
Abstract
Objectives:
Various physiological mechanisms counteract insulin resistance (IR) during normal pregnancy. Psychological stress is a known, independent risk factor for developing IR. Pregnancy-specific psychological stress may cause IR and increase the risk of overt diabetes. Hence, the study aims to evaluate maternal psychological stress using multiple stress markers and their association with changes in IR during pregnancy and postpartum.
Materials and Methods:
Anthropometric measurements such as height, weight and skinfold thickness were measured using standard techniques. The stress markers were assessed using perceived stress scales (K10 questionnaire), a physiological marker of stress (Heart rate variability [HRV] measures) and biochemical stress markers (Saliva, hair cortisol levels). IR was estimated using homeostasis model assessment-estimated IR (HOMA-IR). The association of stress markers with IR was studied among fifty healthy pregnant women during pregnancy and postpartum.
Results:
The psychological stress scores and saliva cortisol were significantly higher during pregnancy than postpartum (P = 0.000). A comparison of cardiac autonomic function as assessed by HRV measures shows that high frequency in normalised units (HFnu) was significantly higher during the postnatal period than in the prenatal period (P = 0.000). High frequency (HF) spectral power in absolute units was also significantly higher (P = 0.002) in the postpartum period (2612.30 ± 432.24) when compared with the prenatal period (1446.10 ± 299.15). Low frequency in normalised units (LFnu), low frequency (LF)/HF ratio was significantly higher during the prenatal period than in the postnatal period (P = 0.000). As assessed by HOMA-IR values, IR was significantly higher during the prenatal period than postpartum (P = 0.04). There was a significant positive correlation between prenatal psychological stress scores, HRV parameters (LFnu, LF/HF) and postnatal IR.
Conclusion:
Pregnancy is associated with higher psychological stress levels and IR than postpartum. Furthermore, the maternal cardiac autonomic marker could predict postnatal IR among healthy pregnant women.
Keywords
Cardiac autonomic function
Gestational diabetes mellitus
Insulin resistance
Psychological stress

INTRODUCTION
In India, the frequency of gestational diabetes mellitus (GDM) is on the rise, with an increase in type 2 diabetes mellitus, with prevalence rates ranging from 3.8% to 41%. And it is estimated that around 42 million women are affected with GDM at any point in time in India.[1] Insulin resistance (IR) occurs as a physiological adaptation during pregnancy to meet the increasing demands.[2] IR in pregnancy results from reduced insulin secretion, reduced tissue sensitivity to insulin and increased secretion of hormones with an anti-insulin effect, such as human placental lactogen, free cortisol and prolactin.[3] During a healthy pregnancy, IR is counteracted by increasing insulin secretion or switching to other energy sources such as fat. However, when insulin secretion capacity is insufficient to meet the IR, glucose intolerance develops, resulting in GDM. In 2–3% of all pregnancies, glucose tolerance deteriorates to the extent that it fulfils the diagnostic criteria for GDM.[3]
Stress is inevitable in day-to-day life and causes stimulation of neural and hormonal pathways.[4] Several neuroendocrine, metabolic and inflammatory changes occur during stressful situations.[5] A strong association has been reported between chronic psychological stress and cardio-metabolic dysfunction.[6] Acute and chronic stress is an independent risk factor for the development of IR.[5,7] Up to 23% of women experience depression, 15–35% have anxiety and 75% experience stress during pregnancy.[8] Evidence suggests that pregnancy is associated with dampened maternal physiological responsivity to a stimulus or stressor, especially during the third trimester.[9]
The stress response is mediated mainly by the hypothalamus-pituitary-adrenal axis, the renin-angiotensin system and the automatic nervous system (ANS).[4] ANS is a primary stress regulatory system that plays a critical role in modulating the stress response.[10] Psychological stress is a well-known risk factor for the development of IR.[11] Hence, IR due to psychological stress may be associated with ANS dysregulation.[12] An impaired autonomic function has been associated with elevated serum insulin concentrations and decreased insulin sensitivity, independent of glucose levels.[13] The autonomic dysfunction occurs in the early stage of glucose intolerance,[13,14] even before the clinical onset of diabetes mellitus.[15] Therefore, impairment of autonomic function predicts the development of overt diabetes.[13,16] However, autonomic dysfunction due to pregnancy-specific psychological stress and its role in the development of IR is not well established.
The previous studies on prenatal stress have confined themselves to assessing general stress, which was evaluated using self-administered inventories. Physiologic and hormonal responses to stress during pregnancy or the effects of pregnancy-specific stress on changes in IR using multiple markers like heart rate variability (HRV), biochemical markers (saliva, hair cortisol) and perceived stress scales were sparsely investigated. This study aims to evaluate maternal psychological stress using multiple stress markers and their association with changes in IR during pregnancy and postpartum.
MATERIALS AND METHODS
Study participants
This is a longitudinal study involving fifty healthy pregnant women with a singleton pregnancy, age group of 25–35 years, visiting the tertiary hospital in India. The menstrual history (Last Menstrual Period) and the first-trimester ultrasound scan confirmed their gestational age. The experimental procedures were conducted during the morning session after a brief medical history and clinical examination.
Ethical considerations
The Central Ethics Committee of the institution has approved the study protocol, NU/CEC/2020–2021/043, dated March 14, 2020 and all procedures were performed after obtaining written informed consent.
Study design
Selection criteria
Volunteers willing to undergo delivery in the hospital and agreeing to follow-up postpartum were recruited during their 3rd trimester (>32 weeks). Subjects with any acute illness in the preceding 2 weeks, multiple pregnancies, any foetal abnormalities as detected by ultrasound, history of diabetes mellitus/GDM, hypertension or other medical condition requiring treatment, history of breathlessness, chest pain, orthopnoea, those with habituation to tobacco and alcohol, any psychiatric illness were excluded from the study.
Study variables
All the participants underwent the following experimental protocols during 3rd trimester and 6 weeks postpartum.
Anthropometric measurements such as height, weight and skinfold thickness were measured using standard techniques. Body mass index (BMI) was calculated as weight (kg) divided by height (m) squared. The physical activity of the past month was assessed using a pre-validated physical activity questionnaire.[17]
-
Assessment of psychological stress levels:
K-10 questionnaire[18] has ten questions about negative emotional states experienced during the 4 weeks with five-level response scales for each item. Scores for the ten items are then summed, yielding a minimum possible score of 10 and a maximum possible score of 50. High scores signify extreme psychological stress, whereas low values imply minimal psychological stress.
-
Biochemical analysis:
Salivary cortisol level estimation: Saliva samples of the subject was collected using the standard technique.[19] Cortisol levels were estimated by the enzyme-linked immunosorbent assay (ELISA) method (DRG Instruments, GmbH, Marburg, Germany). The values were reported as ng/mL. The reference value for the saliva cortisol level was 0.09–30 ng/mL.
Hair cortisol level estimation: Hair samples were taken from the vertex posterior of the head and were stored at room temperature in a labelled paper envelope. Hair was processed for steroid extraction using an appropriate procedure[20] and analysed by the ELISA kit (DRG Instruments, GmbH, Marburg, Germany). The values were reported as pg/mg. The reference value for hair cortisol level was 17.7–153.2 pg/mg.
Assessment of cardiac autonomic activity: All subjects were requested to refrain from strenuous physical activity for 24 h and any caffeinated/noncaffeinated beverages for 2 h before recording. Basal blood pressure was measured using a non-invasive intermittent automated blood pressure monitoring device (Omron IA2 model - HEM-7011-C1, Kyoto, Japan) in the supine position. Resting HRV measurements were performed after voiding the urine in a single session in a quiet, temperature-controlled room (23 ± 1°C). During the procedures, subjects were instructed to breathe normally. The lead II ECG was recorded using a computerised 4-channel data acquisition module (Power lab 26-T, AD instruments, New South Wales, Australia) in the supine position for 5 min at a sampling rate of 1000 Hz. Ectopics and artefacts were excluded from the raw recordings manually. Power spectral analysis was performed using a non-parametric Fast Fourier transformation-based approach with the HRV module of Lab Chart V7, AD Instruments. The power spectrum was expressed as low frequency (LF) (0.04–0.15 Hz), high frequency (HF) (0.15-0.4 Hz), total power in absolute units, LF in normalised units (LFnu), HF in normalised units (HFnu) and LF/HF ratio. LF components represent parasympathetic and sympathetic modulations, whereas HF is associated with parasympathetic modulation. LF/ HF constitutes an evaluation of the ANS balance (sympathetic/parasympathetic). If this ratio is <1, it shows a parasympathetic predominance, whereas a ratio above 1 reflects sympathetic dominance.
-
Assessment of IR:
Fasting blood glucose: Venous blood sample was collected after an overnight fast using a sterile technique and blood glucose levels were estimated by glucose oxidase and peroxidase method.
Serum C peptide: Venous blood sample was collected in plain tubes using a sterile technique. The serum was separated and C-peptide levels were estimated using the ELISA kit (DiaMetra S.r. l, Via Pozzuolo, Italy). The reference value for serum C peptide level: 0.7–1.9 ng/mL.
IR was estimated using Homeostasis model assessment-estimated IR (HOMA-IR). HOMA-IR using C-peptide was calculated by replacing insulin with C-peptide in HOMA-IR formula:[21] Fasting plasma glucose (mmoL/L) times fasting serum insulin (mU/L) divided by 22.5.
Statistical analysis
Data are expressed as mean, accompanied by standard deviation. If data were normally distributed, a paired t-test was performed to compare parameters between the antenatal and postnatal periods. For non-parametric distribution, the Wilcoxon Signed Ranks Test was performed to compare indices between the prenatal and postpartum period and expressed as median accompanied by interquartile range. The strength of the association between various stress markers and IR during prenatal and postnatal periods was assessed using Spearman’s rank correlation test. Statistical significance was considered at a probability value of P < 0.05. Statistical Package for the Social Sciences (SPSS) 20.0. (SPSS-Inc., 233 South Wacker Drive, Chicago, IL, USA) Software package was used to perform the statistical analysis.
RESULTS
The present study is a longitudinal study among fifty subjects in the age group of 26 ± 2 years recruited during the third trimester and followed up 6 weeks after delivery. The comparison of subject characteristics and anthropometric measurements of study participants during the prenatal and postnatal periods showed that the anthropometric parameters such as weight, BMI, fat percentage and fat-free mass did not vary significantly between antenatal and postnatal periods. The heart rate and systolic blood pressure were significantly higher in the prenatal period than in the postnatal period [Table 1]. Participants reported a significantly higher (P = 0.000) physical activity level during pregnancy (1.76 [1.56, 2]) than during postpartum period (1.48 [1.34, 1.72]).
| Variables | Prenatal Mean±SD |
Postnatal Mean±SD |
P-value |
|---|---|---|---|
| Weight (kg) | 57.65±9.31 | 58.51±5.65 | 0.7 |
| Height (m) | 1.56±0 | ||
| BMI (kg/m2) | 23.68±3.3 | 24.12±2.63 | 0.23 |
| Pulse rate (beats/minute) |
76±7 | 72±7 | 0.007* |
| Systolic blood pressure (mm Hg) |
115±10 | 112±10 | 0.04* |
| Diastolic blood pressure (mm Hg) |
77±8 | 74±9 | 0.1 |
As measured by the K10 questionnaire, the psychological stress scores were significantly higher during the prenatal period than during the postnatal period. Saliva cortisol level, the biochemical marker of acute stress, was significantly higher during the prenatal period compared to the postpartum period [Table 2]. The biomarker for chronic stress, hair cortisol level was 21.51 ± 0.71 pg/mg during the prenatal period. A comparison of HRV indices shows a significant difference in HF, LF spectral power in normalised units and LF/HF ratio [Figure 1]. HFnu was significantly higher during the postnatal period than during the prenatal period. HF spectral power in absolute units was also significantly higher (P = 0.002) in the postpartum period (2612.30 ± 432.24) when compared with the prenatal period (1446.10 ± 299.15). LFnu, LF/HF ratio was significantly higher during the prenatal period than in the postnatal period. The average HR between the antenatal and postpartum periods was significantly different (P = 0.01), with prenatal HR (93.88 ± 1.9) being significantly higher than that of postnatal HR (87.16 ± 1.55). However, there was no difference in other indices of HRV, such as Total Power (TP) and LF, in absolute units. A comparison of IR during the prenatal and postnatal periods shows that fasting blood glucose levels and HOMA-IR values were significantly higher during the prenatal period [Table 3].
| Variables | Prenatal period | Postnatal period | P-value |
|---|---|---|---|
| Psychological stress scores |
16 (10, 25) | 10 (10, 12) | 0.000* |
| Saliva cortisol (ng/mL) |
14.39 (11.77, 17.53) | 7.63 (3.48, 11.14) | 0.000* |
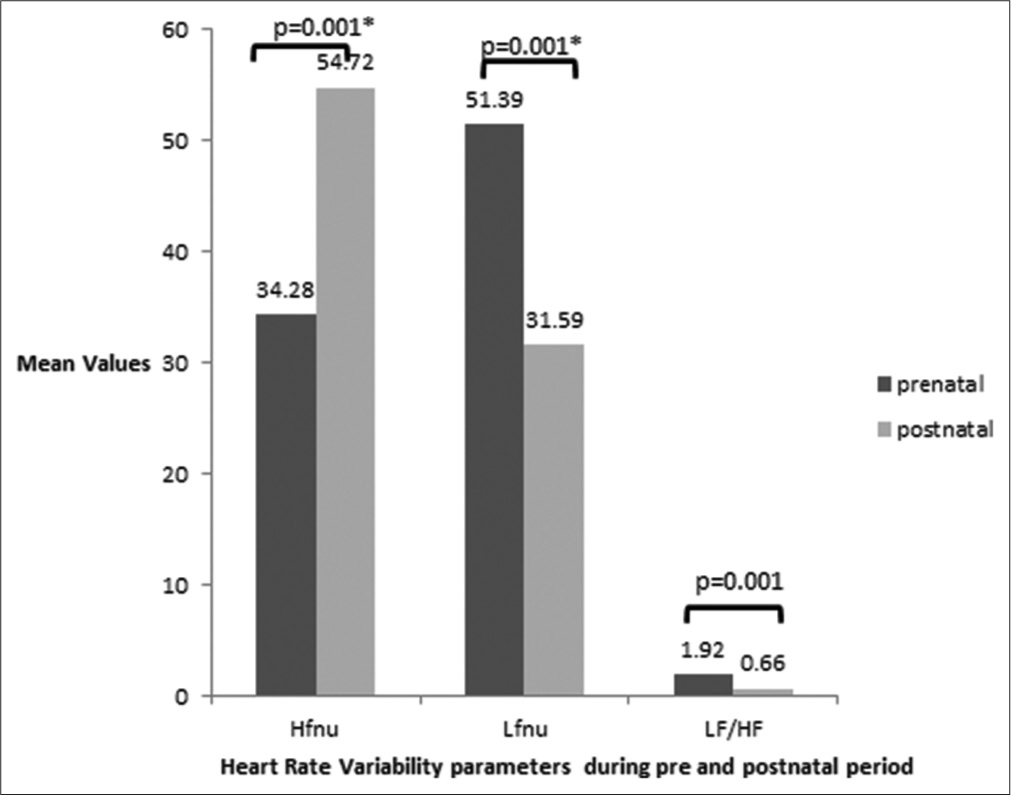
- Comparison of heart rate variability during the prenatal and postnatal period *P < 0.05 considered to be statistically significant. HFnu: High-Frequency in normalised units, LFnu: Low-Frequency in normalised units, LF/HF: Low frequency/ high-frequency ratio.
| Variables | Prenatal period | Postnatal period | P-value |
|---|---|---|---|
| Fasting blood glucose (mg/dL) |
80 (78, 90) | 74 (71, 78) | 0.000* |
| HOMA-IR | 1.72 (1.18, 2.63) | 1.48 (1.03, 2.24) | 0.04* |
A significant positive correlation existed between prenatal psychological stress measures assessed by stress scores and postnatal IR [Figure 2]. There exists a significant positive correlation between prenatal LFnu (P = 0.03, r = 0.33), LF/HF [Figure 3] and postnatal IR. Furthermore, a significant positive correlation existed between postnatal HRV parameters like LF spectral power in both absolute (P = 0.02, r = 0.35) as well as normalised units (P = 0.02, r = 0.31) and postnatal IR. There was a significant negative correlation between HF spectral power in absolute units (P = 0.04, r = −0.31) and postnatal IR [Figure 4].
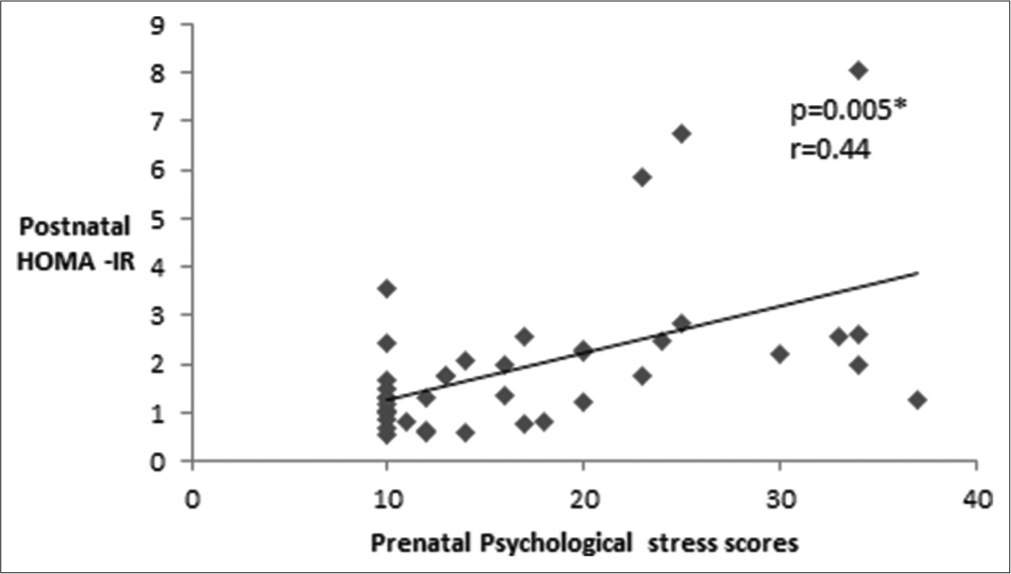
- Correlation between prenatal psychological stress measures and insulin resistance during the postnatal period. *P < 0.05 is considered to be statistically significant. HOMA-IR: Homeostasis model assessment-estimated insulin resistance.
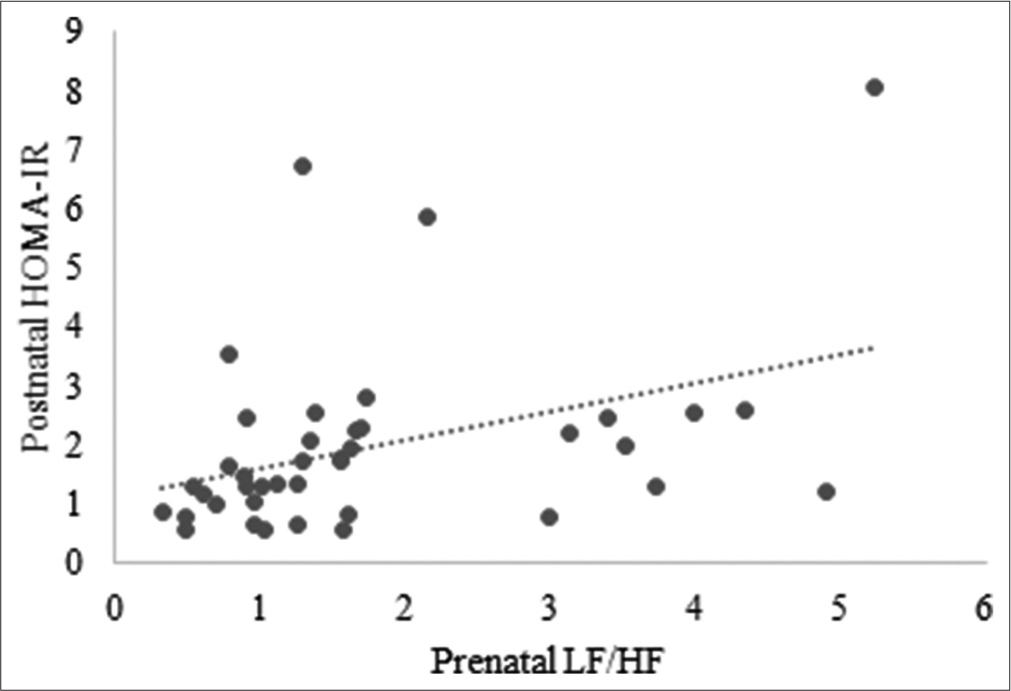
- Correlation between prenatal HRV parameters and postnatal IR. HRV: Heart rate variability, IR: Insulin resistance, HOMA-IR: Homeostasis model assessment-estimated insulin resistance, LF/HF: Low frequency/High-frequency ratio.
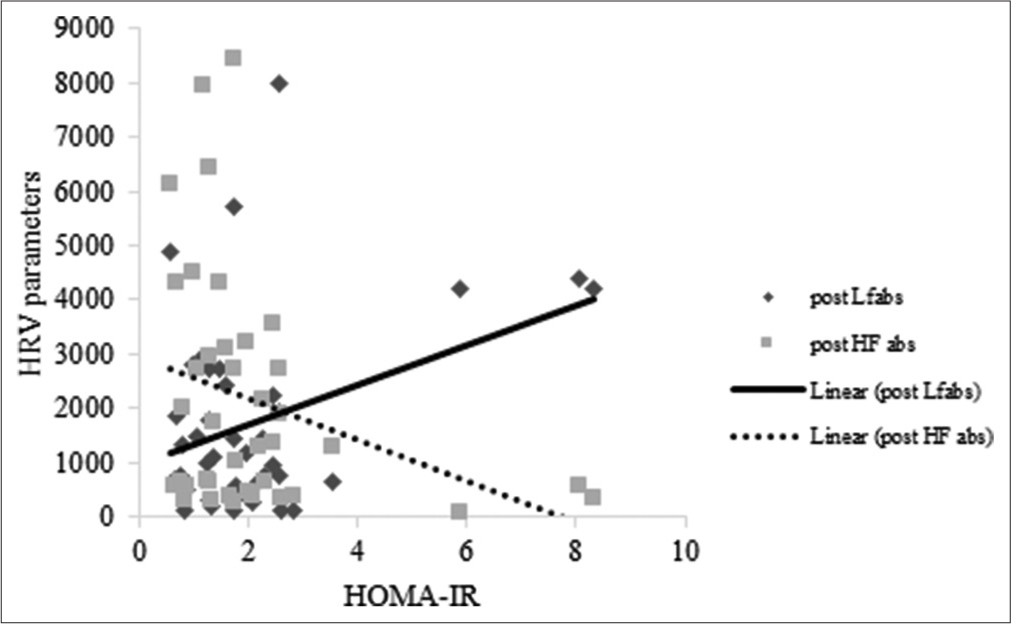
- Correlation between HRV and IR during the postnatal period. HRV: Heart rate variability, IR: Insulin resistance, HOMA-IR: Homeostasis Model Assessment-estimated insulin resistance.
Correlation statistics were performed to study the association between the biochemical parameters (saliva and hair cortisol levels) and IR during pregnancy and postpartum. However, there was no statistically significant association.
DISCUSSION
The study compared various psychological stress measures and IR during the prenatal and postnatal periods and evaluated the association of various psychological stress measures with IR. In this study, stress was measured by assessing (a) psychological stress scores, (b) cardiac autonomic markers of stress and (c) biochemical markers of stress during the 3rd trimester of pregnancy and 6 weeks postpartum.
The results of the study showed that maternal psychological stress level was higher during the prenatal period compared to the postnatal period. There was higher sympathetic activity, as suggested by a significantly increased LF spectral power, LF/HF, a surrogate marker of sympathetic autonomic function, during the third trimester of pregnancy. These findings were supported by significantly higher stress scores and saliva cortisol levels during the prenatal period. However, following delivery, there was a shift of sympathovagal balance towards parasympathetic predominance. A higher parasympathetic autonomic function was suggested by significantly increased HF spectral power. A study among healthy pregnant women that assessed the ANS activity in different stages of pregnancy to the psychosocial stressor showed similar findings.[22] The findings of present the study are similar to another cross-sectional study that compared frequency and time domain parameters of HRV among pregnant women and non-pregnant controls.[23] A study by Gandhi et al.[24] showed a significant increment in frequency domain parameters, LF power normalised and absolute values during the third trimester of gestation.
Moreover, most studies assessed HRV over three trimesters during pregnancy but did not compare antenatal and postpartum HRV changes. In contrast to these findings, a study reported no difference in autonomic indices during different gestational ages[25] and among pregnant and non-pregnant women;[26] however, the autonomic function tests were performed only during the first trimester. One study that compared HRV parameters among normotensive women during pregnancy and postpartum reported that LF spectral power and LF/HF ratio significantly increased during pregnancy and returned to normal following delivery.[26] The findings of the present study were similar to the earlier reports. This indicates sympathetic predominance during late pregnancy and sympathovagal balance returns to normal following delivery. Sympathetic dominance during pregnancy may be due to aortocaval compression caused by enlarging gravid uterus with increasing gestational age.[27] The return of ANS activity to normal is attributed to the relief of aortocaval compression.[28]
A study that compared hair cortisol with diurnal salivary cortisol throughout pregnancy and in the first 3 months postnatally reported that both saliva and hair cortisol levels significantly increased across pregnancy, followed by a postnatal decline.[29] Even in the present study, saliva cortisol level, a biomarker of acute stress, was higher during the prenatal period when compared with the postnatal period.
The present study uses HRV measures as a psychological stress marker during pregnancy. A parallel change in biochemical stress markers supports the HRV findings of altered sympathovagal balance. Apart from various physiological and physical changes, the psychological adaptations during the prenatal period may be challenging for a mother.
A comparison of IR in prenatal and postnatal periods showed a significant difference in IR as assessed by HOMA-IR. The HOMA-IR values were significantly higher during the third trimester and decreased to normal values 6 weeks following delivery. A study among three pregnant women confirms that insulin sensitivity in patients with GDM is comparable with that of non-pregnant women within 3 days after childbirth.[30] A longitudinal study among healthy obese women with normal glucose tolerance during and after pregnancy concluded that IR was reversed within 15–16 weeks after delivery.[31] Similarly, in the present study, higher HOMA-IR values during the third trimester return to normal following delivery. Another longitudinal study by Kirwan et al. that followed up nine women from late pregnancy to 1 year following birth has shown that IR that develops during late pregnancy reverses to normal within 1 year postpartum.[32] However, the data about the time of reversibility of IR during the postpartum period in women with normal glucose tolerance during pregnancy remains speculative due to the lack of longitudinal studies with large sample sizes. Further, the present study is the one that assessed the effect of pregnancy specific stress on IR during healthy pregnancy and postpartum.
The correlation between measures of prenatal stress with IR in postnatal periods showed a significant association between prenatal psychological stress measures such as HRV indices, psychological stress scores and postnatal IR. A significant positive correlation existed between the stress scores, the surrogate marker of sympathetic activity (LF spectral power), sympathovagal balance (LF/HF) and postnatal IR. Both pregnancy and postpartum periods increase the vulnerability of women to mental stress as well as impaired glucose metabolism. Knowledge regarding the association of maternal prenatal psychological stress with postnatal IR is meagre, especially among the healthy population. A study that assessed the relationship between IR and activity of the ANS using power spectrum analysis of HRV analysed from long-term, 24-h ECG recordings among healthy nondiabetic subjects showed an association between altered sympathovagal balance and IR.[33] Laitinen et al.[34] demonstrated similar findings following insulin infusion during a euglycemic clamp. Therefore, impaired autonomic function may result from IR among nondiabetic individuals.
A longitudinal study regarding the incidence of diabetes mellitus among women with GDM concluded that fasting blood glucose values at a normal upper range can predict postpartum diabetes.[35] A prospective cohort study that evaluated modifiable risk factors for GDM, such as psychological stress, physical activity level and lifestyle-related factors among different ethnic groups, showed an association between psychological stress and the development of GDM.[36] These studies were among patients with GDM and focused on determining the risk of diabetes among mothers with GDM. They did not study the effects of prenatal maternal stress on postnatal IR.
Psychological stress-induced IR may be due to the activation of the sympathetic nervous system and the hypothalamic-pituitary-adrenal axis.[5] The sympathetic nervous system returns to normal when stress fades.[37] However, whether the autonomic imbalance contributes to the development of IR or a consequence of IR is unclear. An impaired autonomic function may be a mechanism associated with early glucose dysmetabolism. Thus, autonomic dysfunction may be involved in the pathogenic pathway leading to the development of diabetes. Animal studies showed that an increased sympathetic modulation of vessels and the heart preceded metabolic dysfunction in fructose-consuming mice.[38] A Framingham heart study reported that autonomic imbalance, as measured by decreased HRV and increased resting heart rate, predicted the development of metabolic syndrome within 12 years.[39] A recent study of 1298 individuals with different numbers of metabolic abnormalities showed that altered cardiac autonomic function existed in individuals with one or two metabolic abnormalities. Hence, the authors suggested that altered cardiac autonomic function precedes the presence of IR in metabolic syndrome.[40] However, the role of autonomic imbalance during the antenatal period as a predictor of postnatal IR is unclear. The present study highlights the association between psychological stress-induced autonomic dysfunction during pregnancy and postnatal IR.
Hence, the measurement of HRV can be an accurate, noninvasive, inexpensive and quantitative tool for detecting an autonomic imbalance in the prenatal period and may be helpful in the forecast of postnatal IR among healthy and those with GDM. Assessment of cardiac autonomic function provides an opportunity to prospectively evaluate modifiable risk factors such as psychological stress for GDM and gauge the magnitude of the problem in the prenatal period. Furthermore, it offers a chance to propose appropriate guidelines for screening, diagnosis and early treatment of postpartum DM. Early maternal lifestyle modifications in pregnancies at risk for GDM might offer the opportunity not only for a reduction in the risk of type 2 diabetes in the mother but also for the risk of diabetes and obesity in children.
Limitations of the study
The present study assessed association of various stress markers with IR during prenatal period and postnatal period. However, the study will have more clinical significance if the parameters were evaluated pre-pregnancy, across three trimesters during pregnancy and postpartum. Further the study can be extrapolated among patients with GDM as well as overt DM.
CONCLUSION
The findings of the study show that maternal psychological stress level is higher during the prenatal period compared to the postnatal period, as assessed by HRV, salivary cortisol levels and psychological stress scores. Furthermore, pregnancy is associated with higher IR compared to postpartum. The present study also concludes an association between prenatal stress measures and postnatal IR. Maternal prenatal cardiac autonomic marker (HRV measures) could predict postnatal IR among healthy pregnant women.
Declaration of patient consent
The authors certify that they have obtained all appropriate patient consent.
Conflicts of interest
There are no conflicts of interest.
Financial support and sponsorship
Nil.
References
- Gestational diabetes in India: Science and society. Indian J Endocrinol Metab. 2015;19:701-4.
- [CrossRef] [PubMed] [Google Scholar]
- Carbohydrate and lipid metabolism in pregnancy: Normal compared with gestational diabetes mellitus. Am J Clin Nutr. 2000;71(5 Suppl):1256s-61s.
- [CrossRef] [PubMed] [Google Scholar]
- Insulin resistance in the third trimester of pregnancy suffering from gestational diabetes mellitus or impaired glucose tolerance In: Radenkovic M, ed. Gestational Diabetes. London, United Kingdom: IntechOpen; 2011.
- [Google Scholar]
- Molecular mechanisms linking stress and insulin resistance. EXCLI J. 2022;21:317-34.
- [CrossRef] [PubMed] [Google Scholar]
- Chronic stress and insulin resistance-related indices of cardiovascular disease risk, part I: Neurophysiological responses and pathological sequelae. Altern Ther Health Med. 2007;13:46-52.
- [Google Scholar]
- Acute psychological stress results in the rapid development of insulin resistance. J Endocrinol. 2013;217:175-84.
- [CrossRef] [PubMed] [Google Scholar]
- Prenatal exposure to maternal depression and anxiety on imprinted gene expression in placenta and infant neurodevelopment and growth. Pediatr Res. 2018;83:1075-83.
- [CrossRef] [PubMed] [Google Scholar]
- Attenuation of maternal psychophysiological stress responses and the maternal cortisol awakening response over the course of human pregnancy. Stress. 2010;13:258-68.
- [CrossRef] [PubMed] [Google Scholar]
- Autonomic nervous system and stress to predict secondary ischemic events after transient ischemic attack or minor stroke: Possible implications of heart rate variability. Front Neurol. 2018;9:90.
- [CrossRef] [PubMed] [Google Scholar]
- Psychological stress is a risk factor for Type 2 diabetes mellitus in college students. Stud Health Technol Inform. 2021;285:296-9.
- [CrossRef] [PubMed] [Google Scholar]
- Heart rate in relation to insulin sensitivity and insulin secretion in nondiabetic subjects. Diabetes Care. 2000;23:624-8.
- [CrossRef] [PubMed] [Google Scholar]
- Prospective investigation of autonomic nervous system function and the development of Type 2 diabetes: The atherosclerosis risk in communities study, 1987-1998. Circulation. 2003;107:2190-5.
- [CrossRef] [PubMed] [Google Scholar]
- Early autonomic dysfunction in glucose-tolerant but insulin-resistant offspring of Type 2 diabetic patients. Hypertension. 2003;41:1223-7.
- [CrossRef] [PubMed] [Google Scholar]
- Influence of autonomic nervous system dysfunction on the development of Type 2 diabetes: The CARDIA study. Diabetes Care. 2003;26:3035-41.
- [CrossRef] [PubMed] [Google Scholar]
- The development and characteristics of a physical activity questionnaire for epidemiological studies in urban middle class Indians. Indian J Med Res. 2000;111:95-102.
- [Google Scholar]
- Interpreting scores on the kessler psychological distress scale (K10) Aust N Z J Public Health. 2001;25:494-7.
- [CrossRef] [PubMed] [Google Scholar]
- Measuring salivary cortisol in the behavioral neuroscience laboratory. J Undergrad Neurosci Educ. 2004;2:A41-9.
- [Google Scholar]
- An assessment of cortisol analysis in hair and its clinical applications. Forensic Sci Int. 2010;196:32-7.
- [CrossRef] [PubMed] [Google Scholar]
- The definition of insulin resistance using HOMA-IR for Americans of Mexican descent using machine learning. PLoS One. 2011;6:e21041.
- [CrossRef] [PubMed] [Google Scholar]
- Heart rate variability changes in pregnant and non-pregnant women during standardized psychosocial stress1. Acta Obstet Gynecol Scand. 2009;88:77-82.
- [CrossRef] [PubMed] [Google Scholar]
- Maternal heart rate variability during different trimesters of pregnancy. Natl J Physiol Pharm Pharmacol. 2018;8:1475-80.
- [CrossRef] [Google Scholar]
- A study on cardiac autonomic modulation during pregnancy by non-invasive heart rate variability measurement. Int J Med Public Health. 2014;4:441-5.
- [CrossRef] [Google Scholar]
- Changes in haemodynamic and autonomous nervous system parameters measured non-invasively throughout normal pregnancy. Eur J Obstet Gynecol Reprod Biol. 2019;144(Suppl 1):S179-83.
- [CrossRef] [PubMed] [Google Scholar]
- Analysis of heart rate variability in normal pregnancy and postpartum In: Proceedings of International Conference on Bio-Signals. Chennai: Images and Instrumentation; 2013. p. :84-91.
- [CrossRef] [PubMed] [Google Scholar]
- Maternal physiologic adaptations to early human pregnancy. Am J Obstet Gynecol. 1988;159:1456-60.
- [CrossRef] [PubMed] [Google Scholar]
- Return of autonomic nervous activity after delivery: Role of aortocaval compression. Br J Anaesth. 1999;82:932-4.
- [CrossRef] [PubMed] [Google Scholar]
- Hair cortisol levels as a retrospective marker of hypothalamic-pituitary axis activity throughout pregnancy: Comparison to salivary cortisol. Physiol Behav. 2011;104:348-53.
- [CrossRef] [PubMed] [Google Scholar]
- Insulin action during pregnancy. Studies with the euglycemic clamp technique. Diabetes. 1985;34:380-9.
- [CrossRef] [PubMed] [Google Scholar]
- Longitudinal study of carbohydrate metabolism in healthy obese pregnant women. Diabetes Care. 1997;20:1470-5.
- [CrossRef] [PubMed] [Google Scholar]
- Reversal of insulin resistance postpartum is linked to enhanced skeletal muscle insulin signaling. J Clin Endocrinol Metab. 2004;89:4678-84.
- [CrossRef] [PubMed] [Google Scholar]
- Alterations in heart rate variability during everyday life are linked to insulin resistance. A role of dominating sympathetic over parasympathetic nerve activity? Cardiovasc Diabetol 2016. ;. ;15:91.
- [CrossRef] [PubMed] [Google Scholar]
- Power spectral analysis of heart rate variability during hyperinsulinemia in nondiabetic offspring of Type 2 diabetic patients: Evidence for possible early autonomic dysfunction in insulin-resistant subjects. Diabetes. 1999;48:1295-9.
- [CrossRef] [PubMed] [Google Scholar]
- Prediction of postpartum diabetes in women with gestational diabetes mellitus. Diabetologia. 2010;53:452-7.
- [CrossRef] [PubMed] [Google Scholar]
- Fortner RT, Gollenberg A, Buonnaccorsi J, Dole N, Markenson G. A prospective cohort study of modifiable risk factors for gestational diabetes among hispanic women: Design and baseline characteristics. J Womens Health (Larchmt). 2010;19:117-24.
- [CrossRef] [PubMed] [Google Scholar]
- Heart rate variability biofeedback intervention for reduction of psychological stress during the early postpartum period. Appl Psychophysiol Biofeedback. 2014;39:203-11.
- [CrossRef] [PubMed] [Google Scholar]
- Sympathetic overactivity precedes metabolic dysfunction in a fructose model of glucose intolerance in mice. Am J Physiol Regul Integr Comp Physiol. 2012;302:R950-7.
- [CrossRef] [PubMed] [Google Scholar]
- Autonomic imbalance as a predictor of metabolic risks, cardiovascular disease, diabetes, and mortality. J Clin Endocrinol Metab. 2015;100:2443-8.
- [CrossRef] [PubMed] [Google Scholar]
- Altered cardiac autonomic function may precede insulin resistance in metabolic syndrome. Am J Med. 2010;123:432-8.
- [CrossRef] [PubMed] [Google Scholar]


