
Translate this page into:
Risk of injury prediction during landing from 33 cm height: Kinetic approach for sports application

*Corresponding author: Madhusudan Pal, Scientist G and Director, Centre of Excellence, Footwear Design and Development Institute, Noida, Uttar Pradesh, India. madhusudanpal@rediffmail.com
-
Received: ,
Accepted: ,
How to cite this article: Jana R, Singh K, Bhanot N, Maity A, Kumar SD, Pal M. Risk of injury prediction during landing from 33 cm height: Kinetic approach for sports application. Indian J Physiol Pharmacol. doi: 10.25259/IJPP_467_2024
Abstract
Objectives:
Jump-landing assessments measure an individual’s ability to absorb ground reaction forces, generate explosive lower limb power, and maintain joint alignment, all of which are critical to understanding sports injury risk. Footwear significantly affects jumping mechanics and injury potential, leading to increased interest in activities done barefoot. This study investigates kinetic responses and injury risks when landing from a height of 33 cm, comparing conditions with and without sports shoes.
Materials and Methods:
Twenty-five healthy young adults were volunteers for this study. Kinetic parameters were recorded and processed using Quattro Jump force plat and Mars Quarter performance analysis software. Data were summarised into mean ± standard deviation values and statistical analysis was performed using the Statistical Package for the Social Sciences-26.
Results:
The without and with shoe jumping data show scattered parameters, with maximum forces of 4450.84 N and 3892.60 N at 33 cm, indicating a 62.45% and 54.6% risk of metatarsal injury, respectively. The stabilisation force was 623.96 N and 632.20 N at 33 cm, reached at 0.58 s and 0.63 s, respectively. Time from max force to max force before stabilisation regression analysis indicated a low R-squared value and a random fit plot.
Conclusion:
In the barefoot condition, initial contact force and max force were 28.57% (120 N) and 13.38% (4,450.84 N) higher, respectively, compared to the shoe condition (90 N and 3,892.60 N). However, the stabilisation force was higher with shoes (632.20 N) than barefoot (623.96 N). This suggests a higher risk of musculoskeletal injuries and joint stress when barefoot due to the higher forces while wearing shoes enhances balance and stability through increased stabilisation force.
Keywords
Barefoot
Drop landing
Foot injury
Kinetic responses
Sports shoes

INTRODUCTION
Jumping, followed by landing, is one of the most critical performance indicators for success in many different sporting activities, such as basketball, volleyball, or gymnastics. Impact forces experienced during ground contact in landing can reach a magnitude of 3–7 times body weight.[1] Kinetic characteristics are important for both performance enhancement and the frequency of sports injuries when it comes to jumping and landing abilities.[2,3] Landing biomechanics are related to muscle control, muscle fatigue, flexibility and musculoskeletal stiffness, but these multiple factors collectively represent an individual’s landing technique, which has been considered one of the most important factors related to injury potential.[4,5] The vertical drop landings and drop jumps from raised platform jump landings are used to evaluate landing technique and joint loads.[6,7] These activities are typically linked to musculoskeletal ailments in the lower limb, particularly in the hip, knee and ankle joints. An anterior cruciate ligament (ACL) injury and ankle pains are two of the most common injuries that happen without contact during the practice of dynamic activities. It is reported that the jumping and landing biomechanics are closely related to the risk of acute injury due to prolonged exposure to high-ground reaction forces (GRFs).[8]
Footwear greatly impacts jumping mechanics, but going without shoes provides a unique perspective on how the human body interacts with the ground. Understanding the dangers of damage when not wearing shoes has increased interest in barefoot activities.[9,10] According to some previous research, walking barefoot improves one’s ability to engage with the environment and increases balance and movement efficiency, but it also exposes oneself to certain risks, especially when jumping. Without shoes, sports such as volleyball involve barefoot landing on softs and surfaces, and there is a notable risk of acute and overuse knee injuries, which is comparable to that of indoor volleyball. Given the injury risk implicated with barefoot landing during sporting activities, it is important to understand how the kinetics and energy of barefoot landing differ from that of shod landing.[11,12] The ability of shoes to enhance athletic performance has been suggested to be partly attributed to the elastic energy storage and recovery in its cushioning system.[13,14] The athletic shoe wear is usually composed of soft compressible support surface interfaces designed to protect against injuries occurring in sports due to large GRFs; however, the impact remains high with the use of shoe wear as the athletes actively seek to transform the soft interface into at inner-stiff form associated with improved stability.[15] Volleyball involves frequent and repetitive jumping and landing movements, which places substantial demands on the musculoskeletal system. Understanding the kinetics parameters during these actions can provide valuable insights into the biomechanical demands placed on the body during gameplay.[16] With jump heights ranging from 35 cm to 65 cm, touch-down velocities varied between 2.6 ms and 3.6 ms. First and second maximum vertical impact values recorded ranged from 1000 to 2000 and 1000 to 6500 N, respectively.[17]
This study aimed to investigate changes in kinetic variables – such as initial contact force (ICF) and time, max force and time, stabilisation force and time from max force to stabilisation – during drop jumps from a height of 33 cm, with and without shoes. The findings provide baseline values for evaluating footwear, aiding in the design and development of footwear for various activities, including sports and children’s shoes, to reduce injury risk.
MATERIALS AND METHODS
Participants
Twenty-five (n = 25, Male: 13, Female: 12) healthy, physically fit young adults who had no foot deformities or musculoskeletal abnormalities in the lower limbs, with no history of musculoskeletal disorders or fractures on the lower extremity and vestibular system were selected. The mean age, height and weight of the female participants were 19.00 ± 0.835 years, 156 ± 4.9 cm and 54.78 ± 10.320 kg, and male participants were 19.85 ± 1.214 years, 172 ± 5.6 cm and 66.71 ± 8.200 kg, respectively.
Before beginning the study, the participants were informed about all the necessary information and the study protocol, and they had completed an informed permission form. The subjects were free to withdraw their participation at any point during the experiment.
Ethics approval statement
The present study protocol on human use as an experimental subject and the entire principles of the experiment outlined by the Declaration of Helsinki Protocol,1964, and as per approved ethical clearance No HMC/IEC/FDDI/01, dated 18.04.2024.
Selection of sports shoes and features
Before starting the study, a thorough survey was conducted to understand better the common sports footwear preferences regularly used by young adults during sports activities. It was observed that most of the adults used sports footwear with these features-
All sports shoes provide excellent energy return and cushioning, making them ideal for high-impact activities and all-day comfort. Their specially designed upper material offers a snug and breathable fit. The selected footwear features specifically designed arch support that enhances stability, particularly during high-impact activities. This arch support is shaped to match the natural contours of the foot, ensuring a comfortable and supportive fit.
In addition, the specialised outsole guarantees superior grip. The outsole is crafted using two proprietary materials that are commonly found in branded sports footwear. This combination offers excellent grip and durability, even in wet conditions, making the shoes suitable for various terrains. The heel counter also helps maintain a secure fit and reduces the risk of heel slippage [Figure 1].
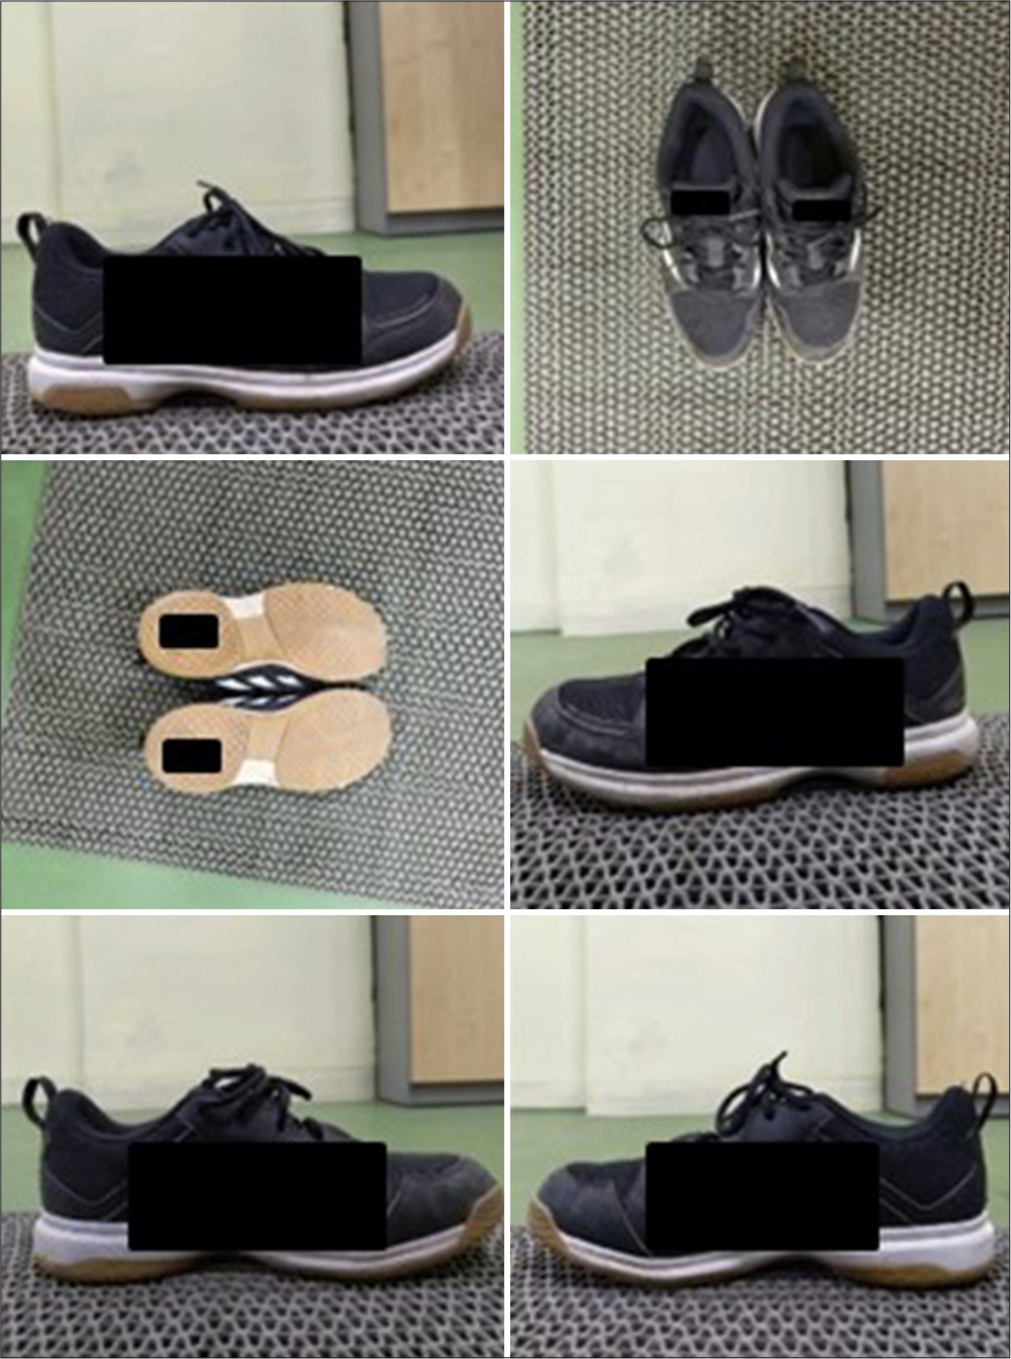
- Sports shoe used in the study.
Selection of landing height and kinetic responses in the forefoot region
The 33 cm landing height was chosen to reflect the lower end of typical volleyball jump heights (35–65 cm), simulating a realistic and safe landing scenario. This height helps to assess kinetic responses relevant to volleyball performance, focusing on forefoot demands during dynamic movements. The results aim to inform injury prevention strategies and enhance performance.
Data collection
A week before the study, participants practised forefoot landings from heights of 28–38 cm, reporting comfort at 33 cm. This height was chosen for its realistic challenge in examining forefoot landing kinematics. A balanced experiment design was used, collecting barefoot data first from participants 1–25, then with shoes in reverse order. During the experiment, kinematic responses such as ICF (N), initial contact time (S), max force (N), max force time (S), stabilisation force (N), time from max force to max force before stabilisation (MFBS) (S) and time from max force to stabilisation force (S) were recorded during drop landing from 33 cm height without and with wearing sports shoes [Figure 2]. All these recorded parameters using a Quattro Jump force plate (Model 9290DD, M/s Kistler Instrument AG in Switzerland) and Mars Quarter performance analysis software were used for data processing and analysis. All the experiment was conducted in a laboratory at 25–27°C temperature and 50–55% relative humidity, respectively, at the Footwear Design and Development Institute (FDDI) in India.

- (a and b) Drop landing from 33 cm height with shoe. (c and d) Drop landing from 33 cm height without shoe.
Statistical analysis
Data were summarised into mean ± standard deviation values. Shapiro–Wilk normality test signified that the parameters were not normality distributed. Hence, there for Mann–Whitney U-test was done to compare the means of without and with shoe conditions at 33 cm heights kinetic parameters. The significant level was considered at 0.05 levels. The Statistical Package for the Social Sciences-26 was applied.
RESULTS
The scatter plot compares ICF (N) versus initial contact time (ICT) (S), max force (N) versus max force time (s) and stabilisation force (N) versus time from max force to MFBS (S). In addition, it includes a Radar chart of the stabilisation force, and a line plot of time from max force to max force reach before stabilisation. These visualisations demonstrate the balance and stability dynamics of without and with shoe jumping. Table 1 and all the iilustration of the Figure 3 demonstrates the without and with shoe jumping dynamics and stability over jumping heights: 33 cm, these dynamics data represent the future design dimension achieving better balance and stability.
| Parameters | n=25 (33 cm Height) | |||
|---|---|---|---|---|
| Barefoot condition | Shod condition | Mann-Whitney U test | Asymptotic significance level | |
| Mean±SD | Mean±SD | |||
| Initial Contact Force (N) | 38.16±22.137 | 44.32±25.718 | 274.50 | 0.46 (P>0.05) |
| Initial Contact Time (S) | 2.09±0.512 | 1.95±0.496 | 272.00 | 0.43 (P>0.05) |
| Max Force (N) | 4450.84±2245.791 | 3892.60±1711.375 | 268.00 | 0.38 (P>0.05) |
| Max Force Time (S) | 2.14±0.516 | 1.99±0.500 | 270.50 | 0.41 (P>0.05) |
| Stabilisation Force (N) | 623.96±136.619 | 632.20±134.506 | 295.50 | 0.74 (P>0.05) |
| Time from max force to MFBS (S) | 0.25±0.056 | 0.27±0.078 | 281.50 | 0.54 (P>0.05) |
| Time from max force to stabilisation force (S) | 0.58±0.149 | 0.63±0.184 | 249.00 | 0.21 (P>0.05) |
(P>0.05) =Not Significant. SD: Standard deviation, MFBS: Maximum Force Before Stabilization

- (a and b) Representation of scatter plot of initial contact force versus initial contact time with Regress and Lowes fit model-33 cm jump height in without and with shoe condition. (c and d) Representation of scatter plot of max force versus max force time with regress and lowes fit model-33 cm jump height in without and with shoe condition. (e and f) Representation of scatter plot of stabilisation force versus time from max force to max force before Stabilisation with Regress and Lowes fit model-33 cm jump height without and with shoe condition.
During the initial contact phase, the subject’s foot makes contact with the ground. The ground exerts a force on the subjects (GRF) in response to this contact. The magnitude and direction of this force impact the subsequent phases of the jump. The scatter plots of ICF (N) versus ICT (s) in Figure 3 show a dispersed pattern. For the barefoot condition, the regression line (solid red) indicates a slight upward trend in ICF with increasing ICT, ranging from 0 N to over 90 N. The lowess line (dashed green) captures local fluctuations, peaking around 0–1.5 s and 3.0–3.5 s. In the shoe condition, the regression line shows a downward trend, with ICF values ranging from 0 N to nearly 120 N. The lowess line reveals fluctuations, with an increase up to about 1.5 s followed by variability.
Figure 4 shows a similar pattern for Max Force versus Max Force Time. In the barefoot condition, the regression line suggests a slight upward trend in Max Force with increasing Max Force Time, with values ranging from 2,000 N to over 10,000 N. The lowess line initially decreases, then increases around 2.5 s, showing variability. In the shoe condition, the regression line trends downward, with Max Force values between 1,000 N and nearly 9,000 N. The lowess line indicates fluctuations, with a decrease up to 1.0 s and an increase of around 2.5 s.

- (a and b) Representation of Radar chart of stabilisation force of 33 cm jump heights without and with shoe condition. Orange large dots: stabilization force of 25 participants. orange small dots (connecting lines) of all forces.
Figure 5 depicts the stabilisation force (n) versus time from max force to MFBS. For the barefoot condition, the regression line shows a slight upward trend, with the stabilisation force ranging from 400 N to over 1,100 N. The lowest line shows an initial increase up to 0.15 s followed by variability. In the shoe condition, the regression line shows no trend, with values ranging from 400 N to nearly 1,100 N. The lowess line captures local fluctuations, peaking around 0.15–0.20 s.

- (a and b) Representation of line chart of time from max force to max force before Stabilisation of 33 cm jump heights without and with shoe condition.
In this study, stabilisation forces in the barefoot condition are generally lower, concentrated around 400–600 N, indicating more uniform force application with less extreme values. In contrast, the shoe condition shows higher stabilisation forces, with several points reaching 800–1000 N, suggesting increased variability and higher peaks. This implies that wearing shoes may increase stabilisation force due to added cushioning or structural support, potentially affecting balance or stability.
For the barefoot condition, the data show a weak positive correlation between the variables, with a regression equation of (y = 0.0014x + 0.2333) and an R2 value of 0.0362, indicating a slight upward trend. In the shoe condition, the regression equation (y = 0.005x + 0.2048) with an R2 value of 0.2232 suggests a stronger upward trend, indicating that changes in the independent variable more significantly impact the time from maximum force to MFBS.
Mann–Whitney U-test was conducted to compare between all parameters of without and with shoe condition. However, there was no significant difference between without and with shoe condition at 33 cm heights. It was also observed that in shoe condition, the ICF, stabilisation force, time from max force to MFBS (S) and time from max force to stabilisation force (S) parameters also had higher values than those without shoe condition, but the ICT, Max force and Max force-time parameters were also lower than without shoe condition.
DISCUSSION
This study aimed to examine how kinetic variables change during drop jumping from 33 cm heights in barefoot and shoe conditions, focusing on the risk of foot injury, lower extremity joint energy absorption and landing techniques. The research provides insights into balance and stability under different footwear conditions and explores how mechanical demands on the lower extremities affect muscle responses during landing. Lower-limb musculoskeletal injuries, particularly in the hip, knee, ankle and toes, are often linked to landing biomechanics, which is influenced by factors such as muscle control, fatigue, flexibility and stiffness – key elements in assessing injury potential.[18] McNitt-Gray reported high hip and knee work, and small ankle work for landings from medium and high heights (0.72 and 1.28m) for recreational athletes using a normal landing technique.[19] A study by Mayank Kalra et al. identified metatarsal fractures, particularly in the second metatarsal, as the second most common foot injury.[20] Their research on impact energy, pressures and deformations found that the average peak energy, force and deformation during a fracture were 46.6 J, 4640 N and 28.9 mm, respectively. Survival analysis indicated a 50% probability of fracture at 35.8 J of impact energy and 3562 N of force, highlighting the importance of understanding these thresholds for safety footwear performance.[20]
In the scatter plot of ICF (N) versus ICT (s), the barefoot condition shows an upward trend, indicating marginally higher forces with increasing time compared to the shoe condition. High ICFs during landing increase the risk of musculoskeletal injuries, stressing joints and connective tissues, potentially leading to acute injuries such as sprains or fractures and long-term issues such as osteoarthritis.[18] A higher ICT suggests a longer period before peak force is reached, which may help distribute forces across the lower extremity and reduce the risk of acute injuries.[19] Zhang et al. found that high ICF during landing increases injury risk due to greater joint loading, particularly in high-impact sports. They emphasised improving landing mechanics through training as a key injury prevention strategy to reduce ICF.[21] Yeow et al. found that higher GRFs and loading rates, increasing knee stress and the risk of ACL injuries were linked with shorter ICTs.[22]
Max Force versus Max Force Time, at barefoot condition shows an upward trend suggesting that all parameters tend to marginally with increasing at Time (s) than shoe condition. The maximum force of barefoot and shoe jumping data shows scattered parameters with maximum forces of 4450.84 N and 3892.60 N at 33 cm height, indicating a 62.45% and 54.6% risk of metatarsal injury. Similarly, other findings indicated that the metatarsal bone has a 100% chance of fracture under an impact force of 4640 N, and a 50% chance of fracture under an impact force of 3562 N, as determined by survival analyses.[23] According to Roberts et al., fractures sustained at forces ranging from 7854 to 12206 N (mean: 9751 N) included the calcaneus, tibia and fibula bones.[24] In a previous study, a force limit of 8.0 kN was determined to represent a 50% probability of foot-ankle fracture which included among other traumas, injuries to the calcaneus.[25] High maximum force during landing can lead to a greater risk of acute injuries such as fractures, ligament sprains and muscle strains.[26]
In the scatter plot of Stabilisation Force versus Max Force to MFBS, the barefoot condition shows an upward trend with increasing time, while the shoe condition shows less variation. The radar chart indicates that stabilisation forces are lower barefoot but higher with shoes. Lower stabilisation forces can lead to incorrect joint alignment and uneven force distribution, increasing the risk of falls and injuries. Higher stabilisation forces, on the other hand, may improve joint alignment and balance, reducing the likelihood of injuries, especially in the lower extremities.[27] Paterno et al. found the application of stabilisation force in preventing re-injury as well as improving landing mechanics following ACL reconstruction.[28]
In the line plot at barefoot and shoe condition, the time from maximum force to MFBS slightly increases as the independent variable. The Time from max force to stabilisation is an important measure during jumping activities. The time from maximum force to stabilisation force (TTS) refers to the duration that it takes for an individual to regain stability after landing from a jump. It also measured how quickly a person regains balance and control after the impact of landing. When jumping from a height, the landing impact forces are significant, and a quick stabilisation response reduces the risk of injury from excessive forces or misalignment.[23]
The Mann–Whitney U-test revealed no significant differences between barefoot and shoe conditions at 33 cm heights. In the shoe condition, ICF, Stabilisation Force and times from Max Force to MFBS and Stabilisation Force were higher, while ICT, Max Force and Max Force Time were lower compared to barefoot. These findings are consistent with previous research indicating no significant differences in impact force between barefoot and shod landings during both two-legged and toe.[29] Previous studies by Yu et al. and Baus et al. suggested that footwear cushioning is important, with thicker-soled shoes resulting in higher impact forces compared to barefoot. The study suggested that the dissipation of force into the shoe cushion may negatively affect performance by reducing the direct application of force into the ground.[30-31] This data will be considered as a standard value which will require designing, developing and identifying the best sports footwear to reduce injury risk. The hypothesis of this study’s findings will have practical implications for athletes, fitness enthusiasts and kids engaging in with and without shoe activities. By elucidating the kinetic responses during jumps and landing, this study’s results can tailor jump-specific exercises to optimize performance and reduce injury risks.
Limitation
The present study was restricted to a small sample size, one landing height, and a narrow age group of males (19.85 ± 1.214 years) and females (19.00 ± 0.835 years). In the future, a details study will be conducted with a larger sample size, age and gender variation, different heights, different types of sports footwear, the effect of different footwear materials and different biomechanical intricacies during landing.
CONCLUSION
The present study revealed that landing without shoes from a height of 33 cm exerts more impact on the forefoot as compared to shoe landing on studied parameters. In barefoot (without shoe) conditions, ICF and maximum force were higher at 28.57% (120 N) and 13.38% (4450.84 N), respectively, compared to shoe landing conditions (90 N and 3892.60 N). However, the stabilisation force was higher (632.20 N) in landing with a shoe than in barefoot condition (623.96 N). Hence, the risk of musculoskeletal injuries and joint stress was higher in barefoot conditions due to higher ICF and maximum force, whereas landing while wearing shoes enhances balance and stability and prevents fall risk due to higher stabilisation force.
The present study also indicated that the kinetic responses and the risk of injuries are 62.45% (4450.84 N) without shoes, and 54.6% (3892.60 N) when landing with shoes close to threshold values for metatarsal fractures at 3562 N, which indicates a 50% chance of injuries. This observation from the current study is intended to inform the design and development of sports footwear, particularly for volleyball players, to enhance performance and minimize the risk of injuries by improving sports shoes’ impact and force absorption capacity.
Acknowledgment:
The authors would like to express their sincere gratitude to all the participants for volunteering in the study. We are indebted to and convey our deepest sense of appreciation to Col. Pankaj Sinha, Managing Director, FDDI for his administrative support. We would like to express our sincere gratitude to Deepak Sahni, Deputy Manager; Shyam Katiyar, Senior Faculty Grade 2; Ashok Sahai, Centre in charge for their assistance and Continuous support during data collection and Suresh Joshi from Centre of Excellence, Footwear Design and Development Institute for his continuous motivation and logistic support to the study team. We are also thankful to FDDI and the Ministry of Commerce and Industry, Government of India, for their financial support.
Author’s contributions:
RJ: Data processing, tabulation, statistical analysis and writing – original draft; KS: Data collection, processing and tabulation; NB: Data collection, Statistical analysis and manuscript writing; AM: Data collection, analysis, review and editing; SDK: Data interpretation, editing and manuscript writing.; MP: Overall conceptualisation and supervision, experimental design, protocol and manuscript writing. All authors read and approved the final manuscript.
Ethical approval:
The research/study was approved by the Institutional Review Board at HMC/FDDI, number HMC/IEC/FDDI/01, dated 18th April 2024.
Declaration of patient consent:
Patient’s consent was not required as there are no patients in this study.
Conflicts of interest:
There are no conflicts of interest.
Use of artificial intelligence (AI)-assisted technology for manuscript preparation:
The authors confirm that there was no use of artificial intelligence (AI)-assisted technology for assisting in the writing or editing of the manuscript and no images were manipulated using AI.
Financial support and sponsorship: Footwear Design and Development Institute and Ministry of Commerce and Industry, Goverment of India.
References
- Comparison of knee and hip kinematics during landing and cutting between elite male football and futsal players. Healthcare (Basel). 2021;9:606.
- [CrossRef] [PubMed] [Google Scholar]
- Isokinetic muscle strength cannot be related to the odds ratio of musculoskeletal injuries in young elite wrestlers. BMC Sports Sci Med Rehabil. 2022;14:29.
- [CrossRef] [PubMed] [Google Scholar]
- Different sagittal angles and moments of lower extremity joints during single-leg jump landing among various directions in basketball and volleyball athletes. J Phys Ther Sci. 2013;25:1109-13.
- [CrossRef] [PubMed] [Google Scholar]
- Physical characteristics that predict vertical jump performance in recreational male athletes. Phys Ther Sport. 2003;4:167-74.
- [CrossRef] [Google Scholar]
- Alterations to movement mechanics can greatly reduce anterior cruciate ligament loading without reducing performance. J Biomech. 2010;43:2657-64.
- [CrossRef] [PubMed] [Google Scholar]
- Comparison of pre-contact joint kinematics and vertical impulse between vertical jump landings and step-off landings from equal heights. Hum Mov Sci. 2017;56:88-97.
- [CrossRef] [PubMed] [Google Scholar]
- Bilateral comparison of vertical jump landings and step-off landings from equal heights. J Strength Cond Res. 2018;32:1937-47.
- [CrossRef] [PubMed] [Google Scholar]
- Influence of sports flooring and shoes on impact forces and performance during jump tasks. PLoS One. 2017;12:e0186297.
- [CrossRef] [PubMed] [Google Scholar]
- Hormonal therapy: ACL and ankle injury. Med Sci Sports Exerc. 2006;38:7-12.
- [CrossRef] [PubMed] [Google Scholar]
- Interaction of arch type and footwear on running mechanics. Am J Sports Med. 2006;34:1998-2005.
- [CrossRef] [PubMed] [Google Scholar]
- An epidemiological analysis of the injury pattern in indoor and in beach volleyball. Int J Sports Med. 1997;18:217-21.
- [CrossRef] [PubMed] [Google Scholar]
- Strategies for the prevention of volleyball related injuries. Br J Sports Med. 2006;40:594-600.
- [CrossRef] [PubMed] [Google Scholar]
- The energetics of running and running shoes. J Biomech. 1993;26(Suppl 1):41-51.
- [CrossRef] [PubMed] [Google Scholar]
- Energy aspects associated with sport shoes. Sportverletz Sportschaden. 2000;14:82-9.
- [CrossRef] [PubMed] [Google Scholar]
- Balance and vertical impact in sports: Role of shoe sole materials. Arch Phys Med Rehabil. 1997;78:463-7.
- [CrossRef] [PubMed] [Google Scholar]
- Comparison of landing kinematics and kinetics between experienced and novice volleyball players during block and spike jumps. BMC Sports Sci Med Rehabil. 2022;14:105.
- [CrossRef] [PubMed] [Google Scholar]
- Impact in landing when a volleyball block In: de Groot G, Hollander AP, Huijing PA, van Ingen Schenau GJ, eds. Biomechanics XI-B. Amsterdam: Free University Press; 1988. p. :694-700.
- [Google Scholar]
- Effect of landing stiffness on joint kinetics and energetics in the lower extremity. Med Sci Sports Exerc. 1992;24:108-15.
- [CrossRef] [PubMed] [Google Scholar]
- Kinetics of the lower extremities during drop landings from three heights. J Biomech. 1993;26:1037-46.
- [CrossRef] [PubMed] [Google Scholar]
- Characterizing in-situ metatarsal fracture risk during simulated workplace impact loading. J Biomech Eng. 2023;145:51008.
- [CrossRef] [PubMed] [Google Scholar]
- Contributions of lower extremity joints to energy dissipation during landings. Med Sci Sports Exerc. 2000;32:812-9.
- [CrossRef] [PubMed] [Google Scholar]
- Anterior cruciate ligament (ACL) injuries in athletes: The mechanism of injury and risk factors. J Biomech. 2011;44:1842-8.
- [Google Scholar]
- Shod landing provides enhanced energy dissipation at the knee joint relative to barefoot landing from different heights. Knee. 2011;18:407-11.
- [CrossRef] [PubMed] [Google Scholar]
- Injury mechanisms and tolerance of the human ankle joint. Centers for Disease Control. 1993;1(1):73-86.
- [Google Scholar]
- Dynamic axial tolerance of the human foot-ankle complex. SAE Trans. 1996;105:1887-98.
- [CrossRef] [Google Scholar]
- Biomechanical measures of neuromuscular control and valgus loading of the knee predict anterior cruciate ligament injury risk in female athletes: A prospective study. Am J Sports Med. 2005;33:492-501.
- [CrossRef] [PubMed] [Google Scholar]
- Biomechanical measures during landing and postural stability predict second anterior cruciate ligament injury after anterior cruciate ligament reconstruction and return to sport. Am J Sports Med. 2010;38:1968-78.
- [CrossRef] [PubMed] [Google Scholar]
- Normalizing considerations for time to stabilization assessment. J Sci Med Sport. 2012;15:159-63.
- [CrossRef] [PubMed] [Google Scholar]
- Lower extremity biomechanics during the landing of a stop-jump task. Clin Biomech (Bristol). 2006;21:297-305.
- [CrossRef] [PubMed] [Google Scholar]
- Jump and landing biomechanical variables and methods: A literature review. Crit Rev Biomed Eng. 2020;48:211-22.
- [CrossRef] [PubMed] [Google Scholar]


