
Translate this page into:
Exploring the repeatability of pulse arrival time in healthy subjects: A test-retest approach

*Corresponding author: Shival Srivastav, Department of Physiology, All India Institute of Medical Sciences, Jodhpur, Rajasthan, India. drshival@gmail.com
-
Received: ,
Accepted: ,
How to cite this article: Jose AS, Srivastav S, Mehta B. Exploring the repeatability of pulse arrival time in healthy subjects: A test-retest approach. Indian J Physiol Pharmacol. 2025;69:27-33. doi: 10.25259/IJPP_149_2024
Abstract
Objectives:
Vascular ageing is increasingly being recognised as a vital marker of cardiovascular morbidity and mortality. Assessment of vascular stiffness is an important parameter in this context. Pulse arrival time (PAT) assessed using photoplethysmography (PPG) and digital electrocardiogram (ECG) signals is a feasible and cost-effective parameter for this assessment. However, there are few, if any, studies that have assessed the test-retest repeatability of this parameter over time.
Materials and Methods:
We computed PAT using finger PPG and Lead II ECG and measured it sequentially at five instances over a period of 1 month in 21 healthy adults (10 males and 11 females). Mean and diastolic blood pressure (MBP and DBP) and heart rate (HR) were also measured at each visit. A novel parameter, PAT normalised for HR of 75 (PAT-75), was also computed. PAT and PAT-75 were compared for these visits using repeated measures analysis of variance. The intraclass correlation coefficient (ICC) was used to assess the test-retest reliability of this parameter.
Results:
MBP, DBP, and PAT values did not show any difference between the visits. HR was significantly different between the visits. PAT-75 was significantly lower for the afternoon of day 1 as compared to the forenoon. ICC demonstrated only moderate reliability of PAT (ICC = 0.57), with further reduction observed for PAT-75 (ICC = 0.38).
Conclusion:
PAT was only moderately repeatable on repeated evaluation over a 1-month period. This finding may have implications for the large-scale applicability of this technology, and therefore, we propose further investigation into the repeatability of this parameter in large cohorts.
Keywords
Electrocardiography
Photoplethysmography
Pulse wave analysis
Reproducibility
Vascular stiffness

INTRODUCTION
Vascular function assessment has garnered increasing interest in the scientific community in recent times. Vascular stiffness is being recognised as a marker of cardiovascular health. Increased stiffness is widely considered a surrogate of vascular age and a predictor of morbidity and all-cause mortality.[1-5] Therefore, assessment and quantification of vascular stiffness, both in the physiology laboratory and the clinics, has immense potential as a screening and diagnostic tool for vascular ageing.
Assessment of vascular age can be done using multiple methods. Tonometry-based pressure waveform recording at proximal and distal sites along the arterial tree is the gold standard for non-invasive vascular stiffness measurement. Oscillometry-based estimation is a relatively inexpensive option, with the advantage of simultaneous multisite acquisition. A combination of tonometric and oscillometric techniques is now being employed to enable quick and multi-segment assessment of vascular stiffness. However, equipment based on these techniques is costly.
Photoplethysmography (PPG) is now omnipresent with increased penetration of clinical and consumer-based products, especially smartwatches.[6] PPG employs simple optical techniques to bombard microvascular beds with red/near-infrared light and capture the pulsatile changes in blood volume.[7] The applications of PPG range from saturation using pulse oximeters and anaesthetic monitoring, including respiration and fluid status[8,9], to diverse applications such as nociception assessment[10] and haemorheology.[11] The PPG signal is also being used to provide valuable clues to vascular parameters such as vascular stiffness.[12] Indices derived using PPG have been shown to hold promise as predictors of vascular ageing.[13]
Pulse arrival time (PAT) is a vascular stiffness marker derived using Lead II electrocardiogram (ECG) and PPG signals. It is derived as the time lag between the peak of the R wave of the ECG signal and the foot of the PPG wave, the two key fiducial points. PAT represents a cost-effective way to assess vascular age since PPG and Lead II signals can be acquired noninvasively with simple and inexpensive hardware requirements. This makes PAT a potentially important parameter for vascular stiffness measurement since it can be deployed on a large scale.
Recently, attempts are also underway to use the signal to measure blood pressure (BP) using cuffless techniques.[14,15] Multiple studies have been undertaken to use PPG and ECG signals for the purpose of cuffless BP estimation and have used parameters derived from two PPG signals, such as pulse transit time (PTT) and PAT derived from PPG and ECG.[16-18] These studies have used arterial catheter/finger cuff-based measurements as the reference. Since PTT has an inverse relationship with BP, it is an emerging parameter of interest for the purpose of cuffless BP estimation.[19,20] In addition, PAT has been shown to have a correlation with systolic pressure.[20] Therefore, these indices hold promise for cuffless BP measurement in the near future.
The temporal robustness of PAT is likely to have a bearing on its large-scale applicability. However, there are few studies that have evaluated the test-retest repeatability of PAT. Therefore, there is a need for assessment of test-retest reliability of this parameter in healthy subjects, when assessed by a single observer over multiple visits. In the present work, we explore the test-retest reliability of PAT, derived from finger PPG and ECG signals, in healthy adults.
MATERIALS AND METHODS
The present work was conducted as a prospective observational study in young, healthy adults. The study was done in accordance with Strengthening the Reporting of Observational Studies in Epidemiology guidelines proposed by Enhancing the Quality and Transparency of Health Research network.[21,22] After ethical clearance from the Institute Ethics Committee, we commenced subject recruitment. Healthy adults of either sex were recruited in the study after informed written consent. Apparently, healthy subjects between 18 and 45 years old were recruited for the study. Female subjects were requested to report for the first visit between the 2nd and 6th day of the cycle.
The sample size was estimated using the previously described value of PAT in healthy subjects.[23] Assuming a precision of 0.5 ms, 5% Type I error and power of 80% and standard deviation derived from the above-mentioned reference, we obtained a sample size of 11.
Data acquisition was performed in a noise free, temperature and humidity-controlled environment at the autonomic function laboratory at our institution. The subjects reported to the laboratory 2 h after a light meal. Abstinence from tea, coffee and tobacco was ensured on the day of the test. Furthermore, subjects were requested to refrain from heavy exercise in the preceding 24 hours of the recording. After arrival at the laboratory, height and weight were taken using standard protocol. Subjects were requested to empty their bladder and provided supine rest for 10 min. BP was measured after supine rest using an oscillometric device (Omron HEM-8712™ BP device). Systolic BP and diastolic BP (DBP) were recorded, and mean BP (MBP) was computed.
Lead II ECG was acquired using disposable Ag-AgCl electrodes attached to the Bioamplifier module of the PowerLab 4/35™ system (AD Instruments, Australia). PPG signal was simultaneously acquired using a PPG probe (infrared, reflection type photoelectric transducer – MLT1020PPG™) attached to the index finger of the right hand. Data were acquired in the supine position for a period of 5 min after a rest of 10 min. Visual inspection was done to see the presence of any ectopics/artefacts. Data were recorded using LabChart Pro™ software version 8 (AD Instruments, Australia) and stored on a desktop system for offline analysis.
Data were acquired on the forenoon of day 1, between 9 am and 12 noon and designated as PAT_V1. The recording was repeated on the afternoon of day 1 (between 3 pm and 5 pm, PAT_V2), the forenoon of day 2 (PAT_V3), 1 week later (PAT_V4) and 1 month later (PAT_V5). All the forenoon recordings were done between 9 am and 12 noon. On day 1, after the forenoon recording, subjects were requested to have a light meal (avoiding caffeinated beverages) and rest. They were requested to report to the laboratory between 3 and 5 pm for PAT_V2 recording.
PAT was calculated as per the methodology proposed by Jaryal et al.[24] and further validated by Chandran et al.[25] and Khare et al.[23,26] The Peak of the R wave and the foot of the peripheral pulse wave were identified using the peak analysis module of LabChart Pro 8™ software. The values were computed for a complete 5 min of resting data. The time lag between the peak of the R wave and the foot of the finger pulse was computed and designated as PAT, as described previously [23] [Figure 1]. PAT was computed for every beat and averaged over a period of 5 min.
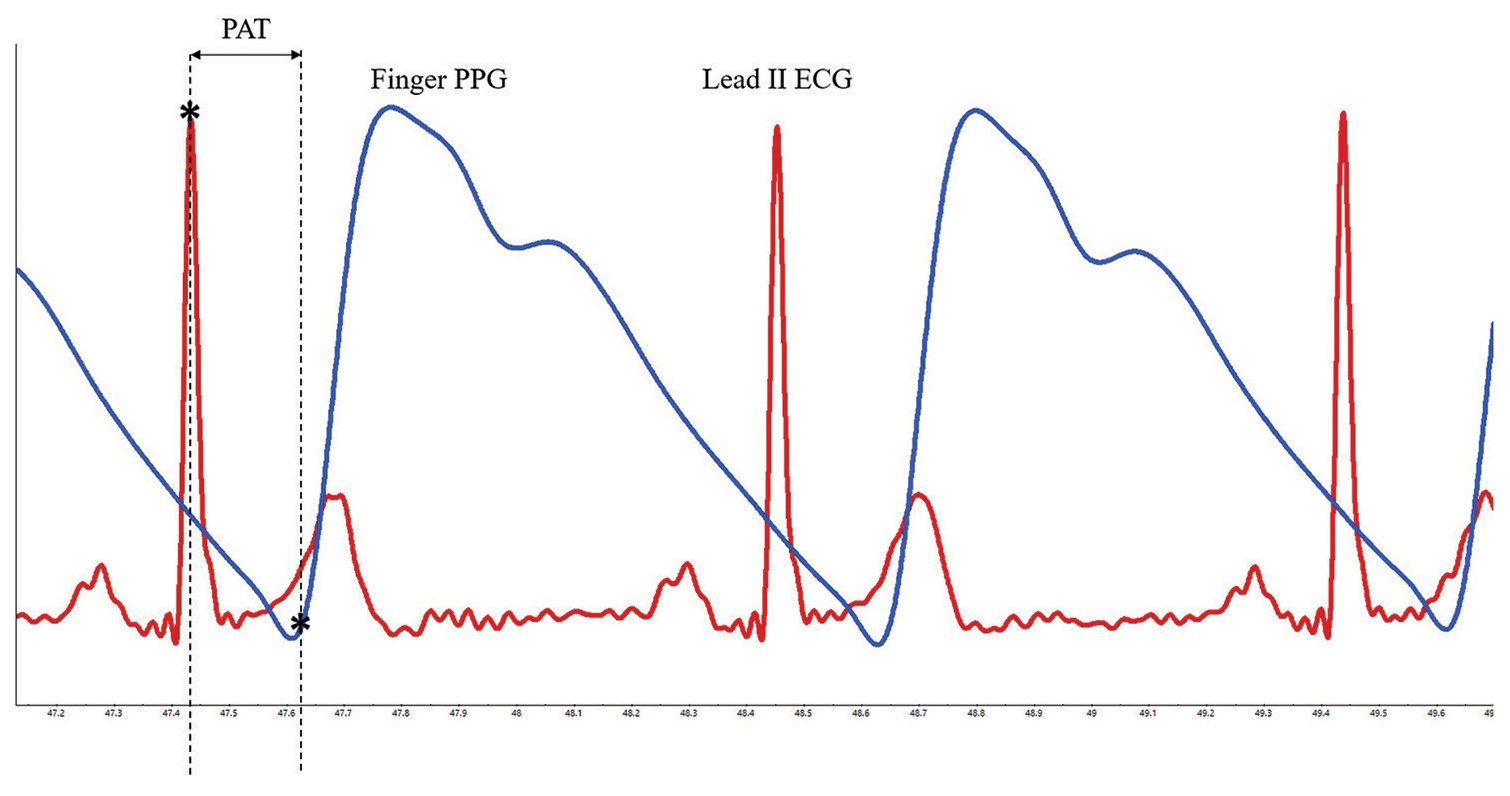
- Representative record showing the calculation of pulse arrival time in a healthy subject. Pulse arrival time (PAT), depicted by double headed arrow, was estimated as the time lag between two fiducial points, peak of R wave of Lead II electrocardiogram (ECG, denoted in red colour) and foot of finger photoplethysmography (PPG, denoted in blue colour) signal. The fiducial points are shown with*. Methodology was adopted from previous literature.
The variation in resting heart rate (HR) at the time of measurement was likely to have a bearing on the calculation of PAT since it would have a direct impact on the pre-ejection period (PEP), an important component of PAT. We computed a new parameter, PAT, normalised for HR of 75 (PAT75) to negate the difference between visit-to-visit variability in the HR of the subjects. Since such computation has not been done previously to the best of our knowledge, we calculated this parameter assuming a linear relationship between PAT and HR. Resting HR was derived from averaging HR from 5 min of ECG data obtained at rest. PAT75 was computed for HR of 75, assuming a linear relationship between PAT and HR. Similar normalisation has been used for the Augmentation Index (AIx), wherein AIx was computed for an HR of 75 to circumvent the effect of variation in resting HR for different measurements.[27,28]
The data thus obtained were tabulated using a spreadsheet program (Microsoft Excel 2021™, Microsoft Corporation, Redmond, USA). Further, statistical analysis was performed using MedCalc™ Statistical Software version 22.030 (MedCalc Software Ltd, Ostend, Belgium; https://www.medcalc.org; 2024). Gaussian fit was checked using the Shapiro–Wilk test. Repeated measures analysis of variance (ANOVA) with post hoc Bonferroni’s test was used to compare the parameters over different visits. P < 0.05 was considered as statistically significant. Assessment of repeatability was done using intraclass correlation coefficient (ICC) calculated as a two-way random effect model, ICC.[1,2]
RESULTS
A total of 31 subjects completed all five visits for the study. After excluding data with artefacts and noise, data from 21 subjects was included in the final analysis (10 males and 11 females). The mean age of subjects was 29.57 ± 5.65 years. While the height and weight of female subjects were significantly lower than their male counterparts (154.1 ± 5.61 cm vs. 171.1 ± 6.76 cm, respectively, P < 0.0001 unpaired t-test and 57.0 ± 11.45 kg vs. 73.5 ± 13.61 kg, respectively, P = 0.007, unpaired t-test), BMI was comparable between the females and males (23.93 ± 4.01 kg/m2 vs. 24.97 ± 3.33 kg/m2 P = 0.52, unpaired t-test).
There were no significant differences between the DBP and MBPs for the subjects recorded on five visits (P = 0.93 and 0.91, respectively, repeated measures ANOVA with post hoc test [Figures 2 and 3]). HR was significantly different between the visits (P = 0.031, repeated measures ANOVA with post hoc test). However, within-group comparison of HRs using post hoc tests did not demonstrate a statistically significant difference between means, which is likely due to the small sample size [Figure 4].
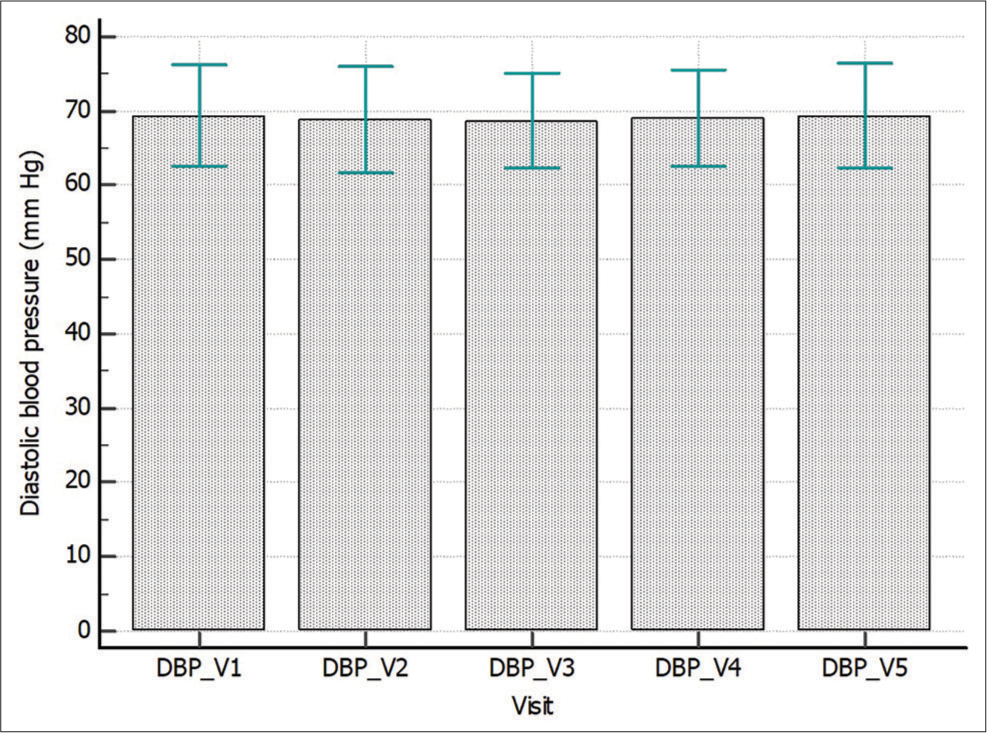
- Comparison of diastolic blood pressure (DBP) across different visits. Visit to visit DBP recorded in healthy subjects over five visits. Data expressed as mean ± standard deviation. There was no significant difference in DBP across 5 visits (P = 0.93, repeated measures analysis of variance with post hoc Bonferroni test). _V represents the visit number.
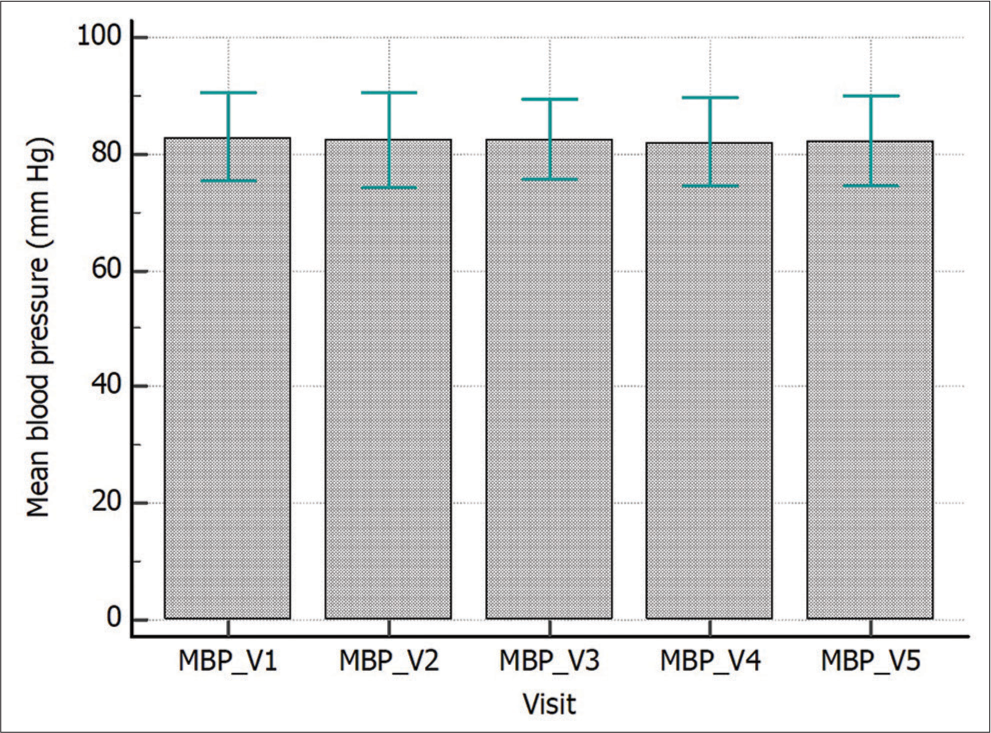
- Comparison of Mean blood pressure (MBP) across different visits. Visit to visit MBP recorded in healthy subjects over five visits. Data expressed as Mean ± standard deviation. There was no significant difference in MBP across 5 visits (P = 0.91, repeated measures analysis of variance with post hoc Bonferroni test). _V represents the visit number.
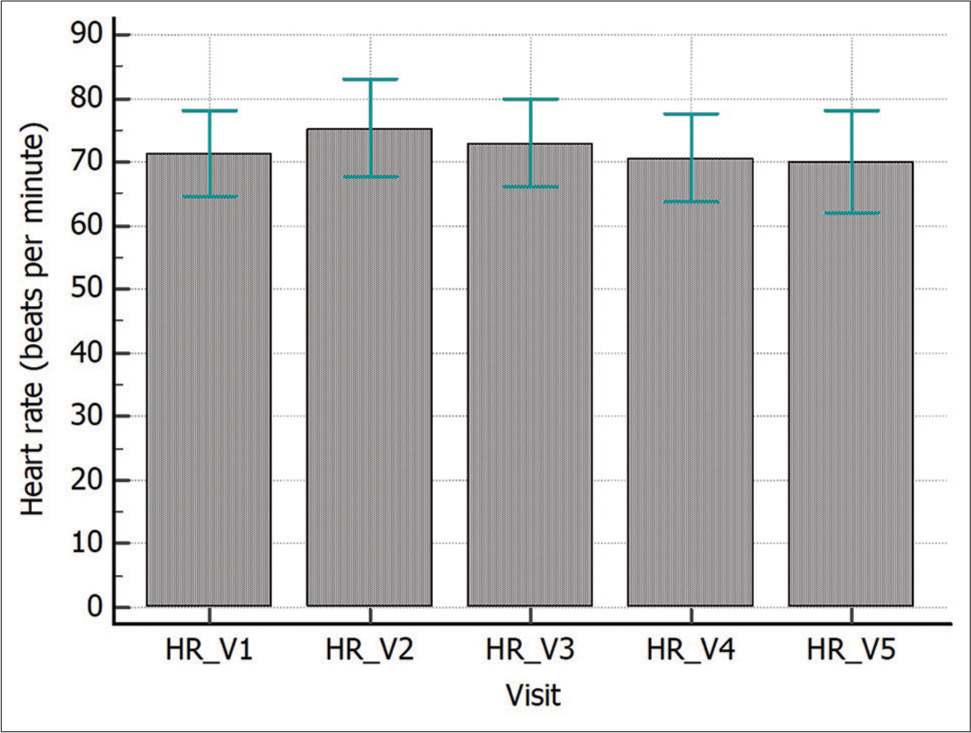
- Comparison of heart rate (HR) across different visits. Visit to visit HR recorded in healthy subjects over five visits. Data expressed as mean ± standard deviation. There was significant difference in HR across 5 visits (P = 0.013, repeated measures analysis of variance with post hoc Bonferroni test). However, post hoc between group comparisons did not show any significant difference amongst the groups. _V represents the visit number.
PAT values were compared for the subjects using repeated measures ANOVA with post hoc tests. The PAT value of the five visits was statistically comparable (P = 0.06, repeated measures ANOVA with post hoc test [Figure 5]). PAT normalised for HR 75 (PAT75) demonstrated a significant difference between the means obtained at different visits (P = 0.007, repeated measures ANOVA with post hoc test, [Figure 6]). The post hoc test revealed significantly lower values for visit 2 when compared with visit 1 (P = 0.04).
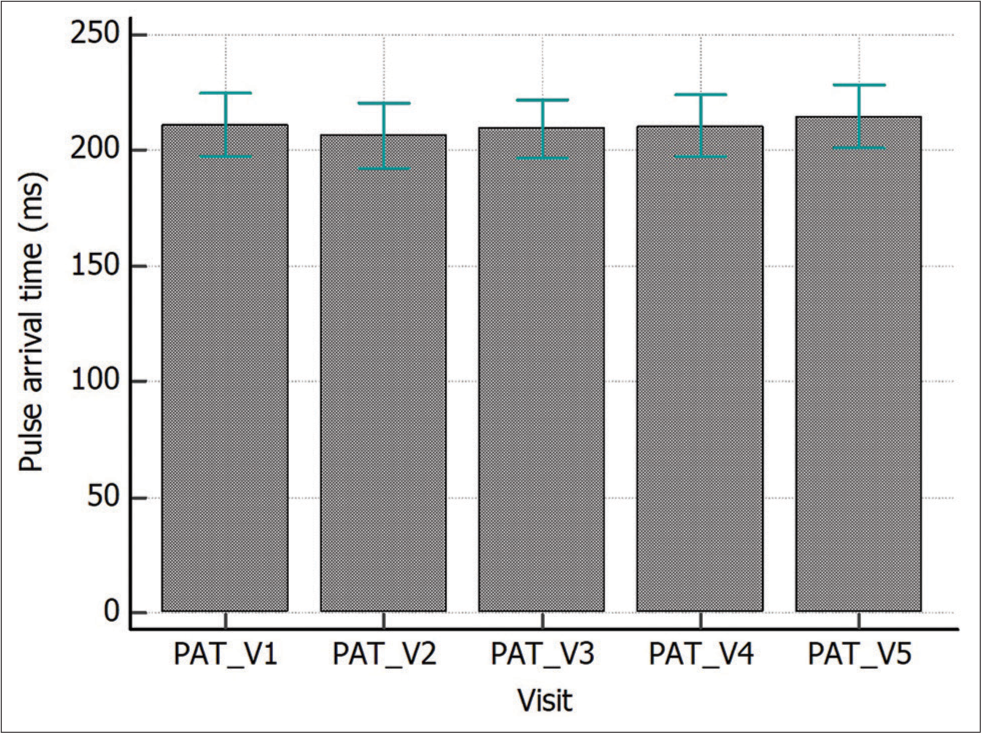
- Comparison of pulse arrival time (PAT) in healthy subjects. Visit to visit PAT recorded in healthy subjects over five visits. Data expressed as mean ± standard deviation. There was no statistically significant difference in PAT values (P = 0.06, repeated measures analysis of variance with post hoc Bonferroni test). _V represents the visit number.
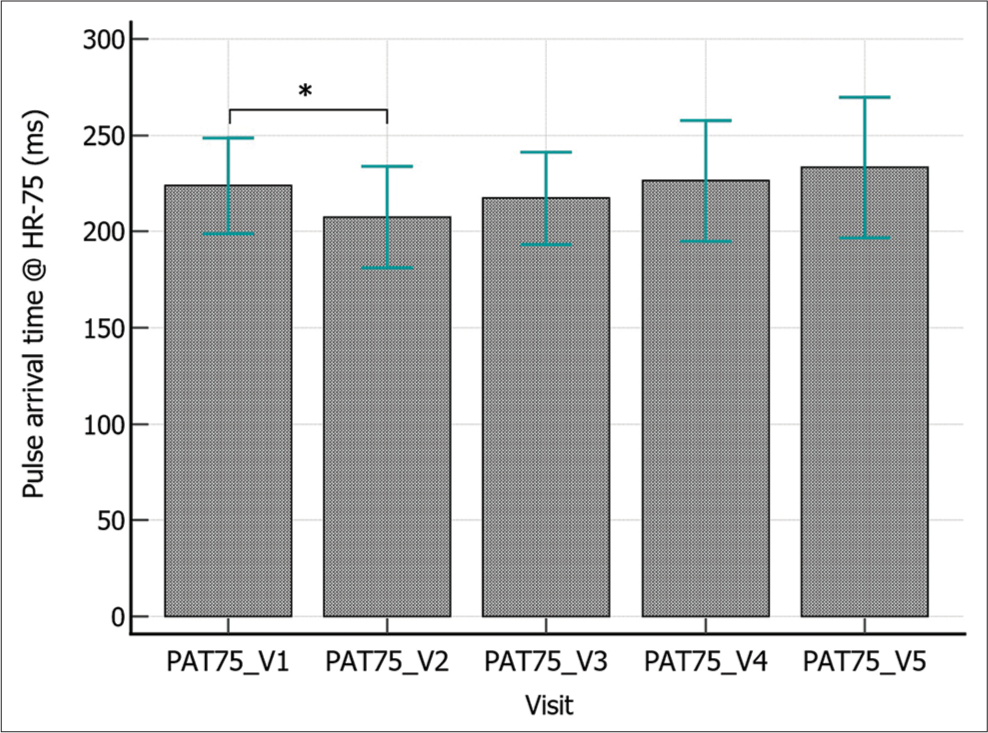
- Comparison of pulse arrival time for HR 75 (PAT75) in healthy subjects. Visit to visit PAT75 recorded in healthy subjects over five visits. Data expressed as mean ± standard deviation. PAT75 of visit 2 was significantly lower when compared with visit 1 (P = 0.007, repeated measures analysis of variance with post hoc Bonferroni test denoted by * in the figure). PAT75 for visits 3, 4 and 5 were higher than visit 2, but no statistically significant difference was observed. _V represents the visit number.
Assessment of repeatability by ICC for PAT demonstrated moderate repeatability (ICC = 0.57 [0.38, 0.76]) using a twoway random effects model. When repeatability was assessed for PAT normalised for HR of 75 (PAT75), ICC was further reduced to 0.38 (0.19, 0.61).
DISCUSSION
Vascular health is increasingly being recognised as an important parameter for cardiovascular morbidity and mortality. Assessment of vascular function employs a multi-pronged approach consisting of endothelial function assessment and vascular stiffness. Endothelial function is routinely assessed by flow-mediated release. [n, which provides an estimate of vasodilatory capability in response to shear stress-mediated nitric oxide release.[29,30] This is achieved by suprasystolic occlusion of the forearm with measurement of arterial diameter using ultrasound post occlusion release.
Vascular stiffness is another important parameter which is gaining importance as a marker for cardiovascular disease. Pressure waveform estimation at different sites along the arterial tree using tonometry is the gold standard of vascular stiffness assessment. ECG R wave gated or simultaneous acquisition of the pressure signal at a central and peripheral site provides an estimate of the stiffness of that arterial segment. While tonometry-based estimation provides a reliable estimate of stiffness, this is often associated with high hardware prices. High-fidelity pressure signal acquisition requires good-quality tonometers, which are responsible for the cost.
Therefore, PPG has emerged as a method of vascular stiffness measurement when acquired concomitantly with ECG. PAT denotes the time lag between the peak of the R wave and the foot of the PPG signal. Infra-red based reflectance type and transmittance type PPG probes are utilised for this purpose.[31] The acquisition of PPG signals by this technique is user-friendly, pain-free and allows good quality signal acquisition. With the integration of PPG in wearable devices, especially smartwatches, the day is not far when smartwatch users will be able to measure PAT right from the wrist. We would like to highlight that previously, the term PTT was used for this parameter,[23,25], but now the PTT is reserved for acquisition made using multiple PPG signals. Another promising use of PPG technology is a cuffless measurement of BP, which is an active area of research.[14,32-34]
PAT can be affected by a multitude of factors. Since the computation involves the estimation of the delay between the origin of the electrical impulse, leading to ventricular ejection and the arrival of the volume pulse at a distal site, the PEP is a vital component of this parameter. PEP is the time delay between ventricular depolarisation and ventricular ejection. It is affected by HR at the time of PAT measurement. In the present work, we observed a significant difference in HRs [Figure 4], wherein the afternoon values were higher than the other values. We could not observe a statistically significant difference in HRs on the post hoc test, probably due to our small sample size. Another important factor that can affect PAT is BP. We compared DBP and MBPs in our subjects and did not observe a statistically significant difference among the groups (P = 0.93 and 0.91, respectively, repeated measures ANOVA with post hoc test [Figures 2 and 3]).
Another important factor that may affect arterial stiffness, and thus PAT, is a meal. This was the rationale for the inclusion of afternoon measurement (PAT_V2) in our protocol. It has been reported that ingestion of high-fat meal leads to an increase in Pulse wave velocity and reduction in arterial wave reflection in healthy non-smoker males when observed over a 4 h period.[35] In another work, carotid-femoral pulse wave velocity was reported to increase after consumption of a high-fat meal in healthy adult males.[36] In a study by Kiran et al., intraday variation in arterial stiffness was assessed using a novel ultrasound-based ARTSENS™ device. The intraday variation was attributed to food intake.[37] However, we would like to emphasise that some reports negate the existence of diurnal variation in arterial stiffness, as assessed by pulse wave velocity.[38] In the present work, PAT was lower in the afternoon as compared to forenoon values (206.4 ± 3.04 ms vs 211.2 ± 2.94 ms, [Figure 5]), but no statistically significant difference was observed. When the values were normalised for an HR of 75, PAT-75 was significantly lower in the afternoon (207.6 ± 5.76 ms vs. 223.8 ± 5.43 ms [Figure 6]). This finding may be attributed to the effect of meal, as observed on HR and on PAT-75.
Gender differences in vascular parameters have been documented in previous studies, with female patients showing lower parasympathetic response in the Thai population.[39] However, we concede that we are unable to comment on this observation in view of our small sample size and the absence of hormonal profiles of the subjects. This may be an area of exploration in future work.
Among different surrogates of arterial stiffness, repeatability assessments have been done for a few parameters only. Beckmann et al. investigated the reproducibility of PPG-based PTT measurement in healthy subjects, but the sample size was very small (n = 5).[40] In another work, von Wowern et al. observed the ageing index to show the best repeatability among vascular stiffness parameters assessed from the PPG signal.[41] We could not find any report that has documented the repeatability assessment of PAT over a few days and extending to a long time frame of 1 month.
While PPG technology is omnipresent and holds great promise, it is imperative to check the test-retest reliability of this parameter. There are few, if any, studies that have assessed the short-term and long-term reliability of this parameter in health and disease. While PAT values were comparable across different visits [Figure 5], assessment of repeatability by ICC revealed only moderate repeatability. While there is no universally acceptable standard of delineating repeatability using ICC values, we chose guidelines mentioned in previous studies defining the parameter as moderate, good and excellent.[42] Our findings are important for future research, wherein PAT is planned to be used as a marker of arterial stiffness. This is because we observed only moderate visit-to-visit repeatability of this parameter in healthy adults. With the rapid pace taken by smartwatch technology, with PPG and ECG being easily measurable by them, we believe that PAT estimation by these consumer-grade devices is not very far. However, despite the technology being ubiquitous and the parameter being easy to measure and compute, more work is needed before bringing this parameter into the mainstream.
There are some limitations to our work. The study was done only in healthy adults without any co-existing cardiovascular disease. We believe that repeatability assessment needs to be undertaken in patients with existing vascular disease to explore the translational aspects of this index. Furthermore, the non-availability of continuous beat-to-beat BP measurement equipment at our end precluded continuous measurement, which would have provided greater credibility to our BP estimation. Based on our relatively small sample size, it was not possible to draw any meaningful inferences about gender differences (n = 10 and 11 males and females, respectively), if any, on the temporal reliability of PAT. The same can be explored in larger cohorts.
CONCLUSION
Notwithstanding these limitations, we can conclude from the present work that while PAT holds promise as a non-invasive and user-friendly marker of vascular stiffness, long-term repeatability may be investigated in larger populations before implementing it as a reliable surrogate of vascular ageing.
Declaration
Part of this work was presented as an e-poster at the Indian Society for Heart Research Conference 2024 by the corresponding author and was awarded the Prof N S Dhalla award for best poster in the basic science category.
Ethical approval
The research/study was approved by the Institutional Review Board at All India Institute of Medical Sciences Jodhpur, number 2021/3813, dated 8th September 2021.
Declaration of patient consent
The authors certify that they have obtained all appropriate patient consent.
Conflicts of interest
There are no conflicts of interest.
Use of artificial intelligence (AI)-assisted technology for manuscript preparation
The authors confirm that there was no use of artificial intelligence (AI)-assisted technology for assisting in the writing or editing of the manuscript and no images were manipulated using AI.
Financial support and sponsorship: Nil.
References
- Altered cardiac and vascular stiffness in pregnancy after a hypertensive pregnancy. J Hum Hypertens. 2023;37:189-96.
- [CrossRef] [Google Scholar]
- Estimated pulse wave velocity and all-cause mortality: Findings from the health and retirement study. Innov Aging. 2022;6:igac056.
- [CrossRef] [Google Scholar]
- Association of arterial stiffness with all-cause and cause-specific mortality in the diabetic population: A national cohort study. Front Endocrinol (Lausanne). 2023;14:1145914.
- [CrossRef] [Google Scholar]
- Arterial stiffness and 5-year mortality in patients with peripheral arterial disease. J Hum Hypertens. 2020;34:505-11.
- [CrossRef] [Google Scholar]
- Trajectories of arterial stiffness and all-cause mortality among community-dwelling older Japanese. Geriatr Gerontol Int. 2018;18:1108-13.
- [CrossRef] [Google Scholar]
- Assessing hemodynamics from the photoplethysmogram to gain insights into vascular age: A review from VascAgeNet. Am J Physiol Heart Circ Physiol. 2022;322:H493-522.
- [CrossRef] [Google Scholar]
- Photoplethysmography and its application in clinical physiological measurement. Physiol Meas. 2007;28:R1-39.
- [CrossRef] [Google Scholar]
- Respiration signals from photoplethysmography. Anesth Analg. 2013;117:859-65.
- [CrossRef] [Google Scholar]
- Respiratory rate monitoring in healthy volunteers by central photoplethysmography compared to capnography. J Biophotonics. 2022;15:e202100270.
- [CrossRef] [Google Scholar]
- Photoplethysmography and nociception. Acta Anaesthesiol Scand. 2009;53:975-85.
- [CrossRef] [Google Scholar]
- Photoplethysmography for the assessment of haemorheology. Sci Rep. 2017;7:1406.
- [CrossRef] [Google Scholar]
- Photoplethysmography for the assessment of arterial stiffness. Sensors (Basel). 2023;23:9882.
- [CrossRef] [Google Scholar]
- Comparison of photoplethysmographic and arterial tonometry-derived indices of arterial stiffness. Hypertens Res. 2012;35:228-33.
- [CrossRef] [Google Scholar]
- Continuous cuffless and noninvasive measurement of arterial blood pressure-concepts and future perspectives. Blood Press. 2022;31:254-69.
- [CrossRef] [Google Scholar]
- Pulse transit time based continuous cuffless blood pressure estimation: A new extension and a comprehensive evaluation. Sci Rep. 2017;7:11554.
- [CrossRef] [Google Scholar]
- How effective is pulse arrival time for evaluating blood pressure? Challenges and recommendations from a study using the MIMIC database. J Clin Med. 2019;8:337.
- [CrossRef] [Google Scholar]
- Cuff-less blood pressure estimation using pulse waveform analysis and pulse arrival time. IEEE J Biomed Health Inform. 2018;22:1068-74.
- [CrossRef] [Google Scholar]
- Pulse arrival time as a surrogate of blood pressure. Sci Rep. 2021;11:22767.
- [CrossRef] [Google Scholar]
- Photoplethysmography in noninvasive blood pressure monitoring In: Photoplethysmography technology. signal analysis and applications. United States: Academic Press; 2021. p. :359-99.
- [CrossRef] [Google Scholar]
- Toward ubiquitous blood pressure monitoring via pulse transit time: Theory and practice. IEEE Trans Biomed Eng. 2015;62:1879-901.
- [CrossRef] [Google Scholar]
- Strengthening the reporting of observational studies in epidemiology (STROBE) statement: Guidelines for reporting observational studies. BMJ. 2007;335:806-8.
- [CrossRef] [Google Scholar]
- The strengthening the reporting of observational studies in epidemiology (STROBE) statement: Guidelines for reporting observational studies. J Clin Epidemiol. 2008;61:344-9.
- [CrossRef] [Google Scholar]
- Impaired systemic vascular reactivity & raised high-sensitivity C reactive protein levels in chronic obstructive pulmonary disease. Indian J Med Res. 2016;143:205-12.
- [CrossRef] [Google Scholar]
- Monitoring of cardiovascular reactivity to cold stress using digital volume pulse characteristics in health and diabetes. J Clin Monit Comput. 2009;23:123-30.
- [CrossRef] [Google Scholar]
- Impaired endothelium mediated vascular reactivity in endogenous Cushing's syndrome. Endocr J. 2011;58:789-99.
- [CrossRef] [Google Scholar]
- Vascular responses to post occlusive reactive hyperemia and systemic inflammation in overlap syndrome of chronic obstructive pulmonary disease and obstructive sleep apnea. Indian J Physiol Pharmacol. 2016;60:155-66.
- [Google Scholar]
- Adjusting the aortic augmentation index for the resting heart rate. J Atheroscler Thromb. 2014;21:378-80.
- [CrossRef] [Google Scholar]
- Should the augmentation index be normalized to heart rate? J Atheroscler Thromb. 2014;21:11-6.
- [CrossRef] [Google Scholar]
- The temporal trend of vascular function in women with gestational diabetes. Vasc Med. 2017;22:96-102.
- [CrossRef] [Google Scholar]
- Regional arterial stiffness in central and peripheral arteries is differentially related to endothelial dysfunction assessed by brachial flow-mediated dilation in metabolic syndrome. Diab Vasc Dis Res. 2018;15:106-13.
- [CrossRef] [Google Scholar]
- Noninvasive monitoring by photoplethysmography. Clin Perinatol. 2012;39:573-83.
- [CrossRef] [Google Scholar]
- SeismoWatch: Wearable cuffless blood pressure monitoring using pulse transit time. Proc ACM Interact Mob Wearable Ubiquitous Technol. 2017;1:40.
- [CrossRef] [Google Scholar]
- Single-source PPG-based local pulse wave velocity measurement: A potential cuffless blood pressure estimation technique. Physiol Meas. 2017;38:2122-40.
- [CrossRef] [Google Scholar]
- Wearable cuff-less blood pressure estimation at home via pulse transit time. IEEE J Biomed Health Inform. 2021;25:1926-37.
- [CrossRef] [Google Scholar]
- Postprandial effect of dietary fat quantity and quality on arterial stiffness and wave reflection: A randomised controlled trial. Nutr J. 2013;12:93.
- [CrossRef] [Google Scholar]
- Central and peripheral arterial stiffness responses to uninterrupted prolonged sitting combined with a high-fat meal: A randomized controlled crossover trial. Hypertens Res. 2021;44:1332-40.
- [CrossRef] [Google Scholar]
- An in-vivo study on intra-day variations in vascular stiffness using ARTSENS Pen. Annu Int Conf IEEE Eng Med Biol Soc. 2018;2018:4575-8.
- [CrossRef] [Google Scholar]
- Diurnal variation and repeatability of arterial stiffness and cardiac output measurements in the third trimester of uncomplicated pregnancy. J Hypertens. 2017;35:2436-42.
- [CrossRef] [Google Scholar]
- Variation of autonomic nervous system function by age and gender in Thai ischemic stroke patients. Brain Sci. 2021;11:380.
- [CrossRef] [Google Scholar]
- Reproducibility of photoplethysmography-based local pulse transit time measurement. Annu Int Conf IEEE Eng Med Biol Soc. 2017;2017:246-9.
- [CrossRef] [Google Scholar]
- Digital photoplethysmography for assessment of arterial stiffness: Repeatability and comparison with applanation tonometry. PLoS One. 2015;10:e0135659.
- [CrossRef] [Google Scholar]
- A Guideline of selecting and reporting intraclass correlation coefficients for reliability research. J Chiropr Med. 2016;15:155-63.
- [CrossRef] [Google Scholar]


