
Translate this page into:
Handgrip strength deficit and time lag between symptom onset and starting of chemotherapy in pulmonary tuberculosis: A cross-sectional study in North India
*Corresponding author: Prashant Mishra, Department of Pharmacology, Armed Forces Medical College, Pune, Maharashtra, India. drpmafmc@gmail.com
-
Received: ,
Accepted: ,
How to cite this article: Mishra P, Bhargava S, Vihan S. Handgrip strength deficit and time lag between symptom onset and starting of chemotherapy in pulmonary tuberculosis: A cross-sectional study in North India. Indian J Physiol Pharmacol 2023;67:205-11.
Abstract
Objectives:
Wasting is the predominant systemic clinical manifestation of chronic diseases like tuberculosis (TB). Delay in diagnosis and therapy initiation may affect handgrip strength, severity and outcome of the disease. Limited data are available on this in the Indian context, despite a high prevalence of TB. This study aimed to estimate and correlate deficits in handgrip strength amongst sputum-positive and sputum-negative pulmonary TB patients in relation to the time lag between symptom onset and starting of antitubercular therapy (ATT).
Materials and Methods:
We conducted a cross-sectional study amongst newly diagnosed sputum-positive and sputum-negative pulmonary TB patients and age- and sex-matched apparently healthy volunteers. Handgrip strength of 341 newly diagnosed patients of TB was monitored within 1 week of starting ATT and analysed. Demographic details and clinical history of the participants were noted in the pre-designed form. The handgrip strength of 100 healthy volunteers was also taken for comparison.
Results:
The study findings suggest that deficits in handgrip strength amongst sputum-negative patients were more than sputum-positive patients in comparison to age- and sex-matched healthy controls. It took an average of 63 ± 27 days between the onset of symptoms and starting of ATT in sputum-negative patients in comparison to an average of 47 ± 12 days in sputum-positive patients.
Conclusion:
Early consultation by patients, rapid diagnosis of TB and the start of ATT, thereby decreasing the time lag between the symptom onset and start of ATT, may lead to a decreased deficit in handgrip strength with the improved overall health of patients. Extensive Information, Education and Communication activities and newer diagnostic modalities for early identification of cases and the start of chemotherapy are required for optimal management of TB patients.
Keywords
Tuberculosis
Handgrip strength
Antitubercular therapy
Sputum positive

INTRODUCTION
India has pledged to eliminate tuberculosis (TB) by 2025.[1] Early diagnosis with prompt and effective treatment is the key to achieve this goal. However, there is always a time lag between the onset of symptoms in a patient, a definitive diagnosis of TB and starting of antitubercular therapy (ATT). The period from the day of appearance of the first symptom till the diagnosis is called a diagnostic delay. This can happen due to patient delay or/and health system delay. Patient delay is the time interval between the onset of the first symptom(s) suggestive of TB such as cough, fever and first visit by the physician. Health system delay is the period from the first visit to the date of confirmation of TB by laboratory or radiological evidence. It is a known fact that decreased appetite and increased catabolism in TB can lead to or worsen preexisting undernutrition.[2] The time lag between the onset of symptom and ATT initiation may lead to more muscle wasting, which may affect the overall health, severity and outcome of the disease.[3,4] This may also worsen the well-being of TB patients and reduce their quality of life. Handgrip strength is a simple, reliable and inexpensive assessment tool for overall health and has demonstrated prognostic utility, but is rarely used during routine assessment of pulmonary diseases.[5] As more emphasis has been given presently on the quality of life of a patient as an outcome measure in the management of any disease, therefore, besides routine clinical, bacteriological and radiological assessments, it becomes imperative for health-care providers to comprehensively assess the patient of TB by including the overall health and patient’s own perception of the disease.[6] Several studies have suggested that there are deficits in the weight and handgrip strength amongst patients who are started on TB treatment.[7,8] However, the correlation between the time lag between the symptom onset and starting of ATT and handgrip strength deficits was found to be lacking in most of the studies. Delay in diagnosis and treatment initiation may lead to poor disease outcome or poor treatment outcome.[9,10] Limited data are available on this in the Indian context, despite a high prevalence of TB. Therefore, this cross-sectional study was designed with the aim to determine the correlation between handgrip strength deficits amongst sputum-positive and sputum-negative pulmonary TB patients in relation to the time lag between the symptom onset and initiation of ATT.
MATERIALS AND METHODS
This cross-sectional study was conducted at one of the directly observed treatment, short-course (DOTs) centres in a tertiary care hospital in the capital city of India from April 2019 to October 2020, after approval of the Institutional Ethics Committee. Adult outpatients visiting the DOTS centre who were diagnosed as new cases of pulmonary TB and were taking ATT for <10 days were screened and enrolled in the study after taking written informed consent. Patients having coinfection with HIV or any other chronic disorders such as chronic kidney disease, rheumatoid arthritis, coronary artery disease, diabetes mellitus and bronchial asthma were excluded from the study. Patients having any musculoskeletal disorder affecting the upper limb or patients taking any other drugs known to cause myopathy were also excluded from the study. Pregnant or nursing women were also not included in the study. The participants’ demographic profile, clinical features – onset and symptoms, investigational reports, diagnosis, treatment initiation and regimen plan were noted in a pre-designed case record form. Handgrip strength was measured using a handgrip dynamometer (Inco Pvt. Ltd). The measurements were carried out with the participant sitting with the arm flexed at 90°. Three readings were taken with each hand alternatively, and the highest reading obtained was taken as the maximum handgrip strength.
Statistical analysis
The data were entered in Microsoft Excel, and analysis was done using ‘IBM SPSS statistics (version 23.0)’. Descriptive statistics using the mean and standard deviation for continuous variables or frequency and percentage for categorical variables were employed for describing the sociodemographic and clinical characteristics of the study participants. As the data were normally distributed, one-way analysis of variance with post hoc Bonferroni correction was used for comparison between handgrip strength in healthy volunteers and sputum-positive and sputum-negative pulmonary TB patients. Effects of other variables on handgrip strength were assessed by multiple linear regressions. P < 0.05 was considered statistically significant.
RESULTS
A total of 522 TB patients reported and were screened during the study (April 2019–October 2020); out of which 341 patients meeting the inclusion criteria were included in the study. 100 apparently age- and sex-matched healthy volunteers were also enrolled from amongst the academic residents, staff and attendants accompanying the patient as the control group [Figure 1].

- Flowchart of study methodology. (n: Number, TB: Tuberculosis)
Demographic and baseline clinical characteristics
The mean age of the study participants was 32.24 ± 13.67 years and 29.56 ± 10.36 years in the sputum +ve and sputum –ve pulmonary tuberculosis groups, respectively. Amongst the healthy volunteers group, the mean age of the study participants was 29.92 ± 7.39 years. In the sputum +ve group, 27.7% (n = 28) were female and 72.3% (n = 73) were male. The males were 78.1% (n = 188) and females were 21.9% (n = 53) in the sputum −ve group. Most of the participants were unemployed (40.59% [n = 41] in the sputum +ve group and 47.50 % [n = 114] in the sputum −ve group) and were dependent on their spouse or parents for livelihood. These were mostly students and homemakers. The most common symptoms in the sputum +ve group were: cough (100%), fever (74%), weight loss (70%), loss of appetite (57%), dyspnoea (39%) and haemoptysis (39%). Whereas in the sputum –ve group, fever (65%), cough (44%), enlarged lymph node (35%) and weight loss (30%) were the more common presenting symptoms [Table 1 and Figure 2].
| Characteristics | Sputum +ve PTB (n=101) |
Sputum –ve PTB (n=240) |
|---|---|---|
| Age (Mean±SD) | 32.24±13.67 | 29.56±10.36 |
| Gender, n (%) | ||
| Male | 73 (72.3) | 188 (78.1) |
| Female | 28 (27.7) | 52 (21.9) |
| State, n (%) | ||
| New Delhi | 54 (53.46) | 137 (57.08) |
| Haryana | 13 (12.87) | 52 (21.67) |
| Uttar Pradesh | 25 (24.75) | 31 (12.92) |
| Rajasthan | 5 (4.95) | 8 (3.33) |
| Bihar | 4 (3.96) | 9 (3.75) |
| Madhya Pradesh | 0 (0) | 3 (1.25) |
| Occupation, n (%) | ||
| Teacher | 23 (22.77) | 21 (8.75) |
| Student | 27 (26.73) | 78 (32.50) |
| Labourer | 12 (11.88) | 31 (12.92) |
| Pvt Job | 17 (16.83) | 41 (17.08) |
| Homemaker | 14 (13.86) | 36 (15.00) |
| Govt Job | 8 (7.92) | 33 (13.75) |
| Income per month, n (%) | ||
| Up to 10,000 | 47 (46.53) | 137 (57.08) |
| 10,001–20,000 | 23 (22.77) | 39 (16.25) |
| 20,001–30,000 | 18 (17.82) | 27 (11.25) |
| 30,001–40,000 | 7 (6.93) | 15 (6.25) |
| 40,001–50,000 | 5 (4.95) | 13 (5.41) |
| > 50,000 | 1 (0.99) | 9 (3.75) |
| Smoking n, (%) | ||
| No | 91 (90.09) | 219 (91.25) |
| Yes | 10 (9.91) | 21 (8.75) |
| Alcohol, n(%) | ||
| No | 85 (84.15) | 196 (81.66) |
| Yes | 16 (15.85) | 44 (18.34) |
| Tobacco, n(%) | ||
| No | 92 (91.09) | 211 (87.92) |
| Yes | 9 (8.91) | 29 (12.08) |
PTB: Pulmonary tuberculosis, EPTB: Extra pulmonary tuberculosis. SD: Standard deviation, n: Number
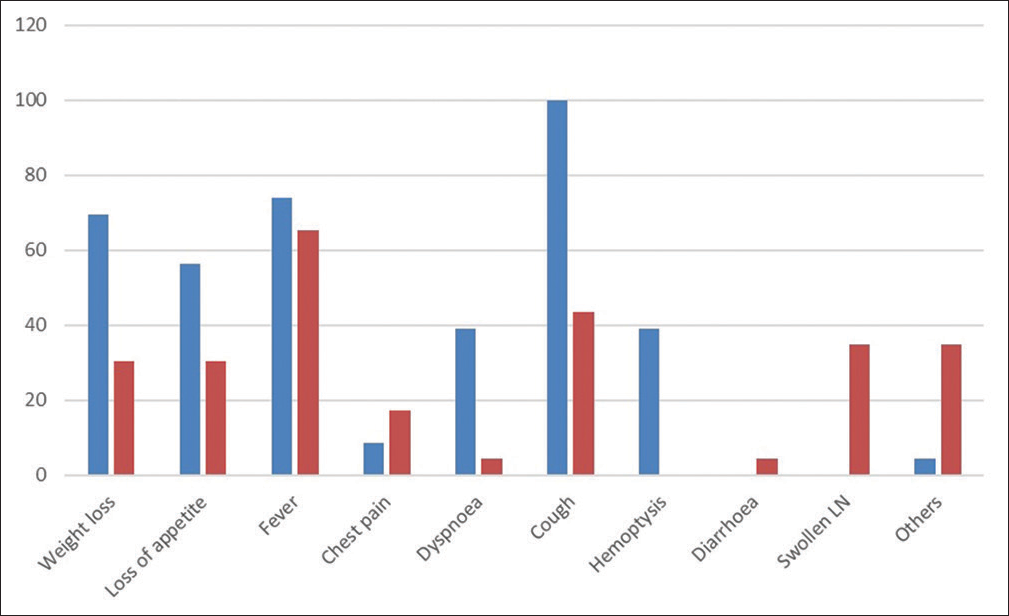
- Frequency of symptoms in the sputum +ve (indicated by blue bar) and sputum –ve (indicated by red bar) pulmonary tuberculosis groups.
Time lag between the symptom onset and treatment initiation
The mean time lag between the symptom onset and initiation of ATT was 37 ± 12 and 53 ± 27 days in the sputum +ve and sputum –ve cases, respectively, as shown in [Table 2]. Patients were asked the first dates of symptom onset, healthcare provider consultation and diagnosis. Patient treatment cards were also cross-checked. Then, the interval between illness onset and ATT initiation was calculated.
| Characteristic | Sputum +ve pulmonary TB (n=101) | Sputum –ve pulmonary TB (n=240) | ||
|---|---|---|---|---|
| Mean | SD | Mean | SD | |
| Mean time lag between the symptom onset and initiation of therapy (days) | 37 | 12 | 53 | 21 |
SD: Standard deviation, TB: Tuberculosis, n: Number
Handgrip strength
The handgrip strength was 27.13 ± 9.21, 25.22 ± 7.61 and 35.43 ± 7.49 in the sputum +ve, sputum –ve and healthy volunteers, respectively, as shown in [Table 3]. There was a significant decrease in the handgrip strength both in the sputum +ve (P < 0.01) and sputum –ve (P < 0.001) patients in comparison to healthy volunteers. The decrease in handgrip strength amongst the sputum –ve patients was more than the sputum +ve patients (P < 0.05).
| Characteristic | Sputum +ve pulmonary TB (n=101) | Sputum –ve pulmonary TB (n=240) | Healthy volunteers (n=100) | |||
|---|---|---|---|---|---|---|
| Mean | SD | Mean | SD | Mean | SD | |
| Handgrip strength (kg) | 27.13* | 9.11 | 25.22*@ | 7.31 | 34.43 | 6.49 |
@P<0.05 in comparison to sputum+ve, *P<0.001 in comparison to healthy volunteers. One-way analysis of variance with post hoc Bonferroni correction.
SD: Standard deviation. TB: Tuberculosis, n: Number
Time lag between the symptom onset and ATT initiation and handgrip strength
A subgroup analysis was performed based on the time lag between the symptom onset and ATT initiation. Our study finding indicates that increased time lag between the symptom onset and ATT initiation results in lesser handgrip strength amongst the patients as depicted in [Table 4 and Figure 3].
| Time lag between the symptom onset and ATT initiation |
No. of patients | Mean handgrip strength (kg) | -value |
|---|---|---|---|
| Mean±SD | |||
| <30 days | 45 | 29.13±6.21 | 0.001^ |
| 31–60 days | 214 | 27.43±5.21 | 0.032* |
| 61–120 days | 72 | 24.45±6.21 | 0.013* |
| ≥121 days | 10 | 22.13±4.21 | 0.005* |
^In comparison to healthy volunteer, *In comparison to<30 days group. One-way analysis of variance with post hoc Bonferroni correction. SD: Standard deviation, ATT: Antitubercular therapy
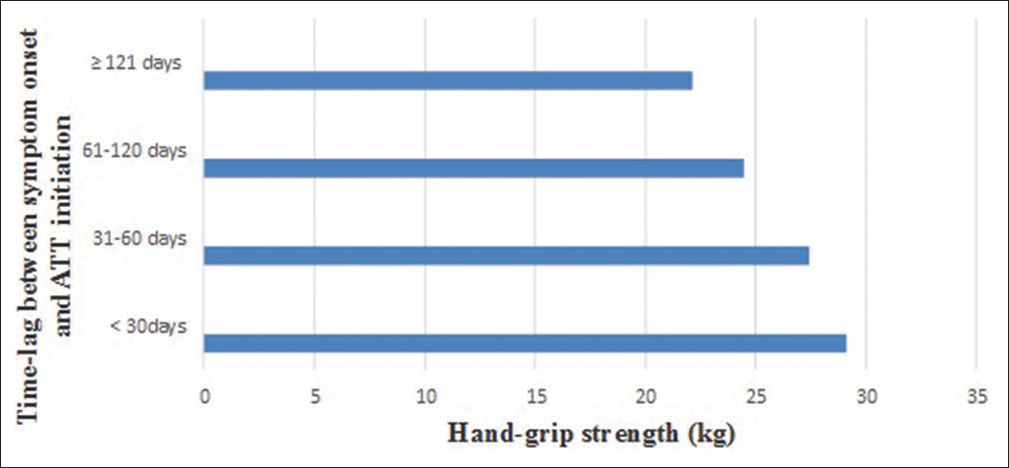
- Handgrip strength variation with an increasing time lag between the symptom onset and antitubercular therapy (ATT) initiation.
Effects of other variables on handgrip strength using multiple linear regression analysis
Multiple linear regression analysis was performed with handgrip strength as a dependent variable. Age, gender, state, occupation, smoking, alcohol and tobacco status were kept in model as a predictor variable. The model was found to be significant (F [7, 43] = 6.92; R2 = 0.463, P < 0.001). Our study found that gender and alcohol intake may affect handgrip strength. When gender is changed from male to female, the handgrip strength changed by 0.678 unit times, and when alcohol intake history was changed from negative to positive, the handgrip strength changed by 0.280 unit times [Table 5].
| Coefficientsa | ||||||
|---|---|---|---|---|---|---|
| Model | Unstandardised coefficients | Standardised coefficients | t | Sig. | ||
| B | SE | Beta | ||||
| 1 | (Constant) | 19.312 | 3.835 | 5.035 | 0.000 | |
| Age | −0.048 | 0.096 | −0.067 | −0.502 | 0.618 | |
| Gender | 11.927 | 2.047 | 0.678 | 5.827 | 0.000 | |
| State | −0.038 | 0.727 | −0.006 | −0.052 | 0.959 | |
| Occupation | 0.525 | 0.654 | 0.089 | 0.803 | 0.427 | |
| Smoking | −2.659 | 3.498 | −0.110 | −0.760 | 0.452 | |
| Alcohol | 6.432 | 2.958 | 0.280 | 2.174 | 0.036 | |
| Tobacco | −7.447 | 4.123 | −0.211 | −1.806 | 0.078 | |
DISCUSSION
TB is a chronic granulomatous disorder caused by Mycobacterium tuberculosis with muscle wasting not only as a prominent clinical feature of TB but also as one of the determinants of the disease severity and outcome.[11] Changes in weight gain and handgrip strength after effective antimicrobial chemotherapy for TB have been reported by previous researchers.[12-14] However, the data on the association between handgrip strength deficit and the time lag between the symptom onset and start of ATT are sparse. This cross-sectional study was undertaken to find the relationship between handgrip strength deficits and the time lag period between the symptom onset and start of ATT.
Prompt diagnosis and early initiation of ATT are important for the management of TB. In spite of the impressive framework of the national TB programme and its performance in the management of TB, there can be a delay in diagnosis and ATT initiation. This may be due to patient ignorance, myriad clinical presentations of TB associated with other comorbidities, different health-seeking behaviour patterns, late consultation by the patients and inadequate healthcare infrastructure available at the particular site. In our study, we found a mean time lag of 37 ± 12 and 53 ± 27 days between the symptom onset and initiation of ATT in the sputum +ve and sputum –ve cases, respectively. Similar delays were reported for sputum +ve pulmonary TB in other studies like Gosoniu et al. at Malawi (33.5 days)[15] and Bassili et al.[16] at Yemen (35 days) and in Iraq (36 days). The diagnostic delay in our study is much lower than the study reported by Lacroix et al. in Canada in 2007 (83 days),[17] Lawn and Griffin in Ghana (4 months),[18] Pronyk et al. (2001) in South Africa (10 weeks),[19] Machado et al. in Brazil (68 days),[20] and Ward et al. in Queensland (66 days).[21] A study from Tamil Nadu by Rajeswari et al.[22] in the early period of the introduction of the DOTS programme (1997–1998) showed a median diagnostic delay of 60 days. Patient delay (55.6%) contributed more than the health system delay (44.4%). Another study conducted in India by Gosoniu et al. also showed a longer median diagnostic delay of 74 days.[15] However, a study by Phoa et al.[23] in Singapore showed a median diagnostic delay of 4 weeks, which was lower than our findings. No separate study data are available for the time lag between the symptom onset and ATT initiation for sputum –ve cases. Studies have shown that TB carries a strong social stigma, and the fear of being diagnosed with TB might prevent some patients from seeking timely consultation.[15,24-26]
Undernutrition increases the risk of developing active TB disease and may also determine the severity of the disease. [27] TB can also, directly and indirectly, cause undernutrition through metabolic and pathophysiological changes such as reduced appetite, ability to eat, side effects of anti-TB drug treatment and impacts of the disease and treatment on household income, resulting in clinical wasting and decreased muscle strength.[28,29] The hand grip strength (HGS) deficit observed in our study is less in comparison to that reported in other studies.[30,31] This may be due to difference in ethnicity and baseline nutritional status/ nutritional support to the enrolled participants. Nutritional support and dietary advice may be necessary to facilitate the reversal of HGS deficit and treatment outcomes in patients with TB.
TB diagnosis and treatment currently revolve around clinical features and microbiology. There is a definite need for early diagnosis of TB and initiation of ATT. Governments and programme managers need to step up sociocultural reforms and health education and provide additional incentives to patients, to counter impairment in HGS. Being a cross-sectional single-centre study may limit the generalisability of results from this study. The inclusion of nutritional history and its influence on the studied parameter may have resulted in more information but was not a part of our study. Despite the above limitations, this study assessed the effect of time lag (between the onset of symptoms and initiation of ATT) on handgrip strength. Results from this study highlighted the relevance and utility of an easily administrable tool of handgrip strength as a reliable, inexpensive objective tool for regular monitoring of ATT therapy in pulmonary TB and emphasised on the early diagnosis and timely initiation of ATT.
CONCLUSION
TB is a chronic granulomatous disease where wasting and malnutrition may play an important role in the clinical progression of TB. Delay in diagnosis and treatment initiation may lead to increased disease severity and inadequate treatment outcomes. In our study, we found a significant correlation between handgrip strength deficit and time lag between the symptom onset and initiation of ATT. The diagnostic delay in TB reported in this study was lower than in other studies from India; however, it needs further reduction. Interventions to improve knowledge and awareness of the disease amongst the general population and to increase the availability of healthcare infrastructure at sites are critically important to decrease the delay between diagnosis and ATT initiation. Monitoring of HGS as a tool for monitoring and predicting the ATT response during the post-ATT follow-up period may be explored in future studies.
Acknowledgement
Investigator greatly acknowledges the help and support from the DOTs centre and thanks the participants who were part of this study.
Declaration of patient consent
The authors certify that they have obtained all appropriate patient consent.
Conflicts of interest
There are no conflicts of interest.
Financial support and sponsorship
Nil.
References
- Central TB Division Directorate General of Health Services, India TB Report 2018 New Delhi, India: Ministry of Health and Family Welfare; 2018.
- [Google Scholar]
- Malnutrition and infection: Complex mechanisms and global impacts. PLoS Med. 2007;4:e115.
- [CrossRef] [PubMed] [Google Scholar]
- Decreased plasma leptin concentrations in tuberculosis patients are associated with wasting and inflammation. J Clin Endocrinol Metab. 2002;87:758-63.
- [CrossRef] [PubMed] [Google Scholar]
- Interleukin-6 and human immunodeficiency virus load, but not plasma leptin concentration, predict anorexia and wasting in adults with pulmonary tuberculosis in Malawi. J Clin Endocrinol Metab. 2005;90:4771-6.
- [CrossRef] [PubMed] [Google Scholar]
- Malnutrition and infection: Complex mechanisms and global impacts. PLoS Med. 2007;4:e115.
- [CrossRef] [PubMed] [Google Scholar]
- Hand-grip dynamometry predicts future outcomes in aging adults. J Geriatr Phys Ther. 2008;31:3-10.
- [CrossRef] [PubMed] [Google Scholar]
- Biomarkers for tuberculosis disease activity, cure, and relapse. Lancet Infect Dis. 2009;9:162-72.
- [CrossRef] [PubMed] [Google Scholar]
- Weight, body composition and handgrip strength among pulmonary tuberculosis patients: A matched cross-sectional study in Mwanza, Tanzania. Trans R Soc Trop Med Hyg. 2011;105:140-7.
- [CrossRef] [PubMed] [Google Scholar]
- Problems of HRQL assessment: How much is too much? J Clin Epidemiol. 2001;54:1081-5.
- [CrossRef] [PubMed] [Google Scholar]
- Socio-economic impact of tuberculosis on patients and family in India. Int J Tuberc Lung Dis. 1999;3:869-77.
- [Google Scholar]
- Generic and specific measurement of health-related quality of life in a clinical trial of respiratory rehabilitation. J Clin Epidemiol. 1999;52:187-92.
- [CrossRef] [PubMed] [Google Scholar]
- Epidemiology and infection in famine and disasters. Epidemiol Infect. 1991;107:241-51.
- [CrossRef] [PubMed] [Google Scholar]
- Nutritional status in Malawian patients with pulmonary tuberculosis and response to chemotherapy. Eur J Clin Nutr. 1988;42:445-50.
- [Google Scholar]
- Nutritional status and weight gain in patients with pulmonary tuberculosis in Tanzania. Trans R Soc Trop Med Hyg. 1996;90:162-6.
- [CrossRef] [PubMed] [Google Scholar]
- Gender and socio-cultural determinants of delay to diagnosis of TB in Bangladesh, India and Malawi. Int J Tuberc Lung Dis. 2008;12:848-55.
- [Google Scholar]
- Diagnostic and treatment delay in tuberculosis in 7 countries of the Eastern Mediterranean region. Infect Dis Clin Pract. 2008;16:23-35.
- [CrossRef] [Google Scholar]
- The delay in diagnosis of tuberculosis in the Monteregie region of Quebec, Canada. Mcgill J Med. 2008;11:124-31.
- [CrossRef] [Google Scholar]
- The irreversible cost of delayed diagnosis of tuberculosis in HIV co-infected persons in sub-Saharan Africa. Int J Tuberc Lung Dis. 2001;5:200-1.
- [Google Scholar]
- Assessing health seeking behaviour among tuberculosis patients in rural South Africa. Int J Tuberc Lung Dis. 2001;5:619-27.
- [Google Scholar]
- Factors associated with delayed diagnosis of pulmonary tuberculosis in the state of Rio de Janeiro, Brazil. J Bras Pneumol. 2011;37:512-20.
- [CrossRef] [PubMed] [Google Scholar]
- Patient and health care system delays in Queensland tuberculosis patients, 1985-1998. Int J Tuberc Lung Dis. 2001;5:1021-7.
- [Google Scholar]
- Factors associated with patient and health system delays in the diagnosis of tuberculosis in South India. Int J Tuberc Lung Dis. 2002;6:789-95.
- [Google Scholar]
- Characteristics of patients with delayed diagnosis of infectious pulmonary tuberculosis. Respirology. 2005;10:196-200.
- [Google Scholar]
- Pulmonary tuberculosis and health-seeking behaviour: How to get a delayed diagnosis in Cali, Colombia. Trop Med Int Health. 1998;3:138-44.
- [CrossRef] [PubMed] [Google Scholar]
- Gender and tuberculosis control: Perspectives on health seeking behaviour among men and women in Vietnam. Health Policy. 2000;52:33-51.
- [CrossRef] [PubMed] [Google Scholar]
- Perception and social consequences of tuberculosis: A focus group study of tuberculosis patients in Sialkot, Pakistan. Soc Sci Med. 1995;41:1685-92.
- [CrossRef] [PubMed] [Google Scholar]
- Are Asians at greater mortality risks for being overweight than Caucasians? Redefining obesity for Asians. Public Health Nutr. 2009;12:497-506.
- [CrossRef] [PubMed] [Google Scholar]
- A consistent log-linear relationship between tuberculosis incidence and body mass index. Int J Epidemiol. 2010;39:149-55.
- [CrossRef] [PubMed] [Google Scholar]
- The relationship between malnutrition and tuberculosis: Evidence from studies in humans and experimental animals. Int J Tuberc Lung Dis. 2004;8:286-98.
- [Google Scholar]
- Defining catastrophic costs and comparing their importance for adverse tuberculosis outcome with multi-drug resistance: A prospective cohort study, Peru. PLoS Med. 2014;11:e1001675.
- [CrossRef] [PubMed] [Google Scholar]
- Changes in body composition and strength during initial treatment in malnourished patients with tuberculosis. Eur Respir J. 2019;54(Suppl 63):PA5277.
- [CrossRef] [Google Scholar]


