
Translate this page into:
Neuro-cardiovascular correlates of controlled slow yogic breathing: A pilot study

*Corresponding author: Om Lata Bhagat, Department of Physiology, All India Institute of Medical Sciences, Jodhpur, Rajasthan, India. omlatabhagat@gmail.com
-
Received: ,
Accepted: ,
How to cite this article: Kharya C, Bhagat O, Deepak KK. Neuro-cardiovascular correlates of controlled slow yogic breathing: A pilot study. Indian J Physiol Pharmacol. doi: 10.25259/IJPP_546_2023
Abstract
Objectives:
We assessed the frontal cerebral hemodynamic alterations and neuro-cardiovascular interactions during alternate nostril breathing (ANB), a slow yogic breathing manoeuvre.
Material and Methods:
Five healthy male volunteers (age 30 ± 3.8 years) practised ANB for 5 min at five breaths per minute with the timing ratio (seconds) of 4:2:4:2 (inspiration: Pause: Expiration: Pause). We recorded 16 channels of functional near-infrared spectroscopy at the prefrontal cortex (PFC) region of the brain, electrocardiography, beat-to-beat arterial blood pressure (BP), respiratory movements and end-tidal carbon dioxide (ETCO2) for 5 min each: Pre (T0), during (T1) and post-ANB (T2). ETCO2, oxy-haemoglobin (oxy-Hb), deoxy-haemoglobin (deoxy-Hb), total haemoglobin (HbT) concentrations and time domain parameters of heart rate variability (HRV), BP variability (BPV) and baroreflex sensitivity (BRS) were calculated.
Results:
In comparison to T0, the oxy-Hb and time domain parameters of HRV and BPV at the left lower region of the PFC were significantly increased at T1. Up-BRS-SBP showed a trend of enhancement during the manoeuvre. A significant optically measured HbT concentration with a corresponding decrease in deoxy-Hb was observed at T1.
Conclusion:
Optically measured Oxy-Hb and HbT increased gradually with the increased practice of ANB, with a simultaneous decrease in deoxy-Hb suggesting a cerebral activation during ANB that may be predominantly in ventromedial PFC. Both baroreflex and mechanical mechanisms appear responsible for the improved neurovascular coupling. Slow yogic breathing may have beneficial effects in disorders that involve cerebral hypoactivation.
Keywords
Alternate nostril breathing
Brain oxygenation
Cerebral activation
Prefrontal cortex
Functional near-infrared spectroscopy

INTRODUCTION
Multiple regulatory mechanisms play a role in coupling between breathing, heart rate and blood pressure (BP) through central cardiovascular control, baroreflex, chemoreflex and mechanical control. Recent findings indicate that various yogic breathing techniques, meditations and yogic practices may influence the frontal hemodynamic responses, resulting in frontal activation. Singh et al. reported that right nostril breathing (at the rate of 4 breaths per minute [bpm]) activated the left prefrontal cortex (PFC) using functional near-infrared spectroscopy (fNIRS).[1] Prefrontal activation during meditation occurs differently in long-term practitioners and non-practitioners. An increase in oxy-haemoglobin (oxy-Hb) and a decrease in deoxy-haemoglobin (deoxy-Hb) were observed in meditation practitioners.[2-4] Thus, the published studies have shown that slow yogic breathing may have the potential to influence cerebral activation. However, there is a lack of insight into the interplay of central and cerebral haemodynamics, which could help us understand the interactions between the systems of the body and to decipher neuro-cardiovascular coupling. To further comprehend the neuro-cardiovascular correlates during controlled slow yogic breathing, the present study aimed to assess hemodynamic activity in the PFC region using fNIRS along with heart rate variability (HRV), BP variability (BPV), baroreflex sensitivity (BRS) and end-tidal carbon dioxide (ETCO2) during alternate nostril breathing (ANB).
MATERIAL AND METHODS
Study design
This study is an interventional study of the before–after (pre– post) type, with a single arm and no comparator arm. The sole basis for concluding the study is the temporal relationship between the measurements done at 3 time points: pre (T0), during (T1), and post-ANB (T2).
Subjects
Subjects willing to volunteer were recruited through the advertisement posted on the departmental notice board. Healthy male volunteers with no history of medical problems and no regular yoga practice were inducted into the study after obtaining written informed consent (n = 5; age 30 ± 3.8 years). The experimental protocol was explained, and ANB was taught. Ethical clearance was obtained from the Institute’s Ethics Committee before commencement (Ref. No. IESC/T156/30-03-2012).
Experimental protocol
Volunteers were asked to have a light meal at least 2 h before the recordings. Once reached, they were made to rest for 15 min in sitting. Then, electrocardiography (ECG) electrodes and 16 fNIRS optodes were placed, and the signals were checked. Other sensors, such as nasal canula for carbon dioxide and finometer for BP, were attached to the subject. The data for ECG, ETCO2, beat-to-beat BP and brain oxygenation were recorded throughout the study period. The recording period spanned a total of 15 min (5 min each for pre-ANB [T0], during ANB [T1] and post-ANB [T2]).
The manoeuvre of ANB
ANB is performed with one nostril closed at a time. The detailed procedure for doing ANB is described in the previous study.[5]
Data collection and analysis
In the present study, Biopac MP150 (BIOPAC Systems, Inc., U.S.A.) with software ACQ version 4.2, Finometer (Finapres Medical Systems, The Netherlands), Capnograph (L & T, India) and fNIRS Model 1100-W (BIOPAC Systems, Inc., U.S.A) were used to acquire physiological signals. ECG100C and RSP100C amplifiers were used to simultaneously record lead II ECG and respiratory movements. Non-invasive beat-to-beat BP recording was done using the Finometer. All signals were acquired at a sampling frequency of 1KHz. Capnograph was used for ETCO2 measurements, and the output signal was also received simultaneously on the ACQ platform. fNIRS was used to acquire 16 channels of continuous wave fNIRS signals. Details of fNIRS imaging are described elsewhere.[6] Cognitive Optical Brain Imaging Studio software was used for fNIRS signal acquisition. Software ‘fNIRS Soft’ was used to evaluate prefrontal hemodynamic changes. The sampling rate was 2 Hz, and it gave 600 values of oxy-Hb, deoxy-Hb, HbT and oxygenation for the recording of T0, T1 and T2 (300 s each).
The HRV, BPV and BRS were calculated using Nevrokard™ software version 3.2.0 (Nevrokard Kiauta d.o.o, Izola, Slovenia). Only time domain parameters of HRV (standard deviation of NN intervals [SDNN], NN50 count divided by the total number of all NN intervals [pNN50] ×100, the square root of the mean of the sum of the squares of differences between adjacent NN intervals [RMSSD]) and BPV (SDNN and RMSSD) were considered for analysis as frequency domain parameters were interfered with by constant respiratory frequency.
Statistical analysis
Data were screened for normality assumption using the Kolmogorov–Smirnov test and repeated measure analysis of variance was applied to compare means with post hoc analysis using GraphPad Prism 5.0 (GraphPad Software Inc., CA 92037 USA). P ≤ 0.05 was considered significant.
RESULTS
fNIRS analysis
We analysed the obtained data in the following ways to better understand the observations and decipher them based on temporal and spatial outcomes [Table 1].
| Variable | PFC Location | Pre-ANB (T0) | During-ANB (T1) | Post-ANB (T2) | % Change (T1-T0) | % Change (T2-T0) |
|---|---|---|---|---|---|---|
| Oxy-Hb | PFC (1-16) optodes | 0.18±0.75 | 1.09±1.19 | 0.92±1.43 | 515.60 | 418.27 |
| Upper PFC (Odd) | 0.13±0.59 | 0.62±1.14 | 0.50±1.29 | 359.32 | 273.85 | |
| Lower PFC (Even) | 0.15±0.84 | 1.39±1.30 | 1.20±1.58 | 809.44* | 689.52* | |
| Left PFC: (1–8) | 0.07±0.66 | 1.13±1.04 | 0.98±1.26 | 1539.73* | 1319.09* | |
| Right PFC: (9–16) | 0.30±0.86 | 1.01±1.41 | 0.86±1.64 | 252.53 | 187.89 | |
| Deoxy-Hb | PFC (1–16) optodes | 0.42±0.46 | 0.30±0.69 | 0.53±0.54 | −29.40 | 23.86 |
| Upper PFC (Odd) | 0.48±0.51 | 0.19±1.09 | 0.47±0.93 | −60.55 | −1.07 | |
| Lower PFC (Even) | 0.55±0.81 | 0.44±1.66 | 0.69±0.91 | −19.3 | 12.53 | |
| Left PFC: (1–8) | 0.52±0.68 | 0.44±1.19 | 0.52±0.75 | −16.08 | −0.97 | |
| Right PFC: (9–16) | 0.34±0.3 | 0.17±0.79 | 0.55±0.55 | −50.02 | 62.37 | |
| HbT | PFC (1–16) optodes | 0.61±0.98 | 1.40±1.67 | 1.45±1.80 | 127.65 | 136.72 |
| Upper PFC (Odd) | 0.42±1.03 | 0.81±2.03 | 1.03±2.29 | 92.54 | 143.75 | |
| Lower PFC (Even) | 0.81±1.51 | 1.98±3.03 | 1.92±2.17 | 146.01* | 138.56* | |
| Left PFC: (1–8) | 0.59±1.13 | 1.57±2.09 | 1.49±1.86 | 165.63* | 153.18* | |
| Right PFC: (9–16) | 0.64±0.91 | 1.22±1.70 | 1.41±1.88 | 92.36 | 121.43 |
All data are represented as mean±Standard deviation. Percentage change=(T1-T0)/T0×100 (similarly for T2) (values indicate a significant increase in Oxy-Hb and Total-Hb in left lower PFC, a simultaneous non-significant decrease in Deoxy-Hb). * Represent P<0.05. Average PFC: 1–16 optodes, Upper PFC: 1,3,5,7,9,11,13,15 optodes, Lower PFC: 2,4,6,8,10,12,14,16 optodes, Left PFC: 1–8 optodes and Right PFC: 9–16 optodes. ANB: Alternate nostril breathing, PFC: Prefrontal cortex, oxy-Hb: Oxy-haemoglobin, deoxy-Hb: Deoxy-haemoglobin, HbT: Total haemoglobin
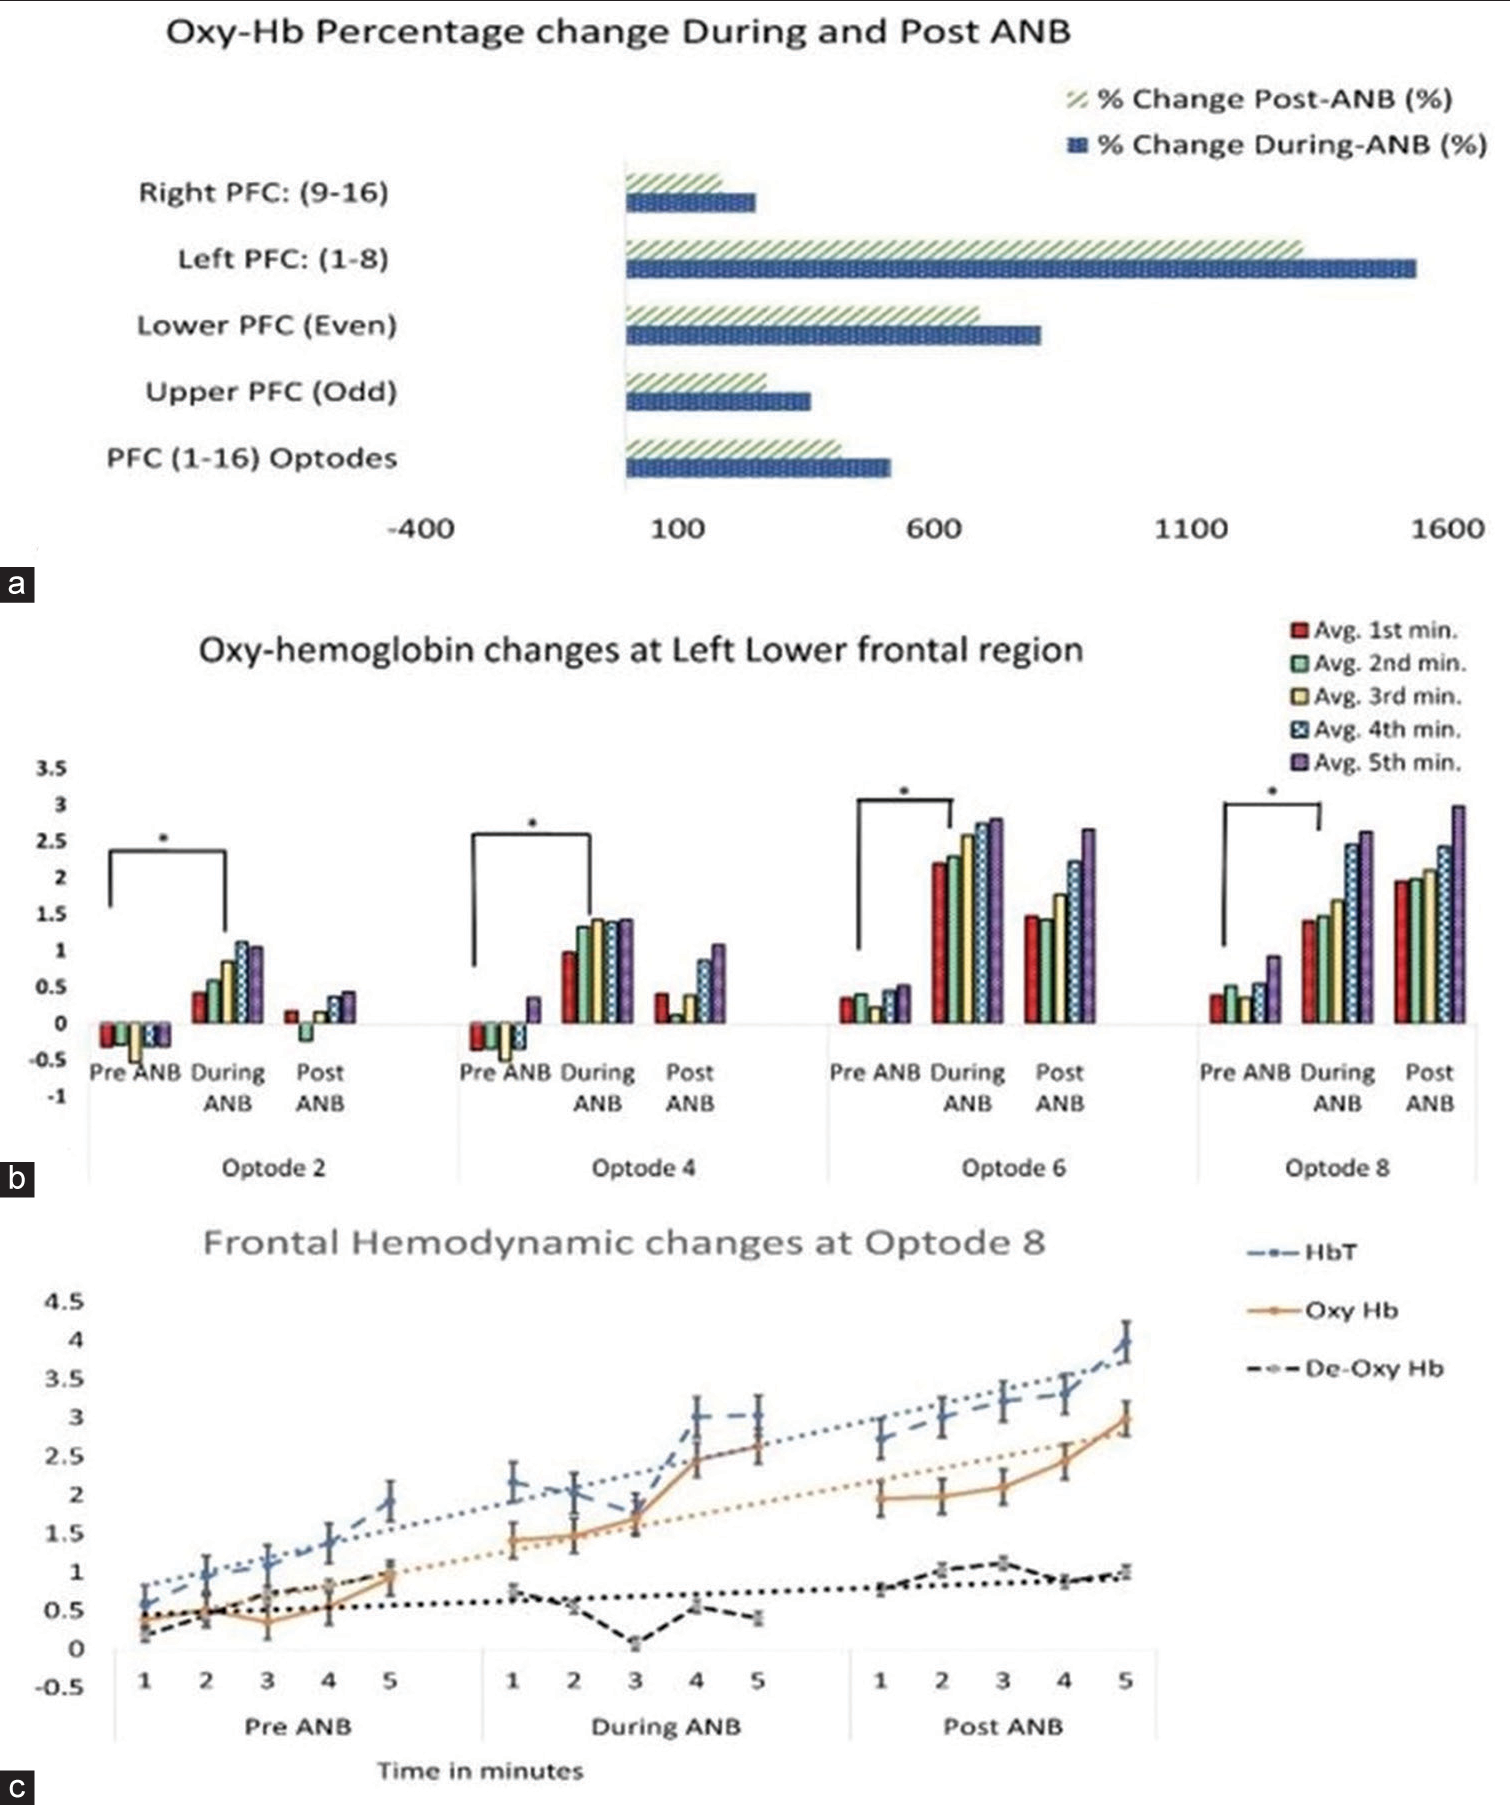
- (a) shows more increase in Oxy haemoglobin (Oxy Hb) at Left and Lower prefrontal cortex during and post alternate nostril breathing (ANB). (b) Shows significant and gradual increase in Oxy Hb with the increased duration of practice. (c) Frontal hemodynamic change at optode 8: Shows cerebral activation: Total haemoglobin, Oxy Hb increased and De-oxy-haemoglobin decreased with increased practice of ANB. ANB: Alternate nostril breathing, PFC: Prefrontal cortex, oxy-Hb: Oxy-haemoglobin, deoxy-Hb: Deoxy-haemoglobin, HbT: Total haemoglobin.
The average values of oxy-Hb, deoxy-Hb and HbT were compared for T0, T1 and T2 in the PFC region (1–16 optodes). Between T0, T1 and T2, the values of oxy-Hb, deoxy-Hb and HbT were not significantly different. Further analysis was performed for the right, left, upper and lower regions of PFC. The left PFC is represented by optodes 1–8, while optodes 9–16 represent the right PFC. Upper PFC and lower PFC regions were represented by odd (optodes 1, 3, 5, 7, 9, 11, 13 and 15) and even (optodes 2, 4, 6, 8, 10, 12, 14 and 16) numbers. The percentage change was calculated for T1 and T2 with respect to T0. Oxy-Hb and HbT levels increased significantly in T1 and T2 [Table 1]. The rise was greater on the left than on the right PFC and in the lower PFC than in the upper, as shown by the high percentage change values in [Figure 1a].
The paired t-test showed a significant increase in oxy-Hb during ANB at optodes 2, 4, 6 and 8 as compared to baseline. Further minute-to-minute changes in oxy-Hb concentrations were calculated and plotted for lower left PFC optodes 2, 4, 6 and 8. [Figure 1b] revealed that oxy-Hb increased gradually with the increased number of cycles of ANB.
Sequential changes in oxy-Hb, de-oxy Hb and HbT concentrations were plotted at optode 8 for T0, T1 and T2 (averaged for 1 min epochs for 5 min duration each). [Figure 1c] further establishes a gradual increase in oxy-Hb and HbT, as well as a simultaneous decrease in deoxy-Hb at optode 8 at T1 and T2. Also, note that the T2 values of oxy-Hb and HbT were higher as compared to T0.
Cardiovascular oscillations
The HRV analysis indicated that during ANB (T1) heart rate, SDNN, pNN50 and RMSSD were increased significantly, whereas SDNN increased and pNN50 and RMSSD were decreased significantly in T2 when compared with T0. A similar finding in BPV analysis was observed; the SDNN and RMSSD of SBP, DBP, and mean arterial blood pressure (MBP) were increased significantly during ANB. No significant change has been observed in recovery. We observed that the SBP decreased significantly in T2 with respect to T0, and MBP decreased significantly in T2 than T1 values, though the change in SBP and MBP was not significant during the T1 [Table 2].
| Time-domain parameters | F-value | Effect size | |||
|---|---|---|---|---|---|
| Parameters | Pre-ANB (T0) | During-ANB (T1) | Post-ANB (T2) | ||
| mean±SD | mean±SD | mean±SD | |||
| HRV | |||||
| HR | 72.81±6.18 | 78.57±5.14* | 74.33±5.86 | 06.32 | 1.3709 |
| SDNN (ms) | 41.71±5.66 | 88.94±12.97* | 55.81±13.55# | 31.98 | 3.1986 |
| pNN50 (%) | 9.06±6.28 | 18.34±5.3* | 6.58±3.87# | 14.50 | 0.934 |
| RMSSD (ms) | 29.79±7.07 | 47.1±11.47* | 26.41±5.4# | 16.80 | 1.1503 |
| BPV | |||||
| Blood pressure (mmHg) | |||||
| SBP | 115.77±10.55 | 115.38±8.52 | 111.04±10.81$ | 45.44 | 2.9394 |
| DBP | 63.36±9.26 | 65.24±6.55 | 62.42±8.04 | 78.37 | 1.2959 |
| MBP | 80.83±9.16 | 81.95±6.55 | 78.63±8.57# | 63.43 | 1.1387 |
| SDNN (mmHg) | |||||
| SBP | 5.75±1.82 | 9.23±2.05* | 6.96±1.03 | 1.136 | 0.6327 |
| DBP | 3.13±0.6 | 4.64±1.25 * | 3.62±0.35 | 5.003 | 1.2985 |
| MBP | 3.77±0.89 | 5.85±1.63 * | 4.45±0.19 | 1.167 | 0.6286 |
| RMSSD (mmHg) | |||||
| SBP | 2.57±0.69 | 3.79±1.33* | 2.5±0.85$ | 8.68 | 0.3829 |
| DBP | 1.43±0.36 | 2.23±0.62* | 1.43±0.22# | 4.633 | 0.8336 |
| MBP | 1.48±0.45 | 2.52±0.86* | 1.5±0.46 | 6.746 | 1.0351 |
| BRS | |||||
| Up | 10.49±3.23 | 15.01±5.70 | 12.27±4.98 | 2.598 | 0.998 |
| Down | 11.56±1.56 | 11.65±1.16 | 13.73±4.78 | 1.624 | 0.528 |
| All | 11.01±2.22 | 12.84±2.06 | 12.98±4.79 | 2.122 | 1.1258 |
All data are represented as mean±SD. *Represent P<0.05 for T1 versus T0; #Represent P<0.05 for T2 versus T0; $Represent P<0.05 for T2 versus T0 (repeated measures analysis of variance with Bonferroni post hoc test). HR: Heart rate, SBP: Systolic blood pressure, DBP: Diastolic blood pressure, MBP: Mean arterial blood pressure, SDNN: Standard deviation of NN intervals, pNN50: NN50 count divided by the total number of NN intervals, RMSSD: The square root of the mean of the sum of the squares of differences between adjacent NN intervals, ANB: Alternate nostril breathing, BRS: Baroreflex sensitivity, BPV: Blood pressure variability, HRV: Heart rate variability, SD: Standard deviation
The BRS using the Sequence method showed an increasing pattern during ANB compared to the baseline. During T1, the number of sequences for Up BRS decreased, whereas sequences for Down BRS converged to a narrow range [Figure 2].
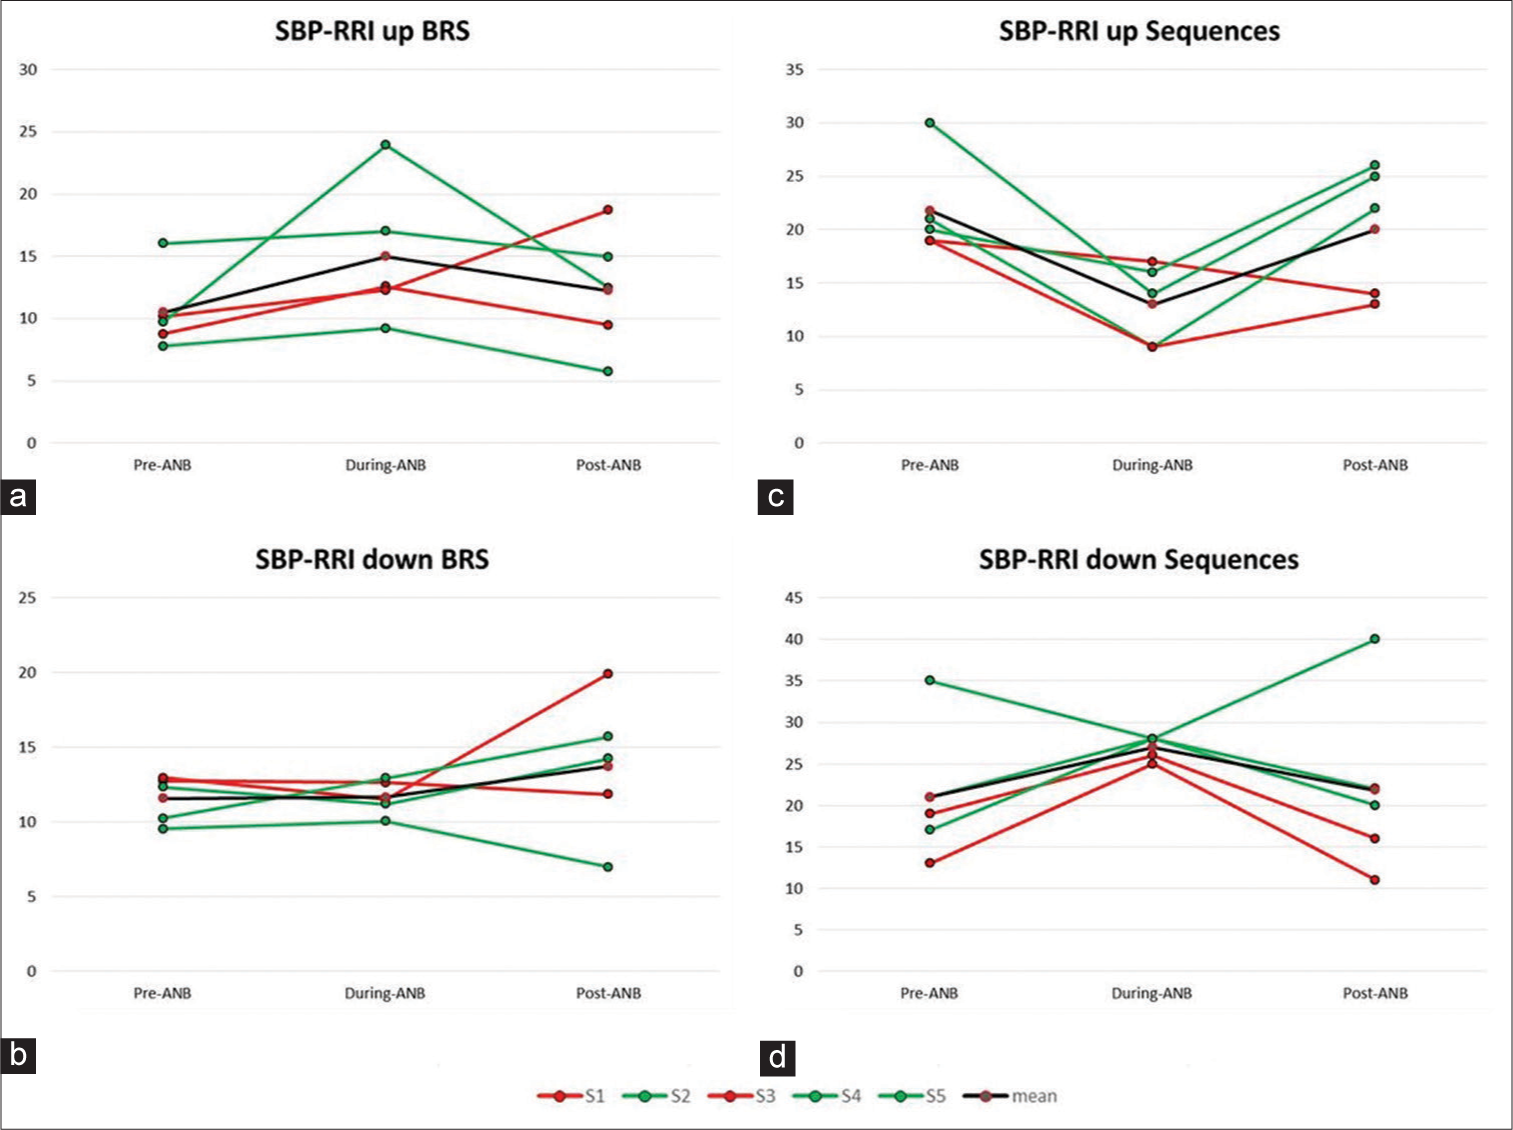
- (a-d) Showing an increasing pattern in Up-Baroreflex sensitivity (BRS) values and Up-BRS sequences decreased during-alternate nostril breathing (ANB). Down-BRS values did not change whereas down-BRS sequences were narrowed to an optimum value during-ANB. RRl: R peak to R peak duration from ECG recording in seconds, SBP: Systolic Blood Pressure
ETCO2
The overall findings of average ETCO2 in T0 (38.82 ± 2.61), T1 (37.29 ± 7.04) and T2 (37.2 ± 2.43) showed no significant change. However, when minute-to-minute values were compared, we found differential responses during ANB. The ETCO2 of the three volunteers (S2, S4 and S5 depicted in green) was increased, whereas it was decreased in two (S1 and S3 depicted in red) in T1, as shown in [Figure 3a].
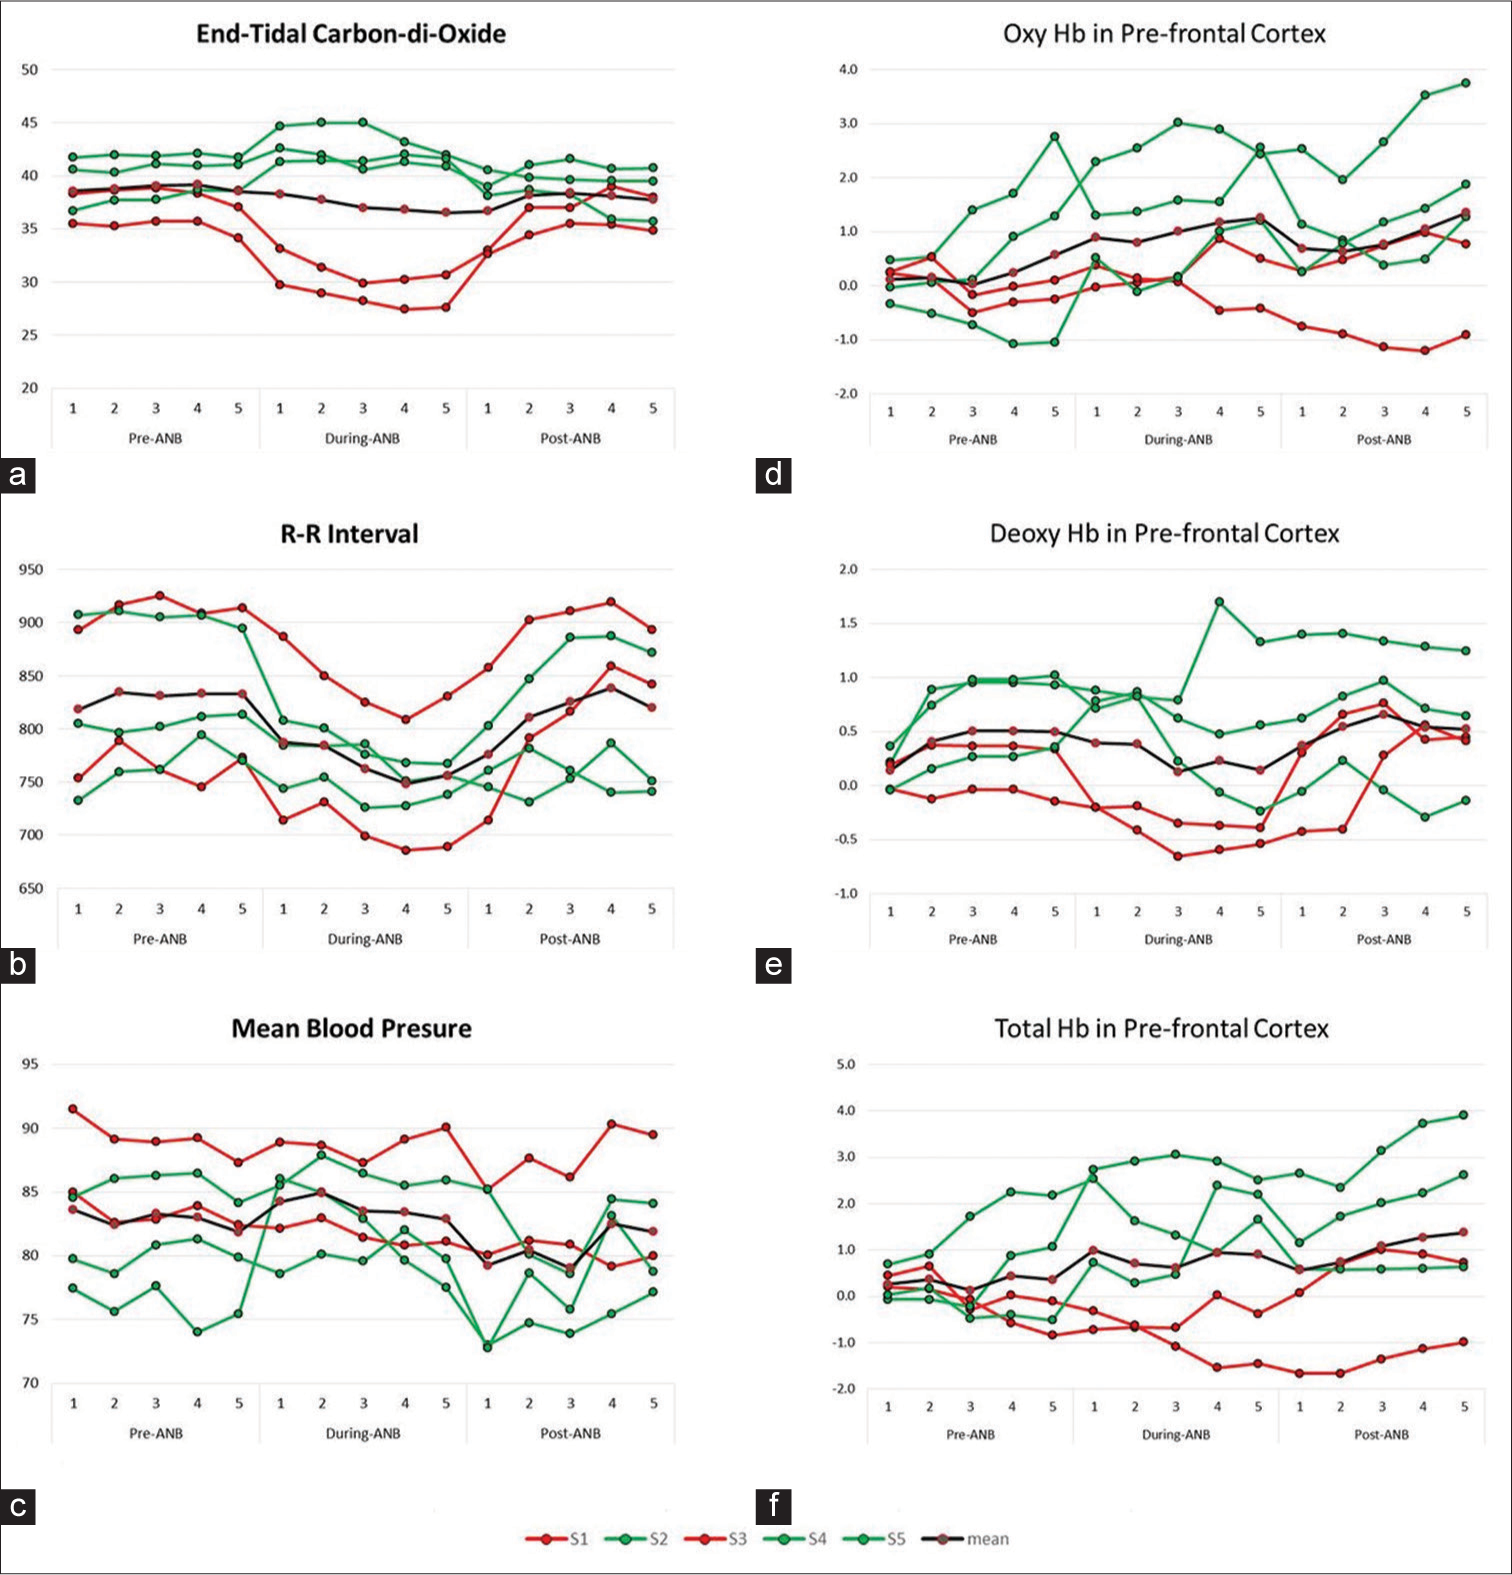
- (a-f) Showing end-tidal carbon dioxide, RR interval, mean blood pressure, oxy haemoglobin, deoxy haemoglobin and total haemoglobin pre-alternate nostril breathing (ANB), during-ANB and post-ANB. RR interval: R peak to R peak duration from ECG recording in seconds
Correlation of the hemodynamic parameters at PFC and cardiovascular oscillations with respect to ETCO2
The differential responses of ETCO2 led us to analyse all the other parameters (in minute-to-minute values) for five volunteers individually and look for any pattern in the data. Although S1 and S3, who showed a decline in ETCO2 on manoeuvre, had very different R-R intervals, their MBP showed few perturbations as compared to the other volunteers, as shown in [Figure 3b and c].
We also observed a reflection of this finding in the other recorded parameters. The average values of all 16 optodes were plotted for fNIRS data, we observed that the oxyHb remained lower than the mean in S1 and S3; also, the deoxyHb decreased during ANB. In S2, S4 and S5, the oxyHB increased during ANB and remained higher in recovery, as shown in [Figure 3d-f].
DISCUSSION
The primary findings of the present study suggest cerebral activation during slow yogic breathing like ANB at the rate of 5 bpm, which is reflected by significant increase in oxy-Hb with a simultaneous decrease in deoxy-Hb. An increase in HbT corresponds to an increase in cerebral blood volume during ANB. The increase in oxy-Hb and HbT was relatively more in the lower left side of PFC, which is anatomically associated with the left ventromedial PFC (vmPFC). The cerebral activation increased gradually with increased cycles of ANB during 5 min of practice. Minute-to-minute exploration of ETCO2 values showed differential responses among the volunteers, which was also reflected in other parameters. The cerebral activation during ANB can be understood in the light of multiple regulatory mechanisms. In the following subsections, the observations are inferred and discussed in detail.
Effect of slow breathing on vmPFC
A recent study investigated the effects of a 1-month training program of Bhastrika pranayama (fast, forceful and deep breathing) on anxiety and emotion processing using functional magnetic resonance imaging. The researchers observed a notable decrease in anxiety and an increase in positive emotions. These changes were linked to the functioning and communication of a specific brain network that is responsible for processing emotions, including the amygdala, anterior insula, ACC, vmPFC, ventrolateral PFC and dorsolateral PFC.[7] In the present study, the increase in oxy-Hb and HbT was relatively more in the lower left side of PFC that represents left vmPFC, indicating ANB may play a role in autonomic and affective regulation.
Mechanical effects of controlled slow yogic breathing
Multi-regulatory mechanisms are induced due to slow controlled yogic breathing through oscillations in cardiorespiratory and neurovascular systems.[8] A transient increase in cerebral blood flow (CBF) during and after ANB could be attributed to increased slow cyclic oscillations in heart rate and BP. We observed the morphology of the signal and found large sinusoidal waveform pattern in ECG, BP and fNIRS signals during ANB. This suggests increased variability and seems to be of respiratory origin as they are paralleled with the fluctuations of respiratory movements. Possibly in the present study, at a gross level, it seems increased oscillations in heart rate, BP and CBF are due to the mechanical effect of slow breathing. It indicates that slow yogic breathing may have influence on central haemodynamics. Our previous publication has suggested that ANB triggers cardiovascular fluctuations by engaging multiple regulatory mechanisms. These mechanisms primarily involve mechanical coupling with breathing, specifically through central and nonbaroreflex mechanisms.[5]
Effect on cardiovascular oscillations
The respiratory phase-driven fluctuations are known to modulate cardiovascular and cardiorespiratory coupling through synchronised hemodynamic fluctuations.[9,10] In the present study, during ANB significant increase in SDNN, RMSSD indices of HRV and BPV indicate increased oscillations in R-R interval, systolic, diastolic and mean arterial BP while maintaining the baseline values [Table 2]. Increased BP oscillations activate arterial baroreceptors, which fire signals through afferent nerves to the cardiovascular centres in the medulla oblongata that regulate sympathovagal balance. In agreement with this fact in the present study, BRS and Up sequences showed an increased pattern simultaneously. Down BRS sequences narrowed to an optimum value during ANB [Figure 2]. It suggests that ANB enhanced the central reflex globally by utilising the baroreflex loop, improved oxygenation, heightened parasympathetic activity and BRS, in accordance with previously published studies.[5,11,12] A significant increase in oxy-Hb at PFC may be attributed to the increased oscillations in MBP induced by ANB. This is further supported by a decrease in Up BRS sequences and an increase in down sequences, with a non-significant increase in BRS, indicating that the autoregulation has been maintained.
Effect of respiratory modulations in ETCO2 (Chemoreflex sensitivity)
The differential autonomic modulation with enhanced BRS immediately after yogic breathing is reported in the literature.[13] Similarly, the differential effect of ANB on ETCO2 is observed in the present study, which is reflected in all the other haemodynamic and autonomic parameters [Figure 3]. The increased CBF may be due to repeated episodes of breath holding after inspiration as well as expiration as ANB was performed in the ratio of 4:2:4:2: Inhalation: Pause: Exhalation: Pause in seconds. This breathing pattern may pose a respiratory challenge, but vasodilatation of the cerebral arteries counterbalances a drop in perfusion pressure, maintaining adequate CBF in healthy individuals under normal conditions.[14]
It is known that neuronal activation triggers an increase in CBF; hence, one of the factors for increased cerebral blood during ANB may be neural activation or vice versa. This can be warranted with simultaneous acquisition of EEG and fNIRS in future studies.
CONCLUSION
The present pilot study provides new insight into the neurovascular correlates of slow yogic breathing. A significant increase in cerebral oxygenation in the left lower prefrontal region indicates cerebral activation during ANB. Mechanical coupling of respiration and neural controls, such as baroreflex and chemoreflex mechanisms, mediate these frontal hemodynamic fluctuations during ANB. The findings also suggest gradual activation of the left-lower region of PFC with increased duration of practice of ANB. Left-lower optodes represent vmPFC, which is associated with successful suppression of emotional responses to a negative emotional signal; hence, ANB may have beneficial effects in disorders in which cerebral hypoactivation plays a major role.
Acknowledgements
This study was supported by the Ministry of AYUSH, Government of India (Z. 28015/41/2013-HPC [EMR]-AYUSH-B). We thank Prof. Dr. Ashok Kumar Jaryal for his support, the staff of the Autonomic Function Testing laboratory for assistance and all the volunteers for their participation in the study.
Availability of data and materials
The data supporting the findings of this study are available within the article and the supplementary/raw data will be made available at the reasonable request.
Ethical approval
The research/study approved by the Institutional Review Board at All India Institute of Medical Sciences, New Delhi, number Ref. No. IESC/T156/30-03-2012, dated 30 March 2012.
Declaration of patient consent
The authors certify that they have obtained all appropriate patient consent.
Conflicts of interest:
There are no conflicts of interest.
Use of artificial intelligence (AI)-assisted technology for manuscript preparation
The authors confirm that there was no use of artificial intelligence (AI)-assisted technology for assisting in the writing or editing of the manuscript and no images were manipulated using AI.
Financial support and sponsorship: This study was supported by the Ministry of AYUSH, Government of India (Z. 28015/41/2013-HPC [EMR]-AYUSH-B).
References
- Effect of uninostril yoga breathing on brain hemodynamics: A functional near-infrared spectroscopy study. Int J Yoga. 2016;9:12-9.
- [CrossRef] [PubMed] [Google Scholar]
- Human prefrontal cortical response to the meditative state: A spectroscopy study. Int J Neurosci. 2010;120:483-8.
- [CrossRef] [PubMed] [Google Scholar]
- Hemodynamic responses on prefrontal cortex related to meditation and attentional task. Front Syst Neurosci. 2014;8:252.
- [CrossRef] [PubMed] [Google Scholar]
- Meditation enhances brain oxygenation, upregulates BDNF and improves quality of life in patients with primary open angle glaucoma: A randomized controlled trial. Restor Neurol Neurosci. 2018;36:741-53.
- [CrossRef] [PubMed] [Google Scholar]
- Acute effects on cardiovascular oscillations during controlled slow yogic breathing. Indian J Med Res. 2017;145:503-12.
- [CrossRef] [PubMed] [Google Scholar]
- Role of prefrontal cortex during Sudoku task: fNIRS study. Transl Neurosci. 2020;11:419-27.
- [CrossRef] [PubMed] [Google Scholar]
- Effects of yoga respiratory practice (Bhastrika pranayama) on anxiety, affect, and brain functional connectivity and activity: A randomized controlled trial. Front Psychiatry. 2020;11:467.
- [CrossRef] [PubMed] [Google Scholar]
- The physiological effects of slow breathing in the healthy human. Breathe (Sheff). 2017;13:298-309.
- [CrossRef] [PubMed] [Google Scholar]
- Increased cardio-respiratory coupling evoked by slow deep breathing can persist in normal humans. Respir Physiol Neurobiol. 2014;204:99-111.
- [CrossRef] [PubMed] [Google Scholar]
- Respiratory effect on the pulse spectrum. J Med Eng Technol. 2003;27:77-84.
- [CrossRef] [PubMed] [Google Scholar]
- Effect of slow breathing on autonomic tone and baroreflex sensitivity in yoga practitioners. Indian J Med Res. 2020;152:638-47.
- [CrossRef] [PubMed] [Google Scholar]
- Cardiovascular and respiratory effect of yogic slow breathing in the yoga beginner: What is the best approach? Evid Based Complement Alternat Med. 2013;2013:743504.
- [CrossRef] [PubMed] [Google Scholar]
- Effects of yogic breath regulation: A narrative review of scientific evidence. J Ayurveda Integr Med. 2019;10:50-8.
- [CrossRef] [PubMed] [Google Scholar]
- Cerebral blood flow-related signal changes during breath-holding. AJNR Am J Neuroradiol. 1999;20:1233-8.
- [Google Scholar]


