
Translate this page into:
Ankle-brachial pressure index correlates with abdominal volume index in normal-weight type 2 diabetes mellitus patients

*Corresponding author: Kumar Sarvottam, Department of Physiology, All India Institute of Medical Sciences, Gorakhpur, Uttar Pradesh, India. kumarsarvo@gmail.com
-
Received: ,
Accepted: ,
How to cite this article: Yadav U, Sarvottam K, Kumar N. Ankle-brachial pressure index correlates with abdominal volume index in normal-weight type 2 diabetes mellitus patients. Indian J Physiol Pharmacol. 2023;67:245-50. doi: 10.25259/IJPP_396_2023
Abstract
Objectives:
Prolonged type 2 diabetes mellitus (T2DM) can have detrimental effects on essential organs and may result in various complications. Calcification within atherosclerosis plaque is linked to arterial stiffness. Chronic diabetes, excessive fat accumulation and large waist circumference (WC) have been associated with accelerated arterial stiffening. Individuals with T2DM are at higher risk of experiencing increased arterial stiffness compared to those without diabetes. In the present study, we aimed to investigate the correlation between abdominal volume index (AVI) and ankle-brachial pressure index (ABPI) in obese/overweight and normal-weight T2DM patients.
Materials and Methods:
Anthropometric measurements were performed for 104 body mass index-categorised T2DM patients in the age range of 30–70 years. ABPI measurements were also taken for all these patients using the Doppler ultrasound-based method. To assess the relationship between the parameters, Pearson and Spearman tests were used.
Results:
AVI was found to correlate positively with WC and visceral fat (VF%) in both normal-weight and obese/overweight T2DM patients (r = 0.968, P < 0.001 and r = 0.988, P < 0.001) (r = 0.724, P < 0.001 and r = 0.820, P < 0.001), respectively. ABPI was positively correlated with AVI (r = 0.378, P = 0.009) in normal-weight T2DM patients, but a similar finding was not observed in obese/overweight diabetic patients.
Conclusion:
The positive correlation of WC and VF% with AVI is suggestive of AVI to be an important indicator of visceral obesity. A positive correlation of AVI with ABPI may be suggestive of arterial stiffness in normal-weight T2DM patients with ABPI >1.
Keywords
Type 2 diabetes mellitus
Obesity
Peripheral artery disease
Arterial stiffness
Ankle-brachial pressure index
Abdominal volume index
Visceral obesity

INTRODUCTION
Type 2 diabetes mellitus (T2DM) is one of the most common metabolic disorders worldwide in humans of modern society. Several studies have shown that being overweight/obese is a significant risk factor for the advancement of T2DM.[1] However, it is important to note that not all fat depots have the same negative impact. Subcutaneous adipose tissue may not be a risk factor for metabolic disorders, whereas visceral adipose tissue could negatively affect glucose regulation and be linked to vascular complications.[2,3] Excessive visceral fat (VF) deposition is directly linked to metabolic irregularities and vascular complications when compared to subcutaneous fat.[4-7] Moreover, the prevalence of visceral obesity is rapidly increasing across all age groups. Even individuals with normal weight having increased visceral obesity could be attributed to genetic factors that make them more susceptible to developing T2DM and related vascular complications.[8] According to a study, newly diagnosed body mass index (BMI)-categorised normal-weight T2DM patients had higher mortality than obese/overweight patients, which means normal-weight individuals with increased visceral adiposity have higher chances of cardiovascular risk and mortality.[9]
Persistent high levels of blood sugar resulting from diabetes mellitus (DM) can lead to dysfunction and failure of different organs[10], and it represents a significant risk factor for the onset of peripheral artery disease (PAD).[11] Diabetes also contributes to the progression of atherosclerosis, a condition in which arteries become narrowed and obstructed due to the build-up of fatty deposits, thereby increasing the risk of heart attack and stroke.[12] Arterial stiffness is associated with calcification within atherosclerosis plaque. Patients with T2DM face a higher risk of experiencing increased arterial stiffness compared to individuals without diabetes. Pathological changes such as reduced nitric oxide bioavailability, increased oxidative stress, and changes in the arterial wall collagen may contribute to the increase of arterial stiffness. This increased arterial stiffness is an important factor influencing the risk of cardiovascular disease.[13]
Multiple invasive and non-invasive methods are available to screen and diagnose PAD. One of the non-invasive methods is the ankle-brachial pressure index (ABPI), which has shown high accuracy in detecting the early stage of PAD. Using an ABPI threshold of 1.0 as the normal value, the ABPI test demonstrates an overall accuracy of 98% (sensitivity 97% and accuracy 100%) when compared to angiography.[14] In a primary health-care setting, ABPI measurements can be used for the early detection and cost-effective treatment of PAD. An ABPI <0.9 is the diagnostic criteria for PAD, which may indicate varying degrees of atherosclerosis in arteries of lower extremity.[15]
At present, there are no consistent shreds of evidence regarding differences in terms of cardiovascular morbidity and mortality between obese and non-obese diabetic patients. Even less information is available regarding the vascular impact of abdominal volume index (AVI), a novel visceral obesity index in lean and obese T2DM patients. Further, a lean individual with increased central adiposity may have a higher risk of cardiovascular complications; however, there is a paucity of literature regarding the association between normal BMI with increased central adiposity and progression of arterial stiffness in patients with T2DM. In this study, we investigated the correlation between AVI and ABPI in normal-weight and obese/overweight T2DM patients.
MATERIALS AND METHODS
Subjects and study design
A cross-sectional observational study was conducted on 104 patients of the age range of 30–70 years with T2DM. Patients were recruited from the medicine outpatients department. Patients were further classified into two groups on the basis of BMI: (1) normal-weight T2DM (n = 47) and (2) obese/overweight T2DM (n = 57). Patients with a history of any PAD or neurovascular complications were excluded from the study. Before participating in the study, all patients gave their written informed consent. The Institute’s Ethical Committee approved the study protocol, and the study was conducted in accordance with the Declaration of Helsinki (Letter No. Dean/2019/EC/1754).
ABPI measurements
ABPI was measured with the help of a device named VERSALAB-Auto (Automated Vascular Doppler Recorder) (Diabetic Foot Care India Pvt Limited, Chennai, India) [Figure 1]. For measurements, patients were asked to lie down in supine position for at least 5 min. Standard segmental blood pressure cuffs were placed on each arm and each ankle above the malleoli. Initially, the arm’s blood pressure was measured. Using acoustic gel, the Doppler probe was coupled to the skin at the point where pulses were normally felt. Doppler probe is generally inclined at 30°–45° with the direction of blood flow. Probe was moved gently until a triphasic waveform appeared with a loud arterial sound. Once a good quality Doppler sound is heard, the arm cuff was inflated above the systolic pressure, at which point the Doppler sound stops completely. The arm cuff was then slowly deflated, and when the first Doppler sound reappeared, the systolic pressure of the arm was displayed on the monitor. Similarly, the systolic pressure of the ankle artery was determined by placing a Doppler probe over the dorsalis pedis artery and posterior tibial artery, whichever provided the loudest Doppler sound with a distinct triphasic waveform [Figure 2].[16] ABPI was calculated by the low ankle pressure method. The lowest ankle pressure was taken as the numerator, and the higher of the two arm systolic pressures was taken as the denominator.
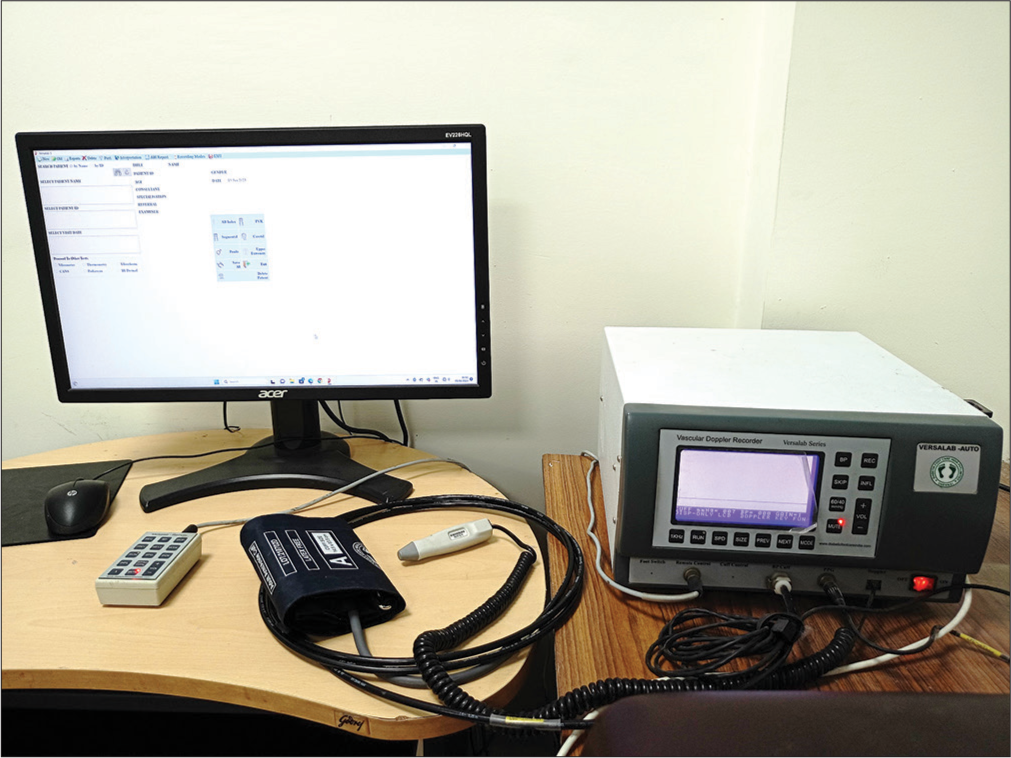
- VERSALAB AUTO with its component for measuring ankle-brachial pressure index.
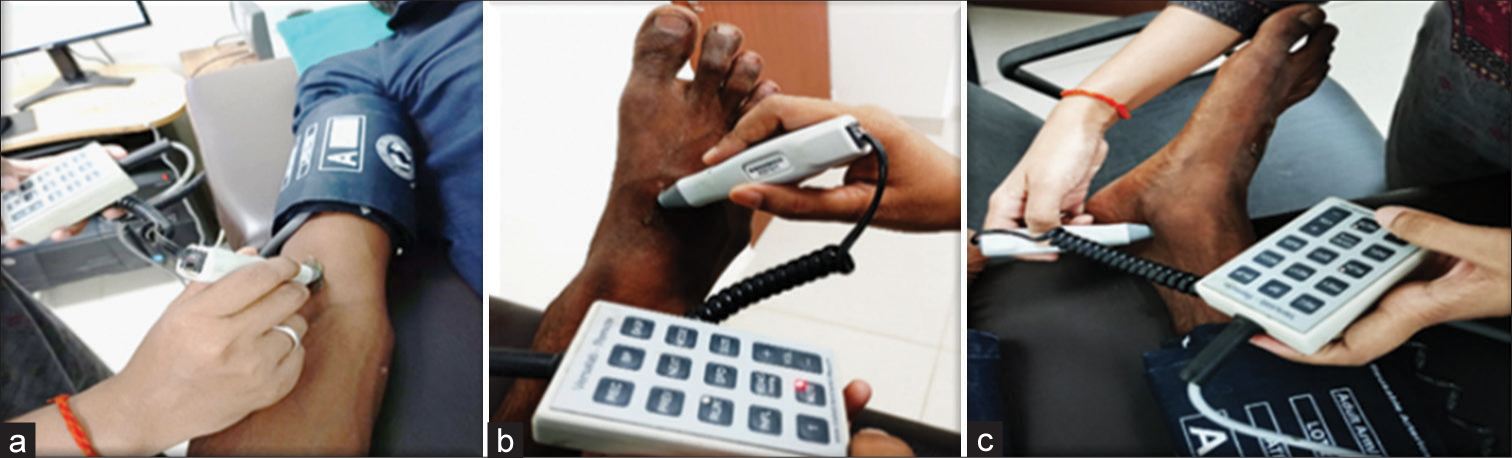
- Measurements of ankle-brachial pressure index with VERSALAB AUTO using Doppler probe at (a) brachial artery, (b) dorsalis pedis artery, and (c) posterior tibial artery with 45° inclination.
Anthropometric measurements
Anthropometric parameters were measured. Weight was measured using the digital weighing machine. Height was measured with the help of a wall-mounted stadiometer. Waist circumference (WC) was measured using a standardised measuring tape at the midpoint between the lower rib margin and the iliac crest. Hip circumference (HC) was measured using a standardised measuring tape as the maximal circumference over the buttocks.[17]
Calculation of obesity indices
BMI: Weight (kg)/Height (m2)[18]
Waist-hip ratio (WHR): WC (cm)/HC (cm)[17]
Waist height ratio (WhtR): WC (cm)/height (cm)[17]
Body composition
Body composition such as total body fat % (BF) and VF% was measured using a bioelectrical impedance analyser (BIA) (Omron HBF 375 IN). BIA works on the principle that lean tissue or muscle mass is a good conductor of electricity, while fat is a poor conductor. Using electrodes, the BIA device sends weak alternating currents that flow through the body. BIA uses mathematical equations, and the algorithm uses impedance to estimate the total water content of the body; further, it is used to calculate fat-free mass and the difference between body weight and body fat.
Procedure
The participants were asked to stand barefoot on the main unit with their knees and back straight and were asked to look straight ahead. It was made sure that their weight was evenly distributed on all electrodes. They were then asked to hold the handheld unit at the level of the trunk. When weight measurement was completed and shown in the display, the handheld unit was kept in front with arms extended at 90°. After the measurement was completed, they were asked to step down, and the readings were noted [Figure 3].
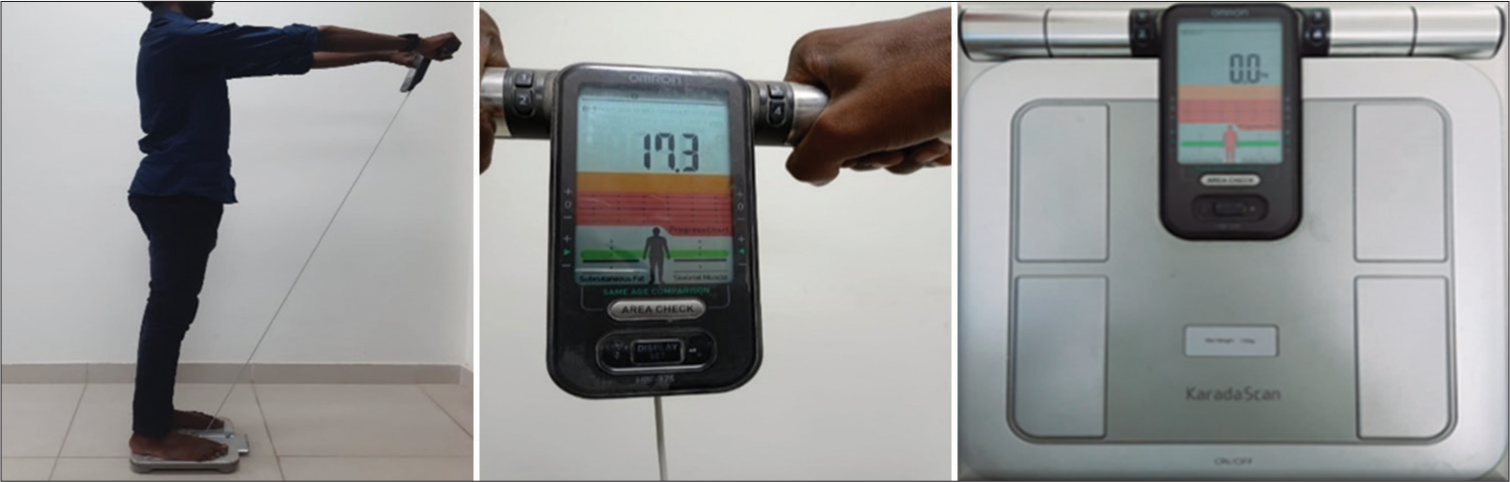
- Measurement of body composition with the help of a bioelectrical impedance analyser.
Statistical analysis
All statistical analysis was performed using SPSS 16.0 for Windows. Data were checked for normal distribution by the Kolmogorov–Smirnov test for obese/overweight T2DM patients and by the Shapiro–Wilk test for normal-weight T2DM patients. Correlations between the parameters were checked by Pearson correlation for parametric data and by Spearman correlation for non-parametric data. P < 0.01 and 0.05 were considered statistically significant.
RESULTS
In total, this study consisted of 104 T2DM patients with a mean age of 49.62 ± 8.46 years. Out of the total, 47 patients were normal-weight (males = 29, females = 18) and 57 patients were obese/overweight (males = 27, females = 30). Mean ABPI and mean AVI in normal-weight T2DM patients were 1.04 ± 0.203 and 15.57 ± 2.78, respectively, while, in the case of obese/overweight T2DM patients, the mean ABPI and mean AVI were 1.044 ± 0.12 and 20.47 ± 4.27, respectively. In normal-weight T2DM patients, BMI, WC, and ABPI were non-parametric data. In obese/overweight T2DM patients, BMI, WC, VF, and AVI were non-parametric data. The clinical characteristics of the patients are represented in Table 1.
| Parameters | Normal-weight T2DM (n=47) | Obese/Overweight T2DM (n=57) |
|---|---|---|
| Age (years) | 49.59±8.62 | 49.64±8.33 |
| Weight (kg) | 57.55±8.73 | 73.03±12.87 |
| Height (cm) | 160.49±9.88 | 157.99±8.85 |
| BMI (kg/m2) | 22.31±1.96 | 29.19±4.10 |
| WC (cm) | 87.51±8.31 | 100.47±9.91 |
| HC (cm) | 90.97±6.02 | 101.15±6.80 |
| WHR | 0.95±0.06 | 0.98±0.07 |
| WhtR | 0.54±0.04 | 0.63±0.06 |
| BF% | 26.64±8.29 | 34.84±5.65 |
| VF% | 6.89±2.88 | 14.23±5.65 |
| ABPI | 1.04±0.203 | 1.044±0.12 |
| AVI | 15.57±2.78 | 20.47±4.27 |
BMI: Body mass index, WC: Waist circumference, HC: Hip circumference, WHR: Waist-hip ratio, WhtR: Waist height ratio, BF%: Body fat, percentage, VF%: Visceral fat percentage, ABPI: Ankle-brachial pressure index, AVI: Abdominal volume index, SD: Standard deviation, T2DM: Type 2 diabetes mellitus. Data are represented in mean ± standard deviation.
In correlation analysis, BMI was found to correlate positively with WC (P < 0.001 r = 0.553 and P < 0.001, r = 0.743), WhtR (P < 0.001, r = 0.623 and P < 0.001, r = 0.792), BF% (P = 0.010, r = 0.372 and P = 0.003, r = 0.371), VF% (P < 0.001, r = 0.796 and P < 0.001, r = 0.834) and AVI (P < 0.001, r = 0.522 and P < 0.001, r = 0.761), respectively, in both normal-weight and obese/overweight group of patients [Table 2]. In addition, AVI was found to correlate positively with WC and VF% in both normal-weight and obese/overweight T2DM patients (r = 0.968, P < 0.001 and r = 0.988, P < 0.001) (r = 0.724, P < 0.001 and r = 0.820, P < 0.001), respectively [Table 3].
| Normal-weight T2DM patients | Overweight/Obese T2DM patients | |||||||||
|---|---|---|---|---|---|---|---|---|---|---|
| WC | WhtR | BF% | VF% | AVI | WC | WhtR | BF% | VF% | AVI | |
| BMI | ||||||||||
| r | 0.553 | 0.623 | 0.372 | 0.796 | 0.522 | 0.743 | 0.792 | 0.371 | 0.834 | 0.761 |
| P | <0.001* | <0.001* | 0.010* | <0.001* | <0.001* | <0.001* | <0.001* | 0.004* | <0.001* | <0.001* |
| Normal-weight T2DM patients | Overweight/Obese T2DM patients | |||
|---|---|---|---|---|
| WC | VF% | WC | VF% | |
| AVI | ||||
| r | 0.968a | 0.724b | 0.988a | 0.820a |
| P | <0.001* | <0.000* | <0.001* | <0.001* |
ABPI was positively correlated with AVI (r = 0.378, P = 0.009) in normal-weight T2DM patients, but a similar finding was not observed in obese/overweight diabetic patients [Table 4].
| Normal-weight T2DM patients | Overweight/Obese T2DM patients | |||||
|---|---|---|---|---|---|---|
| WC | VF | AVI | WC | VF | AVI | |
| ABPI | ||||||
| r | 0.387 | 0.253 | 0.378 | 0.101 | 0.151 | 0.112 |
| P | 0.007* | 0.086 | 0.009* | 0.454 | 0.263 | 0.409 |
DISCUSSION
Diabetes is a significant risk factor for both microvascular and macrovascular disease, leading to various complications.[20] Distinct patterns of central fat deposition, ectopic fat storage, and reduced lean mass have been linked to metabolic abnormalities and the development of diabetes.[21] Studies have shown that the prognosis of arterial stiffness and the likelihood of subsequent cardiovascular events can be predicted by assessing central/visceral obesity through anthropometric indices.[22] In our study, the ABPI score was found to correlate positively with AVI in normal-weight diabetic patients, while the same was not observed in obese diabetic patients. Many studies have suggested that AVI strongly correlates with WC and VF%, measures of central obesity.[23] In line with the previous study, we also got a strong positive correlation of AVI with WC and VF%. A positive correlation of AVI with measures of abdominal obesity suggests that greater AVI is associated with greater body fat percentage. A positive correlation of ABPI score with AVI may indicate the presence of arterial stiffness in these groups of patients. An increased ABPI is associated with chronic DM, leading to arterial calcification, which, in turn, exacerbates arterial stiffness, resulting in abnormally high systolic blood pressure. Conflicting findings have been reported regarding the association of arterial stiffness with ABPI. Pulse wave velocity (PWV) is one of the non-invasive methods for the measurements of arterial stiffness. Some studies have reported a contrary relationship between PWV and ABPI.[24,25] In a study, BMI showed a negative correlation with PWV, and this association remains independent of blood pressure, suggesting that obesity might have a protective effect.[26] However, some other studies suggested that BMI was positively correlated with PWV, suggesting that obesity accelerates the progression of arterial stiffness.[27] Some researchers did not find any association between obesity and arterial stiffness,[28] while others reported that in normal-weight diabetic patients, increased visceral adiposity only contributes to arterial stiffening but also leads to the advancement of structural changes in the arteries.[29] In a study, a significant linear association of brachial PWV (BaPWV) with BMI and systolic and diastolic blood pressure was observed. Among individuals with comparable brachial systolic pressure, those with normal weight exhibited higher BaPWV compared to obese subjects, suggesting the presence of increased arterial stiffness in the normal-weight group of individuals.[30]
However, the relationship between PWV and ABPI in individuals without arterial stiffness in the lower extremities has not been fully clarified. A study reported a positive correlation between PWV and ABPI in subjects aged between 21 and 89 years old.[31] In a study, a U-shaped association of ABPI with PWV was reported.[32] Further, a study conducted by Rabkin et al. reported a significant negative correlation between ABPI and augmentation index (a measure of arterial stiffness) in a person without PAD, that is, an ABPI of > 1.0. They included only those patients who had ABPI >1.0.[33] In the present study, the mean WC was 87.51 ± 8.31 among lean diabetics, which is in the normal range according to the World Health Organization cutoffs, and it correlates with AVI and ABPI, which indicates that increase in visceral obesity within normal cutoffs may reduce the chances of developing PAD. However, in the obese/overweight group of patients, the mean WC was 100.47 ± 9.91, which is beyond the normal range, suggesting that with a higher range of WC, a person may be more prone to develop PAD. In lean diabetic patients, increased AVI is associated with higher ABPI Value, suggesting that in lean individuals, increased central adiposity may lead to calcification of the medial artery, being responsible for increasing arterial stiffness. We cannot rule out the possibility of increasing arterial stiffness with increasing WC and AVI in lean diabetic patients as compared to obese T2DM patients.
CONCLUSION
In normal-weight diabetic patients, a positive correlation of AVI with ABPI may be suggestive of the medial artery calcification in these patients, which is responsible for increasing arterial stiffness. High ABPI value could be an important marker for the detection of cardiovascular complications in T2DM patients without PAD.
Ethical approval
Approved by the Institutional Ethics Committee Letter No. Dean/2019/EC/1754.
Declaration of patient consent
The authors certify that they have obtained all appropriate patient consent.
Conflicts of interest
There are no conflicts of interest.
Use of artificial intelligence (AI)-assisted technology for manuscript preparation
The authors confirm that there was no use of artificial intelligence (AI)-assisted technology for assisting in the writing or editing of the manuscript and no images were manipulated using AI.
Financial support and sponsorship
Nil.
References
- Public health approaches to the prevention of obesity (PHAPO) working group of the international obesity task force (IOTF). Obesity prevention: The case for action. Int J Obes Relat Metab Disord. 2002;26:425-36.
- [CrossRef] [PubMed] [Google Scholar]
- Non-alcoholic fatty liver disease (NAFLD) and its connection with insulin resistance, dyslipidemia, atherosclerosis and coronary heart disease. Nutrients. 2013;5:1544-60.
- [CrossRef] [PubMed] [Google Scholar]
- Lipotoxicity and the development of heart failure: Moving from mouse to man. Cell Metab. 2010;12:555-6.
- [CrossRef] [PubMed] [Google Scholar]
- Ectopic fat and cardio metabolic and vascular risk. Int J Cardiol. 2013;169:166-76.
- [CrossRef] [PubMed] [Google Scholar]
- Abdominal visceral and subcutaneous adipose tissue compartments: Association with metabolic risk factors in the Framingham heart study. Circulation. 2007;116:39-48.
- [CrossRef] [PubMed] [Google Scholar]
- Impact of abdominal visceral and subcutaneous adipose tissue on cardiometabolic risk factors: The Jackson heart study. J Clin Endocrinol Metab. 2010;95:5419-26.
- [CrossRef] [PubMed] [Google Scholar]
- Visceral and subcutaneous adipose tissue volumes are cross-sectionally related to markers of inflammation and oxidative stress: The Framingham heart study. Circulation. 2007;116:1234-41.
- [CrossRef] [PubMed] [Google Scholar]
- Normal-weight diabetic patients verses obese diabetics: Relation of overall and abdominal adiposity to vascular health. Cardiovasc Diabetol. 2014;13:141.
- [CrossRef] [PubMed] [Google Scholar]
- Association of weight status with mortality in adults with incident diabetes. JAMA. 2012;308:581-90.
- [CrossRef] [PubMed] [Google Scholar]
- Type 2 diabetes mellitus: From a metabolic disorder to an inflammatory condition. World J Diabetes. 2015;6:598-612.
- [CrossRef] [PubMed] [Google Scholar]
- Diabetes and peripheral artery disease: A review. World J Diabetes. 2021;12:827-38.
- [CrossRef] [PubMed] [Google Scholar]
- The diabetes mellitus-atherosclerosis connection: The role of lipid and glucose metabolism and chronic inflammation. Int J Mol Sci. 2020;21:1835.
- [CrossRef] [PubMed] [Google Scholar]
- Arterial stiffness in diabetes mellitus. Atherosclerosis. 2015;238:370-9.
- [CrossRef] [PubMed] [Google Scholar]
- Ankle systolic pressure measurements in arterial disease affecting the lower extremities. Br J Surg. 1969;56:676-9.
- [CrossRef] [PubMed] [Google Scholar]
- Peripheral arterial disease in people with diabetes. Diabetes Care. 2003;26:3333-41.
- [CrossRef] [PubMed] [Google Scholar]
- Handheld Doppler assessment for peripheral arterial disease. J Wound Care. 1996;5:125-8.
- [CrossRef] [Google Scholar]
- Association between modified ankle-brachial pressure index and indices of adiposity. Indian J Physiol Pharmacol. 2021;65:21-7.
- [CrossRef] [Google Scholar]
- Body mass index: Obesity, BMI, and health: A critical review. Nutr Today. 2015;50:117-28.
- [CrossRef] [PubMed] [Google Scholar]
- Abdominal volume index. An anthropometry-based index for estimation of obesity is strongly related to impaired glucose tolerance and Type 2 diabetes mellitus. Arch Med Res. 2003;34:428-32.
- [CrossRef] [PubMed] [Google Scholar]
- Diabetes-related microvascular and macrovascular diseases in the physical therapy setting. Phys Ther. 2008;88:1322-35.
- [CrossRef] [PubMed] [Google Scholar]
- Body fat distribution and insulin resistance. Nutrients. 2013;5:2019-27.
- [CrossRef] [PubMed] [Google Scholar]
- Comparison of the ability to identify arterial stiffness between two new anthropometric indices and classical obesity indices in Chinese adults. Atherosclerosis. 2017;263:263-71.
- [CrossRef] [PubMed] [Google Scholar]
- Abdominal volume index is a better predictor of visceral fat in patients with Type 2 diabetes: A cross-sectional study in Ho municipality, Ghana. Alexandria J Med. 2022;58:85-91.
- [CrossRef] [Google Scholar]
- The predictive value of brachial-ankle pulse wave velocity in coronary atherosclerosis and peripheral artery diseases in urban Chinese patients. Hypertens Res. 2008;31:1079-85.
- [CrossRef] [PubMed] [Google Scholar]
- Aortic pulse velocity is associated with measures of subclinical target organ damage. JACC Cardiovasc Imaging. 2011;4:754-61.
- [CrossRef] [PubMed] [Google Scholar]
- Body mass index is not independently associated with increased aortic stiffness in a Brazilian population. Am J Hypertens. 2012;25:1064-9.
- [CrossRef] [PubMed] [Google Scholar]
- Measures of obesity are associated with vascular stiffness in young and older adults. Hypertension. 2003;42:468-73.
- [CrossRef] [PubMed] [Google Scholar]
- Carotid-femoral pulse wave velocity is not increased in obesity. Am J Hypertens. 2015;28:546-51.
- [CrossRef] [PubMed] [Google Scholar]
- Impact of increased visceral adiposity with normal-weight on the progression of arterial stiffness in Japanese patients with Type 2 diabetes. BMJ Open Diabetes Res Care. 2015;3:e000081.
- [CrossRef] [PubMed] [Google Scholar]
- Association between brachial-ankle pulse wave velocity as a marker of arterial stiffness and body mass index in a Chinese population. J Cardiovasc Dev Dis. 2022;9:75.
- [CrossRef] [PubMed] [Google Scholar]
- Age-and sex-related effects on ankle-brachial index in a screened cohort of Japanese: The Okinawa Peripheral Arterial Disease Study (OPADS) Eur J Prev Cardiol. 2014;21:712-8.
- [CrossRef] [PubMed] [Google Scholar]
- A high ankle-brachial index is associated with increased aortic pulse wave velocity: The Czech post-MONICA study. Eur J Cardiovasc Prev Rehabil. 2011;18:790-6.
- [CrossRef] [PubMed] [Google Scholar]
- Ankle-brachial index as an indicator of arterial stiffness in patients without peripheral artery disease. Angiology. 2012;63:150-4.
- [CrossRef] [PubMed] [Google Scholar]


