
Translate this page into:
EEG microstates in resting condition in young indians
*Corresponding author: Prashant Tayade, Department of Physiology, All India Institute of Medical Sciences, New Delhi, India. dr.prashanttayade@gmail.com
-
Received: ,
Accepted: ,
How to cite this article: Tayade P, Kaur S, Muthukrishnan SP, Sharma R, Saini G. EEG microstates in resting condition in young indians. Indian J Physiol Pharmacol 2022;66:175-80.
Abstract
Objectives:
The map topography analysis gives an idea of temporal dynamics of electric fields, which is reference independent, making the results unambiguous. These topographic maps remain stable for 80 to 100 milliseconds, abruptly shifting to a new topographic map configuration and remains stable in that state are called the ‘functional microstates’ as described by Lehmann et al (1987). There has been no study done in the resting state eye closed and eye open conditions showing the microstate maps in healthy Indian subjects in resting eyes open and resting eyes closed condition using 128 channel EEG. So our study aim was to assess the microstates in resting eyes closed and eyes open condition. And to compare the microstate parameters such as mean duration, global explained variance (GEV) and time coverage between eyes closed and eyes open condition.
Materials and Methods:
A cross-sectional and observational study on 20 indian subjects (Mean age- 26.65 and (SD) - 2.78 years) was done on resting eyes closed and eyes open conditions. After EEG acquisition using 128 channel EEG machine, EEG was preprocessed and microstate analysis using CARTOOL software was performed on the EEG data.
Results:
After microstate analysis four maps topography were obtained. There was statistically non-significant difference observed in microstate maps between resting eyes closed and resting eyes open condition for the all parameters i.e. mean duration, time coverage and GEV.
Conclusion:
Our findings suggests that, both eyes closed and eyes open conditions were similar to each other in terms of stability and predominance of Maps.
Keywords
EEG Microstates
Eyes closed
Eyes Open condition
Map topography
128 channel high density EEG

INTRODUCTION
The traditional approaches of electroencephalography (EEG) and ERPs on selected location of electrode ignore the information like the simultaneous temporal and spatial representation along the time for electric potentials which is offered by multichannel EEG[1] In the time-frequency analysis of EEG, the amplitude of various frequency bands, however, varies according to reference electrodes, which makes the analysis ambiguous. There are different methods by which such dynamic information can be analysed like functional magnetic resonance imaging (fMRI) that has a high spatial resolution and EEG microstate analysis reflecting dynamic changes at sub-second level as EEG has a higher temporal resolution.[2]
Furthermore, for a large amount of data to be analysed, topographical mapping is suggested for clinical use.[3] With advantages of providing more concise and summarised spatiotemporal information with better visualisation of spatiotemporal patterns that are not otherwise noticed easily.[3,4] The map topography gives the idea of temporal dynamics of electric fields, which is reference independent, making the results unambiguous.[5] It has been found that these topographic maps remain quasi stable for about 80–120 ms, abruptly shifting to a new topographic map configuration and remain stable in that state.[3,4,6] These highly reproducible states of stable map topography are called the functional microstates. These microstates are proposed to be representing basic building blocks for information processing that is, ‘atoms of thought.’[4,7] The topographies can be a large in number but higher variance could be explained by a few specific topographies.[8] Furthermore, it is suggested that the study of the sequences of microstate can provide sub-second level brain’s information.[9]
Resting state is also a functionally active state and resting EEG could be used to know the brain activity while the task is not being done. Some changes or abnormalities might be detected by resting state EEG that could be different from the evoked potential.[10,11] Some studies on EEG in eye open (EO) and eye closed (EC) conditions have been done, demonstrating EEG power levels differing in various band widths, especially alpha power increase.[12] In a study using 32-channel EEG, in EC condition, power in the alpha band was higher and during EO periods, delta and beta powers was higher in prefrontal cortex.[13]
Topographic microstate analysis being a reference independent provides temporally dynamic, unambiguous sub-second level information[5] could yield a consistent information globally. Topographies of the microstates need to be determined in resting states such as EO and EC at baseline. As per the microstate studies in resting conditions, the study done by Britz et al. (2010)[14] using 64 channel EEG and analysing resting-state network using fMRI, showed the typical four microstates of the spontaneous EEG recording. These four microstates seemed to be correlating with the four of the resting state networks (RSN). Moreover, microstates were also showing much more rapid fluctuations than fMRI (due to different temporal resolution of the two techniques).
The global topological or connectome changes could be influenced by cultures depending on the holistic-analytical thinking style of the culture in resting conditions itself. Network properties in resting conditions can reflect individuals cultural background.[15] There are several studies mentioning the cultural influences on the neural brain networks like default mode network. Even the creative abilities are differently influenced across cross-culturally.[16] Hence, considering the Indian cultural influences affecting the resting conditions like EC and EO conditions, the study exploring on microstates topographies in resting condition in Indian subjects considering the cross-cultural differences needed to be done.
We hypothesised that there would be differences in mean duration, global explained variance (GEV) and time coverage of microstates between the EC and EO condition.
To the best of our knowledge, a study defining microstate maps in Indian subjects in EO and EC resting conditions using 128 channel EEG is not available.
Hence, we planned a feasibility study to analyse EEG microstates in resting EC and EO conditions in young Indian subjects.
MATERIALS AND METHODS
Participants
Twenty subjects (Mean age – 26.65 and SD – 2.78 years) of 20– 40 years’ age group of either gender who were right handed were involved in this study. Informed consent in written format was taken from the subjects and as per the Declaration of Helsinki for medical research, all procedures (latest revision) were done on human subjects and approval from the Institutional Ethics Committee of All India Institute of Medical Sciences, New Delhi, was taken. All participants were right-handed after assessment by Edinburgh handedness inventory (Oldfield 1971). The participants were the doctoral and postgraduate students of the institute, with no present or past history of medical illness, psychiatric, head trauma or substance use disorders and neurological disorder. Participants with at least 6.5 h of sleep duration in the previous night were included in the study. Participants on medication, alcohol, or any drugs consumed within 6 h were excluded from the study.[17]
Study design
The study type was observational and cross-sectional study. After explaining the experimental procedure through the information sheet (in the preferred language of the subject), informed consent in written was taken from the subjects. Experimental procedure was performed as follows;
On the day of recording, subjects were administered a short clinical interview to ensure that his affect and anxiety levels are within normal range. Subject were rested adequately and then 128 channel HydroCel Geodesic Sensor Net (HCGSN) was placed over his scalp for the purpose of recording EEG. A baseline record of EEG with 5 min’ EC followed by 5 min’ EO was taken. Participants were instructed to look at the fixation point on computer screen in front of them for EO condition to avoid eye blink and rolling artefacts.
EEG data acquisition
128-electrode HCGSN system (Electrical Geodesics Inc., Eugene, USA) was used in the study. The bandwidth: 0.05– 100 Hz, with vertex (Cz) as reference electrode was used for acquisition of EEG signal. The EEG was recorded in a noise-free and quiet environment room. Impedance was checked and was below 50 kΩ for each sensor, before EEG acquisition.
EEG pre-processing
EEGLAB toolbox was used for pre-processing of the EEG data.[18] Bandpass filtered was applied at 1–70 Hz. Runica algorithm in EEGLAB toolbox was used for independent component analysis. EEG artefacts such as ECG artefacts, muscle artefacts, eye blinks, line noise (50 Hz in India) and eye movements were removed. A total of 100 electrodes were included and 28 electrodes from outermost circumference were removed as those were the placement over face and neck. An average-referencing of EEG data was done and down sampling was done to 250 Hz.
Analysis of EEG microstates
For microstates analysis, global field power (GFP), that measures the standard deviation of spatially distributed scalp electric field potentials, was analysed.[19] Peaks of GFP represents ‘functional microstates. Segmentation of EEG data was done and using CARTOOL software. On these segmented epochs of EEG, microstates analysis was done.[5]
At first, the classes of scalp template (topography) maps within each subject across conditions (EC and EO) were identified which were applied on a k-means cluster analysis to yield the microstate maps which were most predominant.[20] The sufficient clusters numbers were determined by the cross-validation criterion with its minimum value be considered as optimal.[20]
The best representative microstate maps within each subject for EC and EO condition were identified on the basis of GEV and mean duration.
Then, the scalp topographies best representing the EO and EC conditions were identified across subjects. Again the maps were applied on the k-means cluster analysis and using the cross-validation criterion, the optimal solution was obtained.
The spatial correlation was computed among the microstates in EC and EO conditions. Statistical comparison with the help of Paired t-test was done on time coverage, mean duration and GEV of all the microstates maps (Topo plots) between the two resting conditions. Thus, the microstates maps were differentiated between EC and EO conditions.
RESULTS
Microstates analysis results
Four maps [Figure 1] sequentially Map-1, Map-2, Map-3 and Map-4 were found.
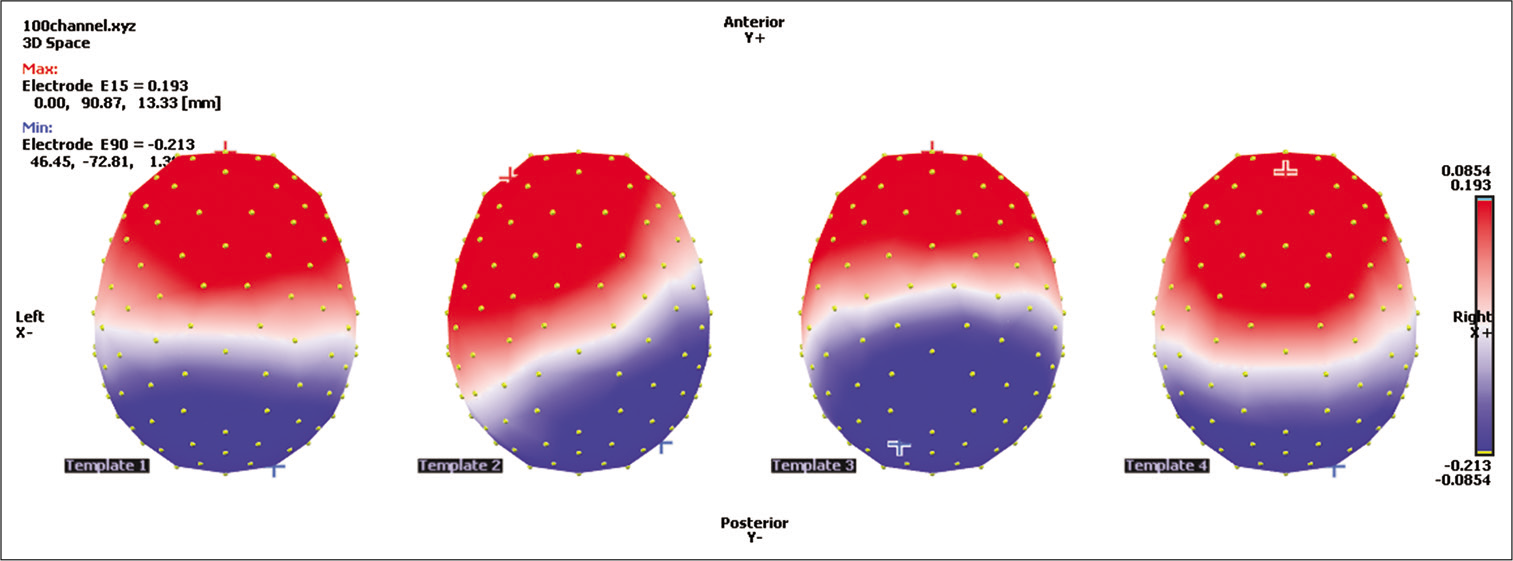
- Map topographies as Map-1, Map-2, Map-3 and Map-4 from the left to right sequentially.
Four scalp maps of microstates (topographies) obtained by means of k-means cluster analysis. Electrode positions are represented by yellow dots on the maps. The red and blue colours in colour scales represent the positive and negative values of intensity of scalp electrical potentials, respectively. The cross symbols in the colours blue and red represent the positions of the minima and maxima of scalp potential, spatially.
The microstates parameters for the Map-1, Map-2, Map-3 and Map-4 are shown in [Table 1].
| Microstates parameters | Map-1 | Map-2 | Map-3 | Map-4 |
|---|---|---|---|---|
| Mean Duration (ms) | ||||
| EC (Mean±SD) | 37.48±2.96 | 46.08±7.48 | 43.76±7.12 | 40.06±4.56 |
| EO (Mean±SD) | 39.52±7.28 | 47.4±6.56 | 43.2±8.08 | 41.76±7.4 |
| P-value (2-tailed) | 0.255 | 0.558 | 0.812 | 0.566 |
| Time coverage (%) | ||||
| EC (Mean±SD) | 0.173±0.041 | 0.318±0.082 | 0.274±0.090 | 0.234±0.066 |
| EO (Mean±SD) | 0.202±0.090 | 0.325±0.080 | 0.247±0.109 | 0.226±0.072 |
| P-value (two-tailed) | 0.209 | 0.792 | 0.400 | 0.710 |
| GEV | ||||
| EC (Mean±SD) | 0.098±0.041 | 0.126±0.047 | 0.114±0.058 | 0.107±0.051 |
| EO (Mean±SD) | 0.089±0.044 | 0.115±0.043 | 0.097±0.069 | 0.083±0.033 |
| P-value (2-tailed) | 0.492 | 0.457 | 0.406 | 0.081 |
EO: Eyes open, EC: Eyes closed, GEV: Global explained variance
The result of the paired t-tests is expressed in P-value (pairwise) row. P < 0.05 is considered statistically significant and is marked as an asterisk.
Statistically non-significant difference was observed in maps between resting EC and EO condition for all parameters that is, mean duration, time coverage and GEV.
DISCUSSION
The present study was planned to understand the EEG microstates in resting conditions (EC and EO) in young healthy Indian individuals. We found that there were only four microstates topography in both the resting conditions that is, EC and eyes opened conditions. Although the different studies had explored different numbers as well as the topographies of classes (maps) of microstates,[8,21,22] the 4-map topographies found in our study resemble the Classes B, C and D of the Koenig et al., 1999.[8] With the more recent fMRI based studies, Map 2 in our study that resembles the Class B which represents visual processing[9,11] and Maps 1 and 3 that resembles the Class C which represent the interoceptive to autonomic processing[9,11] While Map 4 resembles the Class D that represents the attentional reorientation.[9,11] fMRI studies showed that the microstates B, C and D which resemble Maps 2, 1 and 3 and 4 of our data, respectively, correspond to the RSN that were found associated with the visual network, the saliency networks and attention networks, respectively.[6,23] As opposed to our study, Britz et al., 2010, extracted ten microstates and using fMRI found RSNs temporally associated with microstates[23] Furthermore Yuan et al., 2012, found 13 microstates and ten different RSNs reflecting those microstates.[22] Hence, taking into consideration of cultural difference, the microstates in Indian young population would be yielding different networks. Maps 1 and 3 of our study resemble to the Map C which has recently been found to be linked with neuronal activity in the frontoparietal brain areas of working memory and attention. However, the study shows Map C, which is not reflected in our study.[24] Thus, simultaneous visual and autonomic processing with attentional relocation and salience network could be the resting networks activated in these microstates.
We hypothesised that in resting EC and EO condition, there would be difference in microstate parameters. However, during resting conditions, there was statistically no significant difference observed in maps between resting EC and EO condition for all parameters including mean duration, time coverage and GEV. As per literature, the mean duration of a microstate is defined as the average length of time for which microstate remains stable[4] (Lehmann et al., 1987) and while the percentage out of the total time that a microstate map is predominant is represented by time coverage[4] (Lehmann et al., 1987). Moreover, the total variance in percentage explained by a given microstate is referred as the GEV or GEV of microstates[25] (Brodbeck et al., 2012.) GEV is the ability of a map in explaining the strength with which it represents data and also its frequency of occurrence.[24]
Hence, our results show that between resting EC and EO conditions, there was no significant statistical difference found for time coverage, GEV and mean duration for all maps. This means that the stability and the predominance of the maps between EC and opened conditions were comparable and similar and these two states do not differ in terms of map topographies. There was no significant difference observed in GEV which suggests equal strength of the maps in representing the data between the EC and EO condition as well.
At electrode level, EEG signal represents a source made by the activation of group of neurons while looking at the topographical level information of EEG, it might represent the transiently coordinated local group of neurons at some intervals. In our finding, only a small number (four) and temporally well-defined topographies are suggestive of better coordination and signal coherence occurring temporally across larger areas cortical surface generating quasistable microstates.[6] Thus, the functional microstates EEG maps represent the coordinated activity of different neural groups activated sequentially along the time series leading to rapid switching or transition from one microstate to the other and change in distribution of neuronal dipole activity could lead topographical map to change.[4,6,24,26] While the resting networks activated between the EO and EC condition in our study could indicate simultaneous visual and autonomic processing with attentional relocation and salience network, but there could be different networks activated also. Hence, further exploration on large data might yield more clear understanding between resting EC and EO conditions.
CONCLUSION
The present study was aimed to understand the EEG microstates in resting conditions (EC and EO in young healthy Indian individuals. Four microstate maps were found to be representing the baseline EC and EO conditions. There was no statistical significant difference found between the two conditions, for time coverage and mean duration indicating that both conditions must be similar to each other in terms of stability and predominance of maps. Networks such as visual, salience and autonomic networks could be probably activated in both EC and EO conditions reflecting these four microstates as suggested by various finding from different studies, which needs to be explored further in EC and EO condition.
Limitations
Our study was done on a small sample size. Further studying on large sample might yield significant results.
The study has not explored the source analysis and functional connectivity analysis of the Microstates obtained, which would yield clear brain areas and network connectivity between the areas for the microstates.
Acknowledgments
We are thankful to the subjects for participation in this study.
Declaration of patient consent
Institutional Review Board (IRB) permission obtained for the study.
Financial support and sponsorship
Intra-mural Grant from AIIMS New Delhi.
Conflicts of interest
There are no conflicts of interest.
References
- Analysis of Multichannel EEG: Spatio Temporal Parcellation (STEP). Electrical and Electronics Engineers in Israel (IEEEI) 2012 IEEE 27th Convention. 2012:1-5.
- [CrossRef] [Google Scholar]
- EEG microstates as a tool for studying the temporal dynamics of whole-brain neuronal networks: A review. NeuroImage. 2018;180:577-93.
- [CrossRef] [PubMed] [Google Scholar]
- Topographic display of evoked potentials: Clinical applications of brain electrical activity mapping (BEAM) Ann N Y Acad Sci. 1982;388:183-96.
- [CrossRef] [PubMed] [Google Scholar]
- EEG alpha map series: Brain micro-states by space-oriented adaptive segmentation. Electroencephalogr Clin Neurophysiol. 1987;67:271-88.
- [CrossRef] [Google Scholar]
- Spatiotemporal analysis of multichannel EEG: CARTOOL. Comput Intell Neurosci. 2011;2011:813870.
- [CrossRef] [PubMed] [Google Scholar]
- Microstates in resting-state EEG: Current status and future directions. Neurosci Biobehav Rev. 2015;49:105-13.
- [CrossRef] [PubMed] [Google Scholar]
- Brain electric microstates and cognition: The atoms of thought In: John ER, Harmony T, Prichep LS, Valdés-Sosa M, Valdés-Sosa PA, eds. Data, Theory, and Speculations about Higher Brain Function. Boston, MA: Birkhäuser; 1990. p. :209-24.
- [Google Scholar]
- A deviant EEG brain microstate in acute, neuroleptic-naive schizophrenics at rest. Eur Arch Psychiatry Clin Neurosci. 1999;249:205-11.
- [CrossRef] [PubMed] [Google Scholar]
- EEG microstate sequences in healthy humans at rest reveal scale-free dynamics. Proc Natl Acad Sci U S A. 2010;107:18179-84.
- [CrossRef] [PubMed] [Google Scholar]
- Clinical applications of resting state functional connectivity. Front Syst Neurosci. 2010;4
- [CrossRef] [PubMed] [Google Scholar]
- Resting state fMRI: A personal history. Neuroimage. 2012;62:938-44.
- [CrossRef] [PubMed] [Google Scholar]
- EEG differences between eyes-closed and eyes-open resting conditions. Clin Neurophysiol. 2007;118:2765-73.
- [CrossRef] [PubMed] [Google Scholar]
- EEG differences between eyes-closed and eyes-open conditions at the resting stage for euthymic participants. Neurophysiology. 2017;49:432-40.
- [CrossRef] [Google Scholar]
- BOLD correlates of EEG topography reveal rapid resting-state network dynamics. Neuroimage. 2010;52:1162-70.
- [CrossRef] [PubMed] [Google Scholar]
- Functional connectome fingerprint of holistic-analytic cultural style. Soc Cogn Affect Neurosci. 2022;17:172-86.
- [CrossRef] [PubMed] [Google Scholar]
- The neural underpinnings of cross-cultural differences in creativity. Hum Brain Mapp. 2018;39:4493-508.
- [CrossRef] [PubMed] [Google Scholar]
- Brain networks communicate through theta oscillations to encode high load in a visuospatial working memory task: An EEG connectivity study. Brain Topogr. 2020;33:75-85.
- [CrossRef] [PubMed] [Google Scholar]
- EEGLAB: An open source toolbox for analysis of single-trial EEG dynamics including independent component analysis. J Neurosci Methods. 2004;134:9-21.
- [CrossRef] [PubMed] [Google Scholar]
- Reference-free identification of components of checkerboard-evoked multichannel potential fields. Electroencephalogr Clin Neurophysiol. 1980;48:609-21.
- [CrossRef] [Google Scholar]
- Segmentation of brain electrical activity into microstates: Model estimation and validation. IEEE Trans Biomed Eng. 1995;42:658-65.
- [CrossRef] [PubMed] [Google Scholar]
- EEG microstates indicate heightened somatic awareness in insomnia: Toward objective assessment of subjective mental content. Front Psychiatry. 2018;9:395.
- [CrossRef] [PubMed] [Google Scholar]
- Spatiotemporal dynamics of the brain at rest-exploring EEG microstates as electrophysiological signatures of BOLD resting state networks. Neuroimage. 2012;60:2062-72.
- [CrossRef] [PubMed] [Google Scholar]
- Errors can be related to pre-stimulus differences in ERP topography and their concomitant sources. Neuroimage. 2010;49:2774-82.
- [CrossRef] [PubMed] [Google Scholar]
- Resting-state EEG microstates parallel age-related differences in allocentric spatial working memory performance. Brain Topogr. 2021;34:442-60.
- [CrossRef] [PubMed] [Google Scholar]
- EEG microstates of wakefulness and NREM sleep. Neuroimage. 2012;62:2129-39.
- [CrossRef] [PubMed] [Google Scholar]
- The neural origins of human event-related potentials. Ann N Y Acad Sci. 1982;388:125-38.
- [CrossRef] [PubMed] [Google Scholar]


