
Translate this page into:
Effect of dual blockade of renin-angiotensin system on renal nephrin and vascular endothelial growth factor – A expression in diabetic-hypertensive rats
*Corresponding author: Asmaa Hussien Elsayed Mobarak, Department of Medicinal and Pharmaceutical Chemistry (Pharmacology Group), National Research Centre, Cairo, Egypt. asmaa.mobarak@gmail.com
-
Received: ,
Accepted: ,
How to cite this article: Mobarak AHE, El Sayed NS, Maklad YA, Kenawy SA. Effect of dual blockade of renin-angiotensin system on renal nephrin and vascular endothelial growth factor – A expression in diabetic-hypertensive rats. Indian J Physiol Pharmacol 2022;66:157-67.
Abstract
Objectives:
The effects of early renin-angiotensin system (RAS) blockade using angiotensin-converting enzyme (ACE) inhibitor lisinopril and/or angiotensin receptor blocker valsartan on renal nephrin and vascular endothelial growth factor (VEGF)-A gene expression were investigated in diabetic-hypertensive rats.
Materials and Methods:
Diabetes and hypertension were induced in adult Wistar rats using streptozotocin (45 mg/kg, i.p.) and Nω-nitro-L-arginine methyl ester (60 mg/kg/12 h) for 4 consecutive days. Experimental animals were allocated into six groups (n = 6): normal control, diabetic control, diabetic-hypertensive control and lisinopril-, valsartan- and combination-treated diabetic-hypertensive groups (5 mg/kg/drug/day, p.o., for 21 days). Blood glucose, blood pressure, body weight, kidney weight to body weight ratio, serum albumin, creatinine, total protein and urea were measured and recorded every week. Nephrin and VEGF-A gene expression were measured using real-time polymerase chain reaction. Renal nephrin protein was measured using ELISA as well as nephrin immunostaining.
Results:
Blood pressure was significantly decreased by all treatments (P ≤ 0.05). All treatments normalised serum albumin and urea. Serum creatinine significantly decreased, while total protein significantly increased (P ≤ 0.05). Nephrin gene expression had a non-significant decrease in diabetic-hypertensive rats, yet it was statistically increased with individual treatments (P ≤ 0.05) and normalised with combined treatment. Renal nephrin protein significantly decreased in diabetic-hypertensive rats, normalised by lisinopril and significantly increased by valsartan and combined treatments (P ≤ 0.05). VEGF-A expression significantly increased in diabetic-hypertensive rats and significantly decreased with lisinopril and valsartan monotherapy and normalised with combined treatment (P ≤ 0.05). Immunostaining of nephrin also showed an obvious increase in the case of combined treatment.
Conclusion:
Early dual blockade of RAS in diabetic-hypertensive rats protected against renal damage and improved renal nephrin and VEGF-A gene expression as well as renal nephrin protein expression.
Keywords
Renin-angiotensin system
Streptozotocin
Nω-nitro-L-arginine methyl ester
Nephrin
Vascular endothelial growth factor

INTRODUCTION
Diabetes is a metabolic disorder characterised by chronic hyperglycaemia. Diabetes complications are mainly divided into macrovascular complications, including stroke, cardiovascular disease and peripheral artery disease and microvascular complications consisting of retinopathy, neuropathy and nephropathy.[1]
Diabetic nephropathy is considered an inflammatory disorder.[2]Although its development and progression exact mechanism(s) are not yet fully understood, many critical pathophysiological pathways have been postulated, including metabolic changes that increase glycation, haemodynamic changes that trigger the renin-angiotensin-aldosterone system renin-angiotensin system (RAS), activated polyol pathway, increased protein kinase C activity and identifying genetic susceptibilities.[3]
Ang II, a primary factor of the RAS, plays a pivotal role in diabetic nephropathy. It was reported to be elevated along with reactive oxygen species generation by macrophages and lymphocytes during this inflammation.[4] Concerning the kidneys, a local renal RAS was activated by high glucose. Ang II levels increased in high glucose-treated podocytes, with enhanced expression of angiotensinogen and angiotensin II type 1 receptor.[5] This could lead to podocyte glucose-induced hypertrophy, which was improved by angiotensin type 1 receptor blocker.[6,7] Moreover, Ang II is relevant in modulating nephrin expression, an essential component of the podocyte slit diaphragm.[8] Its expression was diminished and its localisation changed in biopsies of patients with diabetic nephropathy from both types 1 and 2.[8] Therefore, podocytes and their specific proteins present attractive biomarkers for either diagnosing or predicting diabetic nephropathy.[9]
In addition, vascular endothelial growth factor (VEGF) expression was stimulated by hypoxic conditions, obesity,[10] hyperglycaemia and many growth factors and cytokines, such as TGF-β1 and Ang II, leading to endothelial nitric oxide synthesis.[11] This, in turn, enhanced vasodilatation and hyperfiltration, which are the early processes in diabetic nephropathy. Furthermore, VEGF was responsible for the α3 chain of collagen IV production, a main component of the glomerular basement membrane. Consequently, VEGF could indirectly enhance the production of the collagen chain, which participates in glomerular basement membrane thickening seen in diabetic nephropathy.[12]
This study investigated RAS blockade with angiotensin-converting enzyme (ACE) inhibitor and/or angiotensin receptor blocker (ARB) since they have become a way of choice to control blood pressure, especially in case of diabetes coexisting. This is not only because it is important to manage blood pressure but also due to their renoprotective effects. These medications affect RAS through different approaches, which might lead to variances in their antihypertensive effects. The first approach is based on the fact that ACE inhibitors (ACEI) decrease Ang II by binding to the enzyme’s active site, hence interfering with its ability to bind to and cleave its substrates, angiotensin I, into angiotensin II and bradykinin into inactive peptides.[13] The second approach is related to the specific blocking of Ang II from binding to AT1 receptors using ARBs.[14] This blockade of the AT1 receptor consequently increases the local angiotensin II concentration that stimulates the unblocked AT2 receptor.[15]
In terms of treatment intervention, early administration of ACEI significantly decreased systemic blood pressure and normalised urinary protein excretion in rats with streptozotocin (STZ)-induced diabetes. In contrast, a late intervention did not control proteinuria, although blood pressure was effectively controlled.[16] He et al.,[17] in their study investigating the effects of dual blockade of RAAS in normotensive patients, demonstrated that ACEIs or ARBs could decrease albuminuria to different degrees in normotensive patients with diabetic kidney disease and showed that a better response occurred in patients with type 2 diabetes mellitus. It was stated that side effects did not differ among these groups. This shows the clinical tendency to investigate the early use of this strategy even before blood pressure increases. This is based on published guidelines, which recommend ACEIs or angiotensin II receptor blockers (ARBs) as the first-line drugs for diabetic kidney patients with hypertension to decrease cardiovascular risk, kidney failure and death.[18]
Consequently, the present study was designed to elucidate the possible underlying beneficial renoprotective effects afforded by early dual RAS blockade in diabetic-hypertensive rats and their effects on renal nephrin and VEGF gene expression.
MATERIALS AND METHODS
Materials
Lisinopril (Sedico Pharmaceutical Company, Cairo), Egypt; valsartan (Ciba-Geigy, ON, Canada); albumin assay kit (Biodiagnostic, Cairo, Egypt), blood glucose kit (Biodiagnostic), creatinine assay kit (Biodiagnostic), total protein kit (Biodiagnostic), urea kit (Biodiagnostic), formalin (El Nasr Pharmaceutical Chemicals Co., Cairo, Egypt), sodium citrate tribasic dihydrate (Riedel-de Haën, Seelze, Germany), citric acid anhydrous (Panreac Química S.A., Barcelona, Spain), glucose solution 10% w/v (Egypt Otsuka Pharmaceutical Co., Cairo, Egypt), STZ and Nω-nitro-L-arginine methyl ester (L-NAME) hydrochloride were procured from Sigma Chemical (USA) and citric acid anhydrous (Panreac Química S.A).
Methods
Experimental protocol and induction of diabetes and hypertension
Adult male albino Wistar rats (weight, 175–250 g) (n = 36) were secured from the Research Institute of Ophthalmology (Giza, Egypt). Throughout the period of investigation, all rats were provided with a standard pellet diet (El-Nasr Company, Cairo, Egypt), allowed water ad libitum and maintained at 22 ± 1°C with humidity at 55 ± 5 and on a 12 h light/dark cycle. All animal procedures were approved by the Ethics Committee of the National Research Centre, Cairo, Egypt, and in accordance with the recommendations for the proper care and use of laboratory animals (Canadian Council on Animal Care Guidelines, 1984). All efforts were made to minimise animal pain and distress.
Diabetes was chemically induced using a single intraperitoneal injection of freshly dissolved STZ (45 mg/kg) in citrate buffer pH 4.5.[19] Severe hypoglycaemia was induced one hour following STZ injection. Therefore, tap water was replaced with a 5% glucose solution for the first 24 h. After 48 h, blood glucose levels were tested, and rats that manifested both hyperglycaemia ≥250 mg/dL and glucosuria were considered diabetic.
Hypertension was then induced in diabetic rats by intraperitoneally injecting L-NAME (60 mg/kg/12 h) for 4 consecutive days.[20] Systolic blood pressure was measured using the indirect tail-cuff method. After 7 days of diabetes induction, animals were allocated into six groups (n = 6): (Group 1) normal control (N), (Group 2) diabetic control (D), (Group 3) diabetic-hypertensive control (DH), (Group 4) diabetic-hypertensive treated with lisinopril (DH-L) (5 mg/kg/day; p.o. through oral gavage), (Group 5) diabetic-hypertensive treated with valsartan (DH-V) (5 mg/kg/day; p.o. through oral gavage) and (Group 6) diabetic-hypertensive treated with combination of lisinopril and valsartan (DH-L+V) (5 mg/kg/day/drug; p.o. through oral gavage). Treatment continued for 21 days.
Blood and tissue collection
Blood samples were collected before induction, before treatment as well as every 7th day of treatment, through the eye retro-orbital plexus and left to clot for 30 min. Serum was separated by centrifugation at 3000 rpm for 30 min and stored at −80°C until blood glucose, serum albumin, creatinine, total protein and urea were analysed.
At the end of the experiment (31 days), animals were anaesthetised using sodium pentobarbital (45 mg/kg, i.p.), then sacrificed by decapitation, and kidneys were excised, washed in saline and weighed. Right kidneys were cut longitudinally, and one-half of each was aliquoted, flash frozen in liquid nitrogen and stored at −80°C for RNA preparation. The second halves were immersed and fixed in phosphate-buffered 10% formalin solution to prepare a paraffin section.
Measurement of systolic blood pressure, body weight and biochemical parameters
Systolic blood pressure measurements were carried out by the indirect tail-cuff method (model ML 125 NIBP, A D Instruments Pty. Ltd., Sydney, Australia). Body weight was recorded and biochemical markers, including blood glucose, serum albumin, serum creatinine, total serum protein and serum urea, were measured using commercial kits, according to the manufacturer’s instructions. Measurements were performed before induction and treatment, as well as every 7th day of treatment.
RNA preparation and reverse transcription
Total RNA was isolated and extracted from aliquots of the kidneys using an RNeasy mini tissue kit (Qiagen, Germany), according to the manufacturer’s protocol. Total RNA (0.5 µg) was reverse transcribed using Oligo-(dT) primers (Bio Basic Canada Inc., ON, Canada) in a 20 µl reaction. Reverse transcription reactions were carried out at 25°C for 10 min followed by 42°C for 60 min and 95°C for 5 min. The resulting first-strand cDNA was stored at −20°C until used for quantitative real-time polymerase chain reaction.
Real-time polymerase chain reaction of nephrin and VEGF-A
Gene expression was assessed through quantitative reverse transcription polymerase chain reaction (PCR), which was carried out on a Rotor Gene Q Real-Time PCR system (Qiagen, Santa Clara, CA), using glyceraldehyde-3-phosphate dehydrogenase (GAPDH) mRNA as an endogenous non-regulated control. Sequences used as primers were as follows: Nephrin,[21] forward 5’-CCC AGG TAC ACA GAG CAC AG-3’, reverse 5’-CTT ATG CTG ACA ACC TTC AG-3’, VEGF-A[22] forward 5’-CCC TGG CTT TAC TGC TGT ACC T-3’, reverse 5’-CCC TTC TGT CGT GGG TGC-3’ and GAPDH[23] forward 5’-TCC CTC AAG ATT GTC AGC AA-3’, reverse 5’-AGA TCC ACA ACG GAT ACA TT-3’ (Bio Basic Canada Inc., ON, Canada). SYBR-PCR was performed using the RT2 SYBR Green/ROX qPCR Master Mix (Qiagen Sciences, MD, USA) in a 25 µL final volume. The amplification conditions for quantification were 10 min at 95°C and 40 cycles of 95°C for 15 s and 60°C for 30 s. After validation of each target and reference gene amplification efficiency, the relative gene expression levels were determined by the ΔΔCT method as described by Livak and Schmittgen.[24] The levels of gene expression were expressed as the normalised ratio of gene expression relative to the GAPDH mRNA level using one sample from the control group as a calibrator.
Renal nephrin concentration measurement using ELISA
A fixed weight of renal tissue punch (50 mg) was homogenised in 1.5 mL extraction buffer (containing 10 mM Tris pH 7.4, 150 mM NaCl, 1% Triton X-100) per gram of tissue using a glass homogeniser (BioSpec Products, mini-BeadBeater-8, OK, USA). The incubation mixture was placed on ice and sonicated for 20–30 s. The homogenates were then centrifuged (Z 323 K Hermle Labortechnik, Wehingen, Germany) for 15 min at 5000×g to obtain the supernatant (samples). The standards and samples were applied to the wells of a 96-well microtitre plate in duplicate and incubated for 90 min at 37°C. The liquid was then removed and biotinylated detection Ab (100 µL) was added and incubated for 1 h at 37°C. After aspiration and washing 3 times, avidinhorseradish peroxidase conjugate (100 µL) was added and incubated for 30 min at 37°C. This was followed by aspiration and washing 5 times. The substrate reagent (90 µL) was then added and incubated for 15 min at 37°C. Finally, the stop solution (50 µl) was added and absorbance was immediately read at 450 nm (reference λ 600 nm) using a microplate reader Sunrise (Tecan, Austria).[25]
Histopathology and nephrin immunostaining
Kidney sections were stained with haematoxylin and eosin stain (×200) for routine histopathological examination. Another group of sections was mounted on charged slides for nephrin immunostaining (×400), which was performed using an avidin-biotin-peroxidase system. The primary antibody used was anti-nephrin, NPHS1 antibody (GTX85843, GeneTex, CA, USA), diluted 1:50. Normal kidney was used as a positive control (positive podocytes were stained brown).
Statistical analyses
All data are expressed as the mean ± SEM. According to the nature of the determined parameter, the results were analysed using one-way analysis of variance, followed by Tukey– Kramer as a post hoc test using SPSS 15.0 software (NY, USA). For all tests, statistical significance was set at P ≤ 0.05.
RESULTS
Effect of different treatments on systolic blood pressure, blood glucose, body weight and kidney weight to body weight ratio
Systolic blood pressure was significantly elevated in diabetic-hypertensive rats (146.45 ± 1.48 mmHg, P ≤ 0.05). Lisinopril, valsartan and combined treatment significantly reduced blood pressure after 7 days of administration and remained low until the end of the experiment (129.61 ± 0.67 mmHg, 129.49 ± 1.18 mmHg and 127.61 ± 0.95 mmHg, P ≤ 0.05, respectively) compared to untreated diabetic-hypertensive animals [Table 1].
| Day | Normal control | Diabetic control | Diabetic-hypertensive control | DH-L | DH-V | DH-L+V |
|---|---|---|---|---|---|---|
| n=6 | n=6 | n=6 | n=6 | n=6 | n=6 | |
| 0 | 112.35±0.92 | 115.08±1.72 | 113.31±0.55 | 114.07±0.82 | 112.11±1.23 | 115.18±0.76 |
| 7 | 113.25±0.70 | 131.72±0.75a | 146.45±1.48a | 129.61±0.67ab | 129.49±1.18ab | 127.61±0.95ab |
| 14 | 111.33±0.86 | 129.93±0.95a | 153.28±1.43a | 129.94±1.33ab | 130.72±0.70ab | 127.18±0.86ab |
| 21 | 112.90±0.69 | 136.19±1.09a | 156.96±0.97a | 129.89±1.11ab | 130.66±0.74ab | 126.77±0.40ab |
Values are expressed as mean±SEM. aP≤0.05 versus normal control rats. bP≤0.05 versus diabetic-hypertensive rats.
Blood glucose was significantly increased after induction with STZ, and neither individual nor combined treatment changed its levels, P ≤ 0.05 [Figure 1].
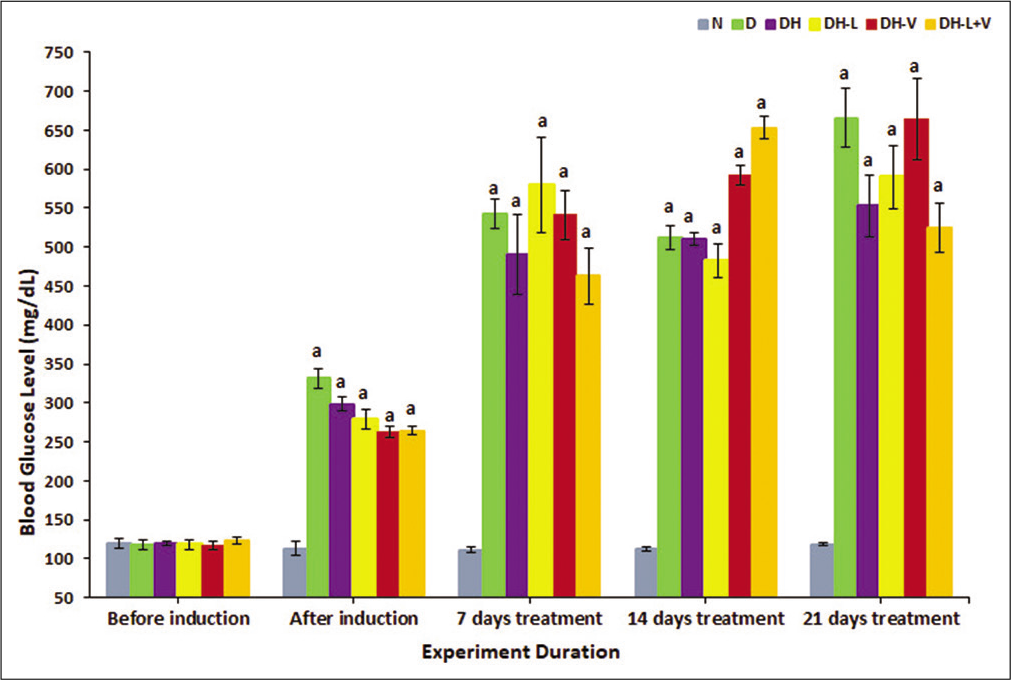
- Effects of weeks of daily treatment with lisinopril (L), valsartan (V) and their combination (L+V) on blood glucose (mg/dL) in diabetic-hypertensive rats (DH). Measurements were taken before and after induction and every 7th day of treatment. Values are expressed as mean ± SEM, n = 6. aP ≤ 0.05 versus normal control rats.
In untreated diabetic-hypertensive rats, body weight and kidney weight/body weight were significantly decreased compared to normal rats. Neither monotherapy nor combination treatment suppressed the significant decrease in body weight compared to normal [Table 2]. However, the kidney weight to body weight ratio of all treated rats was significantly decreased to normal control levels [Table 3] (P ≤ 0.05).
| Day | Normal control | Diabetic control | Diabetic-hypertensive control | DH-L | DH-V | DH-L+V |
|---|---|---|---|---|---|---|
| n=6 | n=6 | n=6 | n=6 | n=6 | n=6 | |
| 0 | 203.50±5.67 | 202.50±5.77 | 208.67±4.29 | 205.00±5.37 | 200.67±5.68 | 204.67±7.17 |
| 7 | 256.17±6.47 | 199.00±8.37a | 197.67±10.84a | 199.17±8.01a | 184.83±8.75a | 192.50±7.63a |
| 14 | 277.50±8.34 | 202.33±7.67a | 184.17±16.67a | 210.00±9.22a | 197.17±8.08a | 202.83±5.71a |
| 21 | 294.17±8.92 | 199.83±10.85a | 175.17±14.98a | 213.00±13.46a | 201.17±9.03a | 196.67±14.31a |
Values are expressed as mean±SEM. aP≤0.05 versus normal control rats. bP≤0.05 versus diabetic-hypertensive rats
| Normal control | Diabetic control | Diabetic-hypertensive control | DH-L | DH-V | DH-L+V | |
|---|---|---|---|---|---|---|
| n=6 | n=6 | n=6 | n=6 | n=6 | n=6 | |
| KW/BW ×102 | 0.298±0.012 | 0.513±0.022a | 0.622±0.082a | 0.448±0.036 | 0.467±0.032 | 0.449±0.039 |
Values are expressed as mean±SEM. aP≤0.05 versus normal control rats
Effect of different treatments on serum albumin, creatinine, total protein and urea
Serum albumin and total protein were markedly reduced in diabetic-hypertensive rats. Valsartan and combined treatment attenuated this reduction in serum albumin. Lisinopril normalised serum albumin and total protein after 21 days, P ≤ 0.05 [Figure 2a].
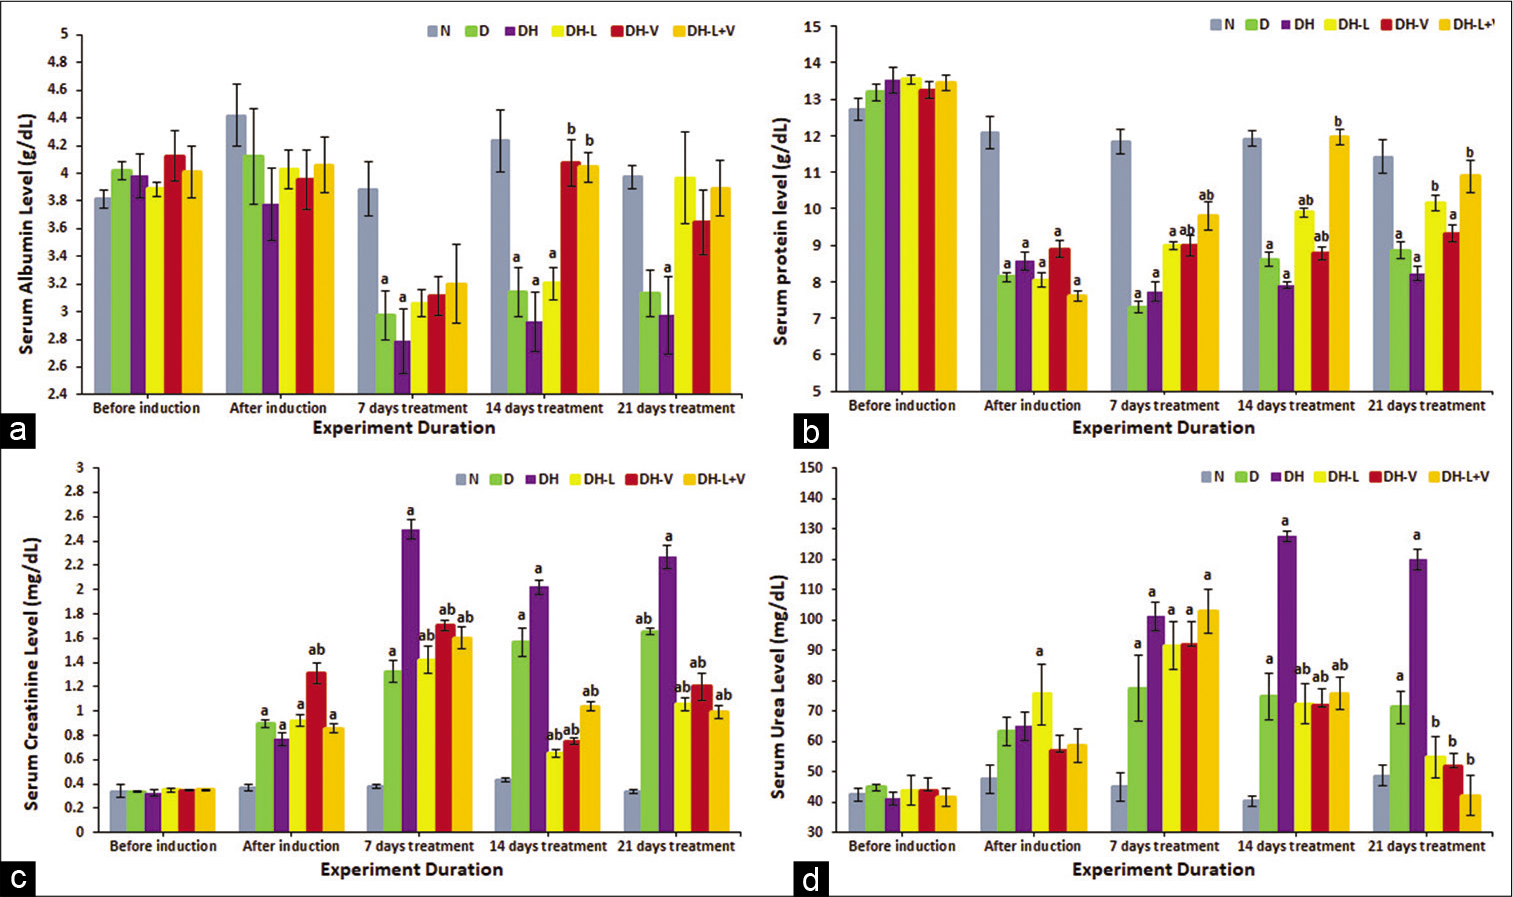
- Effects of 3 weeks of daily treatment with lisinopril (L), valsartan (V) and their combination (L+V) on (a) serum albumin (g/dL), (b) total protein (g/dL), (c) creatinine (mg/dL) and (d) urea (mg/dL) in diabetic-hypertensive rats (DH). Measurements were taken before and after induction and every 7th day of treatment. Values are expressed as mean ± SEM, n = 6. aP ≤ 0.05 versus normal control rats. bP ≤ 0.05 versus diabetic-hypertensive rats.
On the other hand, total serum protein was normalised after only 14 days of combined drug administration. However, compared to diabetic-hypertensive rats, valsartan significantly increased total protein after 7 days, yet still less than normal control levels, P ≤ 0.05. Lisinopril eventually normalised total protein levels after 21 days [Figure 2b].
Serum urea and creatinine significantly increased in diabetic-hypertensive rats, P ≤ 0.05. Serum creatinine was significantly decreased with all treatments after 7 days of administration, P ≤ 0.05 [Figure 2c]. Similarly, monotherapy and combined therapy decreased serum urea to normal control levels and later even significantly lowered it compared to diabetic-hypertensive levels, P ≤ 0.05 [Figure 2d].
Effect of different treatments on nephrin and VEGF-A gene expression and renal nephrin protein
Nephrin gene decreased, yet not significantly, in diabetic-hypertensive rats. However, both monotherapies significantly increased renal nephrin gene expression compared to the normal control. However, the combined treatment maintained nephrin gene expression at normal values, P ≤ 0.05 [Figure 3a].
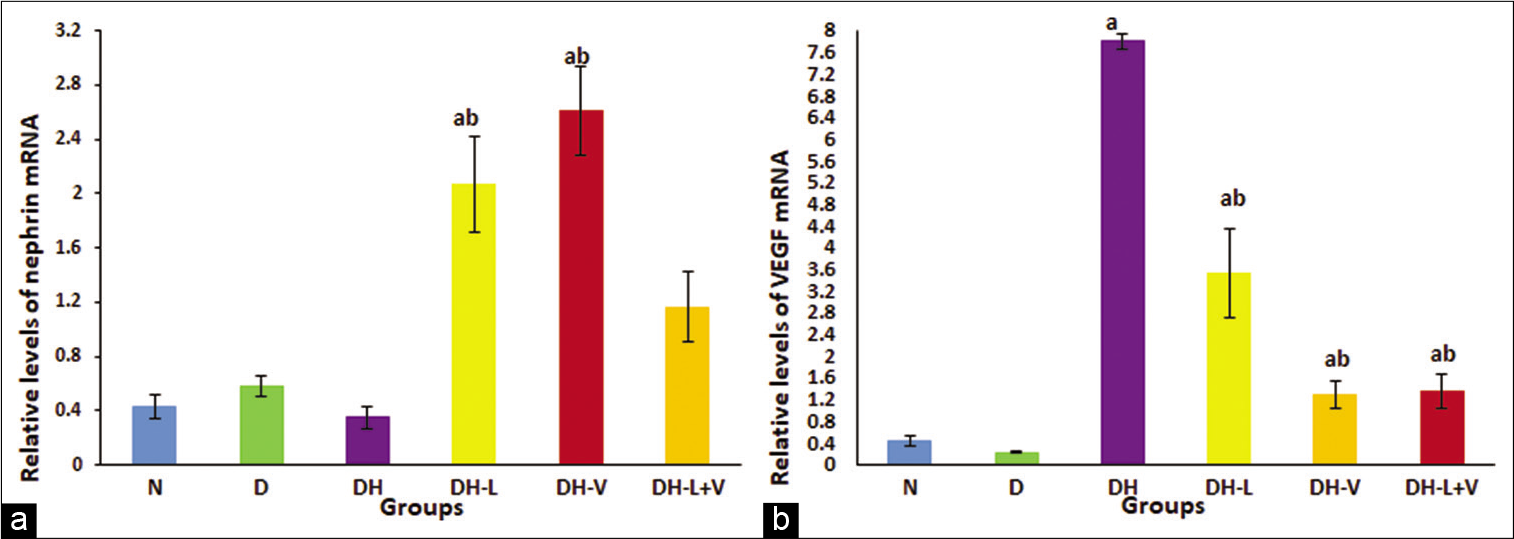
- Effects of 3 weeks of daily treatment with lisinopril (L), valsartan (V) and their combination (L+V) on (a) renal nephrin gene expression by real-time quantitative polymerase chain reaction (PCR) and (b) renal vascular endothelial growth factor gene expression by real-time quantitative PCR in diabetic-hypertensive rats (DH). Plotted values are the relative mRNA levels normalised to glyceraldehyde-3-phosphate dehydrogenase mRNA levels and are expressed as mean ± SEM, n = 6. aP ≤ 0.05 versus normal control rats. bP ≤ 0.05 versus diabetic-hypertensive rats.
On the other hand, VEGF-A gene expression was markedly increased in diabetic-hypertensive rats compared to normal control rats; this elevation was controlled significantly by valsartan as well as combined treatment and decreased to normal control values. Lisinopril administration significantly reduced the elevated levels of VEGF-A, although the levels were not similar to the normal control values, P ≤ 0.05 [Figure 3b].
Renal nephrin protein decreased significantly in diabetic-hypertensive rats. Lisinopril treatment increased nephrin protein to normal levels. Nevertheless, valsartan and combined treatments significantly increased nephrin protein compared to untreated diabetic-hypertensive and normal values, P ≤ 0.05 [Figure 4].
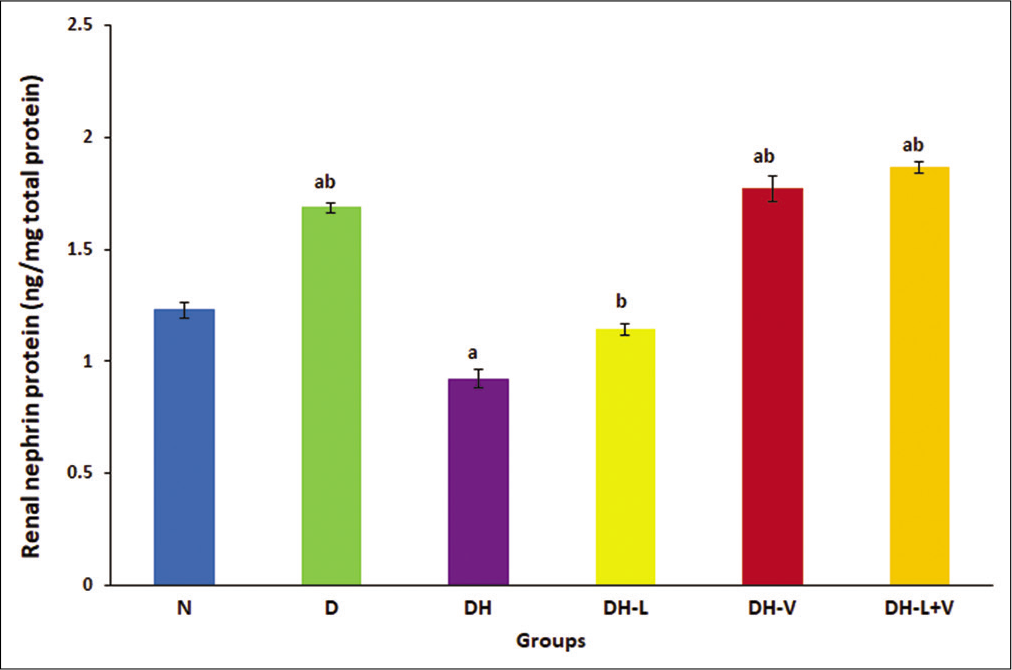
- Effects of 3 weeks of daily treatment with lisinopril (L), valsartan (V) and their combination (L+V) on renal nephrin protein by ELISA in diabetic-hypertensive rats (DH). Values are expressed as mean ± SEM, n = 6. aP ≤ 0.05 versus normal control rats. bP ≤ 0.05 versus diabetic-hypertensive rats.
Histopathology
In normal control rats, kidney sections appeared normal [Figure 5a]. Changes in sections of diabetic rats were shown in [Figure 5b]. However, in diabetic-hypertensive rats, pathological changes were demonstrated [Figure 5c], including partial ischaemic collapse of some glomeruli, intratubular hyaline casts in a few tubules and mild thickening of blood vessels. Diabetic-hypertensive rats treated with lisinopril showed renal tissue protection, to some extent, including partial improvement of glomerular collapse and partial reparative changes in atrophic tubules [Figure 5d]. However, valsartan monotreatment showed improvement in glomerular collapse and tubular atrophic changes, with decreased thickening of renal blood vessels [Figure 5e]. Meanwhile, dual blockade showed more preservation of the renal tissue from the deteriorating effects of STZ- and L-NAME-induced diabetes and hypertension, as kidney histology became within normal, demonstrating improvement of glomerular collapse with decreased thickening of renal blood vessels and mild improvement of tubular changes [Figure 5f].
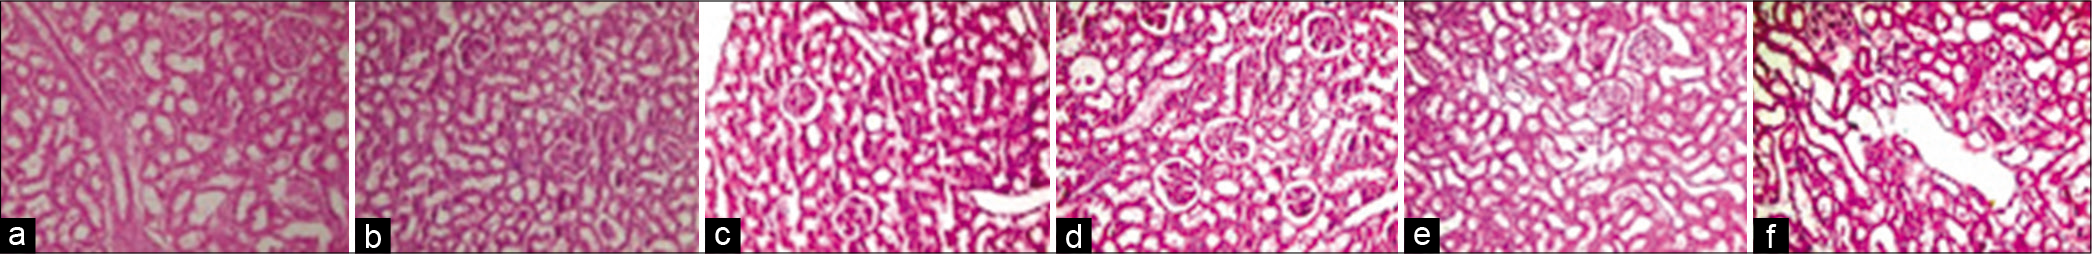
- H&E staining of kidney sections of normal control (a), diabetic control rats (b), diabetic-hypertensive control rats (c), lisinopril-treated diabetic-hypertensive rats (d), valsartan-treated diabetic-hypertensive rats (e) and lisinopril + valsartan-treated diabetic-hypertensive rats (f). Slight thickening of the glomerular basement membrane and blood vessels in diabetic rats and partial ischaemic collapse of some glomeruli and mild thickening of blood vessels in diabetic-hypertensive control rats compared with normal control and treated diabetic-hypertensive rats. Original magnification, ×200.
Nephrin immunostaining
Nephrin immunostaining in normal and diabetic rats are shown in [Figures 6a and 6b]. Nephrin almost disappeared in diabetic-hypertensive rats, as shown by immunostaining in [Figure 6c]. Either individual treatment demonstrated slightly stronger nephrin immunostaining compared to untreated diabetic-hypertensive rats [Figures 6d and 6e]. However, coadministration of lisinopril and valsartan showed obvious strength compared to untreated and monotreated diabetic-hypertensive rats [Figure 6f].
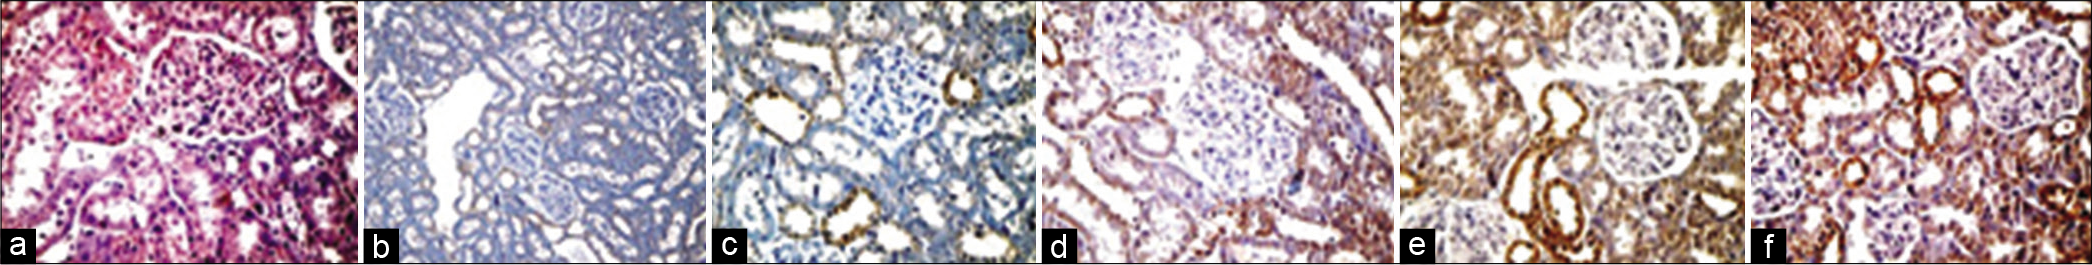
- Nephrin immunostaining of kidney sections from normal control (a), diabetic control rats (b), diabetic-hypertensive control rats (c), lisinopril-treated diabetic-hypertensive rats (d), valsartan-treated diabetic-hypertensive rats (e) and lisinopril + valsartan-treated diabetic-hypertensive rats (f). Very weak nephrin immunostaining in diabetic rats and almost disappeared in diabetic-hypertensive control rats compared with normal control and treated diabetic-hypertensive rats. Obviously stronger nephrin immunostaining in lisinopril+valsartan-treated diabetic-hypertensive rats compared with diabetic-hypertensive control rats. Original magnification, ×400.
DISCUSSION
In our study, diabetic-hypertensive rats suffered from hyperglycaemia, high blood pressure, decreased body weight and an increased ratio of kidney weight to body weight. Moreover, kidney function markers such as serum albumin and total protein were markedly reduced, whereas serum urea and creatinine increased significantly. Interestingly, nephrin gene expression showed a tendency to increase in diabetic rats, while both nephrin gene and protein decreased significantly in diabetic-hypertensive rats, and nephrin immunostaining almost disappeared. Aaltonen et al.[26] showed that glomerular nephrin expression in STZ-induced diabetic rats after 4 weeks of induction increased by 50% in diabetic rats. In contrast, they also stated that in long-term diabetes (up to 6 months), without blood glucose control, a consistent decrease in nephrin mRNA was recorded, indicating podocyte damage and loss of function. Hence, induction of hypertension in diabetic rats could enhance renal damage as expected. In contrast, an increase in nephrin mRNA levels was observed even before significant development of albuminuria in both STZ-induced diabetic rats and non-obese diabetic mice.[26] A divergence in nephrin expression changes in diabetic nephropathy could be due to the diversity in the underlying causes, such as the duration of diabetes, accompanying hypertension or differences in species.[6]
In our investigation, VEGF-A was significantly increased in diabetic-hypertensive rats, which was proposed to increase as a predisposing factor for microalbuminuria in type 1 diabetes by Santilli et al.[27] Chen et al.[28] observed an increase in the expression of VEGF mRNA and protein in diabetic rats and it was negatively correlated with nephrin expression. They explained that VEGF is involved in the pathophysiology of diabetic nephropathy, as it is primarily secreted by podocytes and binds to its receptors on glomerular endothelial cells and mesangial cells.[29] Hence, under hyperglycaemic conditions, VEGF could be overexpressed, promoting endothelial cell proliferation and glomerular capillary permeability increase, leading to increased glomerular filtration[30] and subsequently causing glomerulosclerosis and proteinuria.[28]
Interestingly, Baelde et al[31] revealed that VEGF levels showed an initial rise that could be transient, as later findings have shown an actual decrease in VEGF messenger RNA levels in diabetic nephropathy patients. These lower VEGF levels recorded in advanced diabetic nephropathy could be an outcome of podocyte loss with the progression of nephropathy.[11,31]
Studies have also shown that two factors, VEGF and ET (endothelin), are thought to be involved in diabetic renal microangiopathy development and progression by increasing vascular permeability and constriction of glomerular capillaries, respectively.[32,33] Therefore, in our investigation, pathological changes, including partial ischaemic collapse of some glomeruli, intratubular hyaline casts in a few tubules and mild thickening of blood vessels, were demonstrated in diabetic-hypertensive rats.
In our study, early RAS blockade, either with mono or combined therapy, showed different effects in guarding against renal damage, yet all treatments achieved the same blood pressure control. This indicates that the renoprotective effect could not be explained only by their hypotensive effect.[34]
Blood glucose levels and body weight throughout our experiment were not improved by any of the treatments. Although many studies have investigated the effect of ACEIs and ARBs on glucose metabolism, it is still debatable.[35,36]
In addition, both individual and combined treatments maintained the kidney weight to body weight ratio at normal control levels, indicating that kidney weight did not, at least, increase, reflecting its improvement as other markers revealed. Kidney function markers, including serum albumin, total protein, urea and creatinine, were normalised or even significantly improved in treated animals compared to untreated diabetic-hypertensive animals. Interestingly, valsartan and combined treatment normalised serum albumin after only 7 days of administration, while lisinopril showed its effect after 21 days. Serum creatinine was steadily improved to normal by coadministration of ACE-Is and ARBs compared to individual treatments. Moreover, total serum protein was normalised by lisinopril treatment after 21 days but not by valsartan treatment. Nevertheless, combined treatment normalised total protein after only 14 days. Serum urea was also decreased to normal levels after 21 days by all treatments. As a result, RAS dual blockade obviously protected the kidneys faster and more efficiently than monotherapy.
This is in agreement with the previous studies, which have suggested that ACEIs and ARBs exert their renoprotective effect through different channels. Mainly by opposing Ang II effects, as it causes vasoconstriction, mostly of post-glomerular arterioles, hence raising glomerular hydraulic pressure and the filtration fraction. In addition, it impairs the glomerular barrier size-selective function to macromolecules, such as plasma proteins.[37] This increase in the intracapillary pressure and in the ultrafiltration of plasma proteins may promote chronic renal damage onset and progression.[38] Ang II also has non-haemodynamic effects, such as enhanced reactive oxygen species production, cytokines upregulation, induction of transforming growth factor-b expression, increased synthesis of extracellular matrix proteins, stimulation of plasminogen activator inhibitor-1 production by endothelial and vascular smooth muscle cells and macrophage activation and infiltration, which may also be important in renal disease progression.[39]
In our investigation, administration of lisinopril markedly increased renal nephrin gene expression by 5-fold compared to normal levels, while renal nephrin protein increased to normal levels, which was reflected in immunostaining. Similarly, quinapril, another ACE-I, significantly increased nephrin expression in obese Zucker rats.[40] Furthermore, ACE inhibition using perindopril in addition to blocking advanced glycation end-product formation by aminoguanidine decreased proteinuria in long-term STZ-induced diabetic rats. However, only perindopril has normalised the diabetes-associated reduction in nephrin expression.[41]
However, VEGF-A gene expression was significantly decreased by 2-fold after lisinopril treatment compared to untreated diabetic-hypertensive rats. Studies have shown that high renal VEGF protein content in diabetic rats was significantly decreased after enalapril administration for 8 weeks.[42] Likewise, in type 1 STZ-induced diabetic rats, perindopril decreased the diabetes-associated elevation in retinal VEGF gene expression and vascular permeability to albumin.[43] Moreover, clinical studies in type 1 and type 2 diabetic patients with proliferative retinopathy indicated a strong negative correlation between vitreous VEGF levels and daily enalapril treatment.[44] At least partially, lisinopril and prednisone antiproteinuric effects in rats with adriamycin nephropathy were achieved by restoring VEGF protein and nephrin phosphorylation.[45] These effects of ACE inhibition on nephrin and VEGF could be attributed to its known mode of action on Ang II. In particular, the latter increases in the case of diabetes,[4] modulates nephrin expression[46] and enhances VEGF expression.[11]
Valsartan treatment, in our investigation, significantly increased nephrin gene expression by 6-fold compared to normal, as well as its renal protein concentration. Valsartan also relatively improved nephrin immunostaining. Cooper et al.[47] have also shown that an Ang II receptor blocker protected against glomerular nephrin expression depletion in diabetic kidneys. Similarly, valsartan abolished glomerular nephrin expression depletion in diabetic animals and was more effective at delaying albuminuria development than a calcium channel blocker, verapamil.[48]
Moreover, valsartan significantly decreased VEGF-A gene expression by 6-fold compared to untreated diabetic-hypertensive rats. In accordance, Rizkalla et al.[49] demonstrated that an infusion of angiotensin II in experimental rats caused a significant increase in VEGF mRNA levels and VEGF-R2 gene expression. This VEGF mRNA increase was ameliorated by valsartan treatment, and significant downregulation of VEGF-R2 gene expression was also recorded, even lower than that in the control. Remarkably, Rizkalla et al.[49] investigated an AT2 receptor antagonist, which also improved angiotensin II-associated increases in VEGF gene and protein expression.
Our findings indicate that both nephrin and VEGF-A expressions are more effectively controlled with valsartan than with lisinopril. This could be explained by the results of Rizkalla et al.[49] which showed that downregulation of angiotensin II-associated increase in VEGF expression could be mediated through both angiotensin receptors I and II, which makes it irrelevant to the blood pressure-lowering effect of valsartan as an AT1 receptor blocker. This highlights the advantage of ARBs over ACE-Is. It has been documented that with angiotensin AT1 receptor blockers, the local angiotensin II concentration increases, stimulating unblocked AT2 receptors. Another explanation could be based on bradykinin, as it could stimulate VEGF production and contribute to angiogenesis stimulation.[50,51] Consequently, with lisinopril, bradykinin will not be deactivated by ACE;[13] therefore, VEGF production would be stimulated, leading to more kidney damage.
Meanwhile, although this study continued for only 21 days, it is worth mentioning that with long-term ACE inhibition, non-ACE pathways of angiotensin I metabolism, such as myocardial chymase, could cause the ‘angiotensin escape phenomenon’. Hence, Ang II levels return to normal.[52] This would provide the rationale for the dual blockade of RAS.
In the present study, coadministration of lisinopril and valsartan increased renal nephrin gene expression to normal control levels (even 3-fold higher); however, nephrin protein was significantly higher than normal levels, which was reflected in nephrin immunostaining with obvious strength compared to untreated and single treated diabetic-hypertensive. Zoja et al.[53] showed that STZ-induced diabetic rats showed a significant decrease in nephrin expression compared to control rats. However, nephrin staining was significantly increased after the administration of either combined lisinopril and candesartan or rosuvastatin alone for 8 months. Moreover, both ACEIs and ARBs controlled the decrease in the number of podocyte slit pores per unit length of the glomerular basement membrane accompanying experimental STZ-induced diabetes. These findings suggest that the renoprotective effects of blocking the RAS may involve podocyte number and structure preservation and its molecular composition, especially since nephrin is a crucial member of this structure‒function relationship.[54] The difference between nephrin protein content (higher) and its mRNA content (normal level) in the combined treatment group suggested that they might be regulated differently. This could be attributed to the effect of the dual blockade of RAS using two different mechanisms. Since the combined treatment could maintain nephrin gene expression at a normal level, however, it could additionally physiologically and mechanically protect against the direct inhibition of nephrin expression by Ang II[8,55] as well as the damage caused by the enhanced intraglomerular capillary pressure that stretches the glomerular walls, causing mechanical strain, which consequently increases angiotensin II (Ang II) production and the expression of angiotensin type 1 receptors in podocytes.[56,57] Eventually, this could slow nephrin protein damage and loss.
On the other hand, combined treatment significantly decreased VEGF-A expression (6-fold) compared to untreated diabetic-hypertensive rats, similar to valsartan monotherapy; this was also within the normal control level. Very little, if any, literature was found to show the effect of a similar dual blockade on VEGF gene expression. Araújo et al[58] showed that in mice with renal cell carcinoma, RAS blockade using captopril, an ACE-I, and/or an ARB, losartan, for 21 days significantly reduced VEGF expression in renal tumours of treated animals compared to the control.
Thus, our data show that early dual blockade of RAS using ACEIs and ARBs protected renal tissue, which could be mediated through the attenuation of decreased renal nephrin gene expression and protein and increased renal VEGF-A expression in diabetic-hypertensive rats.
In recent years, research concerning podocyte protein expression has become more popular, where crosstalk between VEGF and nephrin signalling is suggested;[28,59] however, further investigations are still needed. Moreover, the success of the diabetic hypertensive model necessitates further research to prove its applicability.
CONCLUSION
The study concluded that an early blockade of RAS with lisinopril and valsartan, whether alone or in combination, protected the kidney from deterioration in diabetic-hypertensive rats. Nephrin and VEGF-A gene expression were improved and reflected in renal nephrin protein levels, histopathological examination and nephrin immunostaining.
Declaration of patient consent
Patient’s consent not required as there are no patients in this study.
Financial support and sponsorship
Partial support by the National Research Centre-Egypt.
Conflicts of interest
There are no conflicts of interest.
References
- Complications of diabetes 2017. J Diabetes Res. 2018;2018:3086167.
- [CrossRef] [PubMed] [Google Scholar]
- Role of immunocompetent cells in nonimmune renal diseases. Kidney Int. 2001;59:1626-40.
- [CrossRef] [PubMed] [Google Scholar]
- Have we reached the limits for the treatment of diabetic nephropathy? Expert Opin Investig Drugs. 2014;23:511-22.
- [CrossRef] [PubMed] [Google Scholar]
- Renin-angiotensin system activation and interstitial inflammation in human diabetic nephropathy. Kidney Int Suppl. 2003;86:S64-70.
- [CrossRef] [PubMed] [Google Scholar]
- Activation of the renin-angiotensin system within podocytes in diabetes. Kidney Int. 2007;71:1019-27.
- [CrossRef] [PubMed] [Google Scholar]
- Podocyte biology in diabetic nephropathy. Kidney Int Suppl. 2007;106:S36-42.
- [CrossRef] [PubMed] [Google Scholar]
- Angiotensin II receptor blocker inhibits p27Kip1 expression in glucose-stimulated podocytes and in diabetic glomeruli. Kidney Int. 2005;67:944-52.
- [CrossRef] [PubMed] [Google Scholar]
- Nephrin expression is reduced in human diabetic nephropathy: Evidence for a distinct role for glycated albumin and angiotensin II. Diabetes. 2003;52:1023-30.
- [CrossRef] [PubMed] [Google Scholar]
- Dysregulated nephrin in diabetic nephropathy of Type 2 diabetes: A cross sectional study. PLoS One. 2012;7:e36041.
- [CrossRef] [PubMed] [Google Scholar]
- Hypoxia in Obesity and diabetes: Potential therapeutic effects of hyperoxia and nitrate. Oxid Med Cell Longev. 2017;2017:5350267.
- [CrossRef] [PubMed] [Google Scholar]
- The pathogenesis of diabetic nephropathy. Nat Clin Pract Endocrinol Metab. 2008;4:444-52.
- [CrossRef] [PubMed] [Google Scholar]
- Expression of VEGF in kidney of diabetic rats. Sichuan Da Xue Xue Bao Yi Xue Ban. 2007;38:633-6.
- [Google Scholar]
- Kinins are involved in the antiproteinuric effect of angiotensin-converting enzyme inhibition in experimental diabetic nephropathy. Int Immunopharmacol. 2003;3:335-44.
- [CrossRef] [Google Scholar]
- Drugs targeting the renin-angiotensin-aldosterone system. Nat Rev Drug Discov. 2002;1:621-36.
- [CrossRef] [PubMed] [Google Scholar]
- Angiotensin II antagonism in clinical practice: Experience with valsartan. J Cardiovasc Pharmacol. 1999;33(Suppl 1):S29-32.
- [CrossRef] [PubMed] [Google Scholar]
- Evidence that an angiotensin-converting enzyme inhibitor has a different effect on glomerular injury according to the different phase of the disease at which the treatment is started. J Am Soc Nephrol. 1994;5:1139-46.
- [CrossRef] [PubMed] [Google Scholar]
- Effects of ACE inhibitors and angiotensin receptor blockers in normotensive patients with diabetic kidney disease. Horm Metab Res. 2020;52:289-97.
- [CrossRef] [PubMed] [Google Scholar]
- Executive summary of the KDIGO 2021 clinical practice guideline for the management of blood pressure in chronic kidney disease. Kidney Int. 2021;99:559-69.
- [CrossRef] [PubMed] [Google Scholar]
- Effect of chronic treatment with losartan on streptozotocin induced diabetic nephropathy. Clin Exp Hypertens. 2001;23:513-20.
- [CrossRef] [PubMed] [Google Scholar]
- Sustained hypertension in the rat induced by chronic blockade of nitric oxide production. Am J Hypertens. 1992;5:919-22.
- [CrossRef] [PubMed] [Google Scholar]
- Intraperitoneal administration of telomerase-specific oncolytic adenovirus sensitizes ovarian cancer cells to cisplatin and affects survival in a xenograft model with peritoneal dissemination. Cancer Gene Ther. 2010;17:11-9.
- [CrossRef] [PubMed] [Google Scholar]
- The association between Internet addiction and psychiatric disorder: A review of the literature. Eur Psychiatry. 2012;27:1-8.
- [CrossRef] [PubMed] [Google Scholar]
- Nephrin loss is reduced by grape seed proanthocyanidins in the experimental diabetic nephropathy rat model. Mol Med Rep. 2017;16:9393-400.
- [CrossRef] [PubMed] [Google Scholar]
- Analysis of relative gene expression data using real-time quantitative PCR and the 2(-Delta Delta C(T)) Method. Methods. 2001;25:402-8.
- [CrossRef] [PubMed] [Google Scholar]
- The ameliorative effect of pectin-insulin patch on renal injury in streptozotocin-induced diabetic rats In: Kidney Blood Press Res. Vol 42. 2017. p. :530-40.
- [CrossRef] [PubMed] [Google Scholar]
- Changes in the expression of nephrin gene and protein in experimental diabetic nephropathy. Lab Invest. 2001;81:1185-90.
- [CrossRef] [PubMed] [Google Scholar]
- Increased vascular endothelial growth factor serum concentrations may help to identify patients with onset of Type 1 diabetes during childhood at risk for developing persistent microalbuminuria. J Clin Endocrinol Metab. 2001;86:3871-6.
- [CrossRef] [PubMed] [Google Scholar]
- Effect of simvastatin on the expression of nephrin, podocin, and vascular endothelial growth factor (VEGF) in podocytes of diabetic rat. Int J Clin Exp Med. 2015;8:18225-34.
- [Google Scholar]
- Vascular endothelial growth factors and vascular permeability. Cardiovasc Res. 2010;87:262-71.
- [CrossRef] [PubMed] [Google Scholar]
- VEGF and podocytes in diabetic nephropathy. Semin Nephrol. 2012;32:385-93.
- [CrossRef] [PubMed] [Google Scholar]
- Reduction of VEGF-A and CTGF expression in diabetic nephropathy is associated with podocyte loss. Kidney Int. 2007;71:637-45.
- [CrossRef] [PubMed] [Google Scholar]
- Role of vascular endothelial growth factor in diabetic nephropathy. Kidney Int Suppl. 2000;77:S104-12.
- [CrossRef] [PubMed] [Google Scholar]
- Endothelin contributes to basal vascular tone and endothelial dysfunction in human obesity and Type 2 diabetes. Diabetes. 2002;51:3517-23.
- [CrossRef] [PubMed] [Google Scholar]
- Angiotensin II stimulates the synthesis and secretion of vascular permeability factor/vascular endothelial growth factor in human mesangial cells. J Am Soc Nephrol. 1999;10:245-55.
- [CrossRef] [PubMed] [Google Scholar]
- Blockade of angiotensin converting enzyme but not of angiotensin AT1 receptors improves glucose tolerance. Eur J Pharmacol. 1997;319:77-83.
- [CrossRef] [Google Scholar]
- Selective angiotensin II receptor antagonism reduces insulin resistance in obese Zucker rats. Hypertension. 2001;38:884-90.
- [CrossRef] [PubMed] [Google Scholar]
- Role of abnormally high transmural pressure in the permselectivity defect of glomerular capillary wall: A study in early passive Heymann nephritis. Circ Res. 1987;61:531-8.
- [CrossRef] [PubMed] [Google Scholar]
- Pathophysiology of progressive nephropathies. N Engl J Med. 1998;339:1448-56.
- [CrossRef] [PubMed] [Google Scholar]
- Proinflammatory actions of angiotensins. Curr Opin Nephrol Hypertens. 2001;10:321-9.
- [CrossRef] [PubMed] [Google Scholar]
- ACE inhibitors improve nephrin expression in Zucker rats with glomerulosclerosis. Kidney Int Suppl. 2005;93:S10-4.
- [CrossRef] [PubMed] [Google Scholar]
- Expression of the slit-diaphragm protein, nephrin, in experimental diabetic nephropathy: Differing effects of anti-proteinuric therapies. Nephrol Dial Transplant. 2002;17:1327-32.
- [CrossRef] [PubMed] [Google Scholar]
- Possible role of VEGF in the progression of kidney disease in streptozotocin (STZ)-induced diabetic rats: Effects of an ACE inhibitor and an angiotensin II receptor antagonist. Horm Metab Res. 2004;36:458-64.
- [CrossRef] [PubMed] [Google Scholar]
- Angiotensin converting enzyme inhibition reduces retinal overexpression of vascular endothelial growth factor and hyperpermeability in experimental diabetes. Diabetologia. 2000;43:1360-7.
- [CrossRef] [PubMed] [Google Scholar]
- Angiotensin converting enzyme inhibiting therapy is associated with lower vitreous vascular endothelial growth factor concentrations in patients with proliferative diabetic retinopathy. Diabetologia. 2002;45:203-9.
- [CrossRef] [PubMed] [Google Scholar]
- Reduction in VEGF protein and phosphorylated nephrin associated with proteinuria in Adriamycin nephropathy rats. Nephron Exp Nephrol. 2009;111:e92-102.
- [CrossRef] [PubMed] [Google Scholar]
- Role of nephrin in renal disease including diabetic nephropathy. Semin Nephrol. 2002;22:393-8.
- [CrossRef] [PubMed] [Google Scholar]
- Disparate effects of angiotensin II antagonists and calcium channel blockers on albuminuria in experimental diabetes and hypertension: Potential role of nephrin. J Hypertens. 2003;21:209-16.
- [CrossRef] [PubMed] [Google Scholar]
- Increased renal vascular endothelial growth factor and angiopoietins by angiotensin II infusion is mediated by both AT1 and AT2 receptors. J Am Soc Nephrol. 2003;14:3061-71.
- [CrossRef] [PubMed] [Google Scholar]
- Angiotensin II modulates VEGF-driven angiogenesis by opposing effects of Type 1 and Type 2 receptor stimulation in the microvascular endothelium. Cell Signal. 2012;24:1261-9.
- [CrossRef] [PubMed] [Google Scholar]
- Bradykinin promotes vascular endothelial growth factor expression and increases angiogenesis in human prostate cancer cells. Biochem Pharmacol. 2014;87:243-53.
- [CrossRef] [PubMed] [Google Scholar]
- Antioxidants and myocardial contractility: Illuminating the “Dark Side” of beta-adrenergic receptor activation? Circulation. 2001;103:782-3.
- [CrossRef] [PubMed] [Google Scholar]
- Adding a statin to a combination of ACE inhibitor and ARB normalizes proteinuria in experimental diabetes, which translates into full renoprotection. Am J Physiol Renal Physiol. 2010;299:F1203-11.
- [CrossRef] [PubMed] [Google Scholar]
- Podocyte foot process broadening in experimental diabetic nephropathy: Amelioration with reninangiotensin blockade. Diabetologia. 2001;44:878-82.
- [CrossRef] [PubMed] [Google Scholar]
- Changes in glomerular perm-selectivity induced by angiotensin II imply podocyte dysfunction and slit diaphragm protein rearrangement. Semin Nephrol. 2004;24:131-40.
- [CrossRef] [PubMed] [Google Scholar]
- Activation of a local tissue angiotensin system in podocytes by mechanical strain. Kidney Int. 2004;65:30-9.
- [CrossRef] [PubMed] [Google Scholar]
- Angiotensin II contributes to diabetic renal dysfunction in rodents and humans via Notch1/Snail pathway. Am J Pathol. 2013;183:119-30.
- [CrossRef] [PubMed] [Google Scholar]
- Renin-angiotensin system (RAS) blockade attenuates growth and metastatic potential of renal cell carcinoma in mice. Urol Oncol. 2015;33:7.e1-7.
- [CrossRef] [PubMed] [Google Scholar]
- Vascular endothelial growth factor and nephrin interact and reduce apoptosis in human podocytes. Am J Physiol Renal Physiol. 2005;288:F48-57.
- [CrossRef] [PubMed] [Google Scholar]


