
Translate this page into:
To assess the prevalence of clinical and subclinical cardiac autonomic dysfunction in adolescent with family history of hypertension and adolescent with prehypertension; correlating with adolescent anthropometric parameters

*Corresponding author: Shantala Shripad Herlekar, Assistant Professor, Department of Physiology, JNMC, Belagavi, Karnataka, India. shantala.herlekar@gmail.com
-
Received: ,
Accepted: ,
How to cite this article: Herlekar SS, Kapparrad D. To assess the prevalence of clinical and subclinical cardiac autonomic dysfunction in adolescent with family history of hypertension and adolescent with prehypertension; correlating with adolescent anthropometric parameters. Indian J Physiol Pharmacol 2022;66:131-8.
Abstract
Objectives:
Hypertension (HTN) is an inherited disorder and these patients manifest with cardiac autonomic dysfunction (CAD). The present study intends to assess the presence of pre HTN, clinical and subclinical CAD in adolescents with a family history of HTN, and to obtain its correlation with anthropometric values.
Materials and Methods:
After obtaining ethical clearance and informed consent, three groups containing 50 subjects each, of age 17–19 years were included in the study. (Group-I: Normotensives without a family history of HTN; Group-II: Normotensives with a family history of HTN and Group-III: prehypertensives). CAD was done by performing (1) resting tachycardia, (2) loss of sinus arrhythmia, and (3) heart rate response to the Valsalva manoeuvre. If any two of them are positive then the presence of CAD was confirmed.
Results:
Height, weight, BMI, SBP and DBP was significantly higher in group 3 (prehypertensives). Confirmed CAD findings was seen in 36% of group 2 and 46% of group 3 participants. Of the anthropometric parameters, a significant positive correlation was seen between weight and SBP, DBP and CAD parameters, and height with SBP and DBP.
Conclusion:
Clinical and subclinical CAD exists in adolescents with risk factors for HTN including heredity, obesity, and pre-HTN values. These risk factors show multiplicative effects for disease genesis and indicate high sympathetic and low parasympathetic drives. Extra care should be taken to curb the onset of clinical HTN and CAD in these young adults. Additional work needs to be done on pathophysiological mechanisms for the same.
Keywords
Hereditary
Prehypertension
Adolescents
Cardiac autonomic dysfunction
Anthropometry

INTRODUCTION
Hypertension (HTN) and its complications lead to 9.4 million worldwide deaths each year. It is responsible for heart diseases (CHD and CHF) related 45% of deaths, stroke-related 51% of deaths, and doubles the risk of end-stage renal disease and peripheral artery disease.[1,2] In an estimate put up for the year 2025, up to 1.56 billion adults worldwide will be due to hypertension.[3] In India, the situation is more frightening. In 1990, 9.4 million deaths were reported in India of which 2.3 million deaths (25%) were due to HTN-related cardiovascular mortality. 1.2 million deaths were due to coronary artery disease and 0.5 million were due to stroke.[4]
HTN has a strong heritable factor confirmed by Adoption, twin births, and family-related studies.[2] These studies indicate both genetic and environmental factors determine susceptibility to HTN. HTN before the age of 55 has a 30–60% heritability component, with multiple genes contributing and a high frequency of 3.8 times among patients with a positive family history.[5] Multiple genes contribute in minor forms adding up to play a major role in disease genesis. This, along with environmental stimuli, contributes to elevated blood pressure. There is a definite indication for an involvement of various enzymes, channels, and receptors that handle sodium for blood pressure regulation, genes involved with the reninangiotensin-aldosterone system, and salt-water homeostasis, proteins involved in mineralocorticoid and glucocorticoid functional pathways, and transcription of genes involved in the regulation of vascular tone (endothelins and their receptors). Genes have been focused on at least 20 chromosome regions.[6]
The autonomic nervous system is an integral part of regulating internal organ functioning. Together with endocrine and immunological systems, it controls the internal environment of the organism and makes necessary adjustments to its current needs, thus enabling homeostasis. Various baroreflex mechanisms maintain blood pressure through varied effects on the heart, blood vessels, renal sodium, and water excretion. Animals and human studies ensure the critical role of the autonomic nervous system and its dysfunction in the development of HTN.[7,8] Several studies have publicised impaired cardiac autonomic function (CAF) in hypertensive subjects.[9,10] Greater sympathetic activity and parasympathetic attenuation have been noted in normotensive subjects with a family history of HTN.[6,11]
Obesity and increased body mass index (BMI) are risk factors for elevated systolic and diastolic blood pressure (SBP and DBP). There is increasing evidence that BMI and other anthropometric measurements maybe even related to long-term survival.[12,13] Endothelial dysfunction, arterial stiffness, and RAAS dysregulation are a few of the many pathological processes involved.[14,15] The lacunae in the literature remain on whether anthropometry, pre-HTN, and family history occur as independent or additive aetiologies in the occurrence of clinical and subclinical cardiac autonomic dysfunction (CAD). Also in which of these factors occurrence of CAD is higher.
Aims and objectives
The objectives are as follows:
To assess CAD in adolescents without a family history of HTN
To assess CAD in adolescents with a family history of HTN
To assess CAD in adolescent prehypertensives
To determine the correlation of the CAF test with anthropometric parameters.
MATERIALS AND METHODS
A cross-sectional study was conducted in the Department of Physiology of our Medical College after obtaining institutional ethical clearance. A complete personal and family history was taken focusing on the parental history of HTN, smoking, and physical activity. All the participants were explained about the procedure and written consent was obtained. The participants were then divided into 3 groups.
Group 1: Normotensive offspring’s without a family history of HTN
Group 2: Normotensive adolescents with positive family history of HTN
Group 3: Pre-hypertensives.
Inclusion criteria
Subjects in the age group of 17–19 years were included in the study. Normotensive values were SBP < 120 mm of Hg and DBP < 80 mm of Hg, the pre-hypertensive value was SBP in the range of 120–139 mm of Hg or DBP in the range of 80–89 mm of Hg were included in the study. Subjects with the absence of HTN in parents and first-degree relatives were included in Group 1. Subjects with either one or both parents being hypertensive were included in Group 2 (SBP ≥ 140 mm of Hg and DBP ≥ 90 mm of Hg).
Exclusion criteria
Subjects with a history of smoking, currently using steroid hormone medications and/or recreational drugs, history of DM, cardiovascular diseases, thyroid abnormality, giddiness on standing, syncopal spells, asthma, and chest disease; receiving drugs that are known to interfere with cardiovascular autonomic functions, alcohol intake and/or tobacco consumption in any form and family H/O DM were excluded from the study.
Sample size
Based on effect size by pilot study, keeping ά = 0.05, Z ά = 1.65, β = 0.2, Power 80%, Z β = 0.84, n = ([Z ά + Z β] σ/d)2 = 24.8 = 25 ≈ 30. 50 subjects in each group in the age group of 17–19 years were included in the study, selected randomly from the general population based on willingness to participate in the study.
Institutional ethical clearance
Institutional Ethical clearance was obtained.
Consent form
A well-informed written consent was taken from all subjects after explaining the procedure and merits of the study.
Study design
Participants who fulfilled our inclusion and exclusion criteria were included in the study. These participants were either those accompanying relatives to our hospital or a few students from our college representing the general population. Subjects were instructed not to have coffee, tea, or cola 12 h before the test. They were asked to come to the physiology laboratory at 9 am after having a light breakfast. Sociodemographic details were taken on a standard pro forma.
Anthropometric measurements
Height in mts
By commercial metallic wall fixed stadiometers. Stadiometers are devices specifically designed for the accurate measurement of height and when used with care yield data of the highest quality. The instrument was validated with metal rods of known height. Heavy outer clothing, footwear, and hair accessories that interfered with measurements were removed. Shoulders and buttocks touched the stadiometer and the head was in “Frankfort plane.” The participant was asked to look straight three measurements were made which were not different from one another by more than 2 mm.[16]
Weight in kgs
Weight (in kgs) was measured using digital weighing scale (seca) with an accuracy of ± 100g. The instrument was calibrated to zero and then a weight of 25 kg, 50 kg, and 100 kg was placed on it to standardise. It was then placed on a hard surface away from walls and tables. Participants were asked to remove heavy clothing, belts, and shoes and empty their pockets. They were made to stand in the middle of the scale with feet slightly apart and arms relaxed by the side.[17]
BMI
Weight (kg)/height (mts)2.[18]
ECG recording
A standard 12 lead ECG was taken using 4 limb leads and a single chest lead for recording lead II (Bpl, cardiart 6208 view. Bpl limited, bannerghatta road, Bangalore). Paper speed was 25 mm/sec. After informed consent, patient was freed from all clothing impending placement of chest electrodes and limb leads. Patient was put in supine position and skin was prepared for placing electrodes. Gel was used and leads were positioned according to standardised protocol and a long lead II was obtained. Patient was then given wipes to clean the gel and asked to replace clothing.[19]
CAD
The presence or absence of CAD was done by performing following three different tests on each subject. Of the three tests, If two are positive (abnormal), then presence of CAD was confirmed.[20,21]
Resting tachycardia
Loss of sinus arrhythmia
Heart rate response to Valsalva manoeuvre.
Procedure
Resting pulse rate
The subjects were asked to relax in a supine position for 30 min. Resting heart rate was calculated using standard ECG from lead II for the evaluation of resting tachycardia under basal conditions. The value of more than 100 beats per minute (b/m) was considered abnormal.[21]
Loss of sinus arrhythmia
Heart rate variation with respiration was observed for loss of sinus arrhythmia. In a sitting position, patients were asked to take 6 deep breaths per minute (with 5 s of inhalation and 5 s of exhalation per breath). A continuous ECG was recorded, with a marker to indicate the onset of each inspiration and expiration. Maximum and minimum R-R intervals were measured during each breathing cycle and converted into beats per minute. The result was then expressed as the mean of the difference between the maximum and minimum heart rate for six measured cycles in beats per minute. The normal response is a difference of 18 b/m or more, while 10–18 beats and <10 b/m will be taken as borderline and definitive CAD, respectively. The expiratoryinspiratory ratio (E: I ratio), which is the ratio of the longest RR interval during expiration and the shortest RR interval during inspiration from 5 cycles, was also determined. The E: I ratio in young persons should be higher than 1.24.[20-22]
Heart rate response to Valsalva manoeuvre
Valsalva manoeuvre was performed in a sitting position. Subjects were asked to blow into a mouthpiece connected to a mercury manometer and hold it at a pressure of 40 mmHg for 15 s, simultaneously monitored by the ECG. The ECG was continued to be recorded for 15 s after the release of pressure. The induced heart rate changes were expressed as the Valsalva ratio, that is, the ratio of maximum tachycardia (shortest R-R interval) during the manoeuvre to the maximum bradycardia (longest R-R interval) after the manoeuvre. The normal Valsalva ratio is 1.45 or more; values 1.21–1.45 is considered borderline and less or equal to 1.21 was taken as evidence of CAD.[20-22]
Based on diagnostic testing, CAD can be classified into three categories: (1) “early involvement” with one abnormal HR test or two borderline results; (2) “definite involvement” with two or more abnormal results; and (3) “severe involvement” when orthostatic hypotension is present. CAD is also divided into two stages: subclinical and clinical. The classification of subclinical CAD is based on changes in HR variability, baroreflex sensitivity and cardiac imaging showing increased torsion of the left ventricle without any significant changes on standard CARTs discussed above. The clinical stage is diagnosed when sympathetic activity is predominant and symptoms such as decreased exercise tolerance and resting state tachycardia are evident. As clinical CAD progresses, orthostatic hypotension becomes apparent. The standard CARTs may be used to obtain an autonomic dysfunction score to assess the severity of CAD and monitor its progression. Our study includes criteria’s which will include the participant’s as “definitive involvement” and in “clinical stage” as we have included resting tachycardia.[21]
Statistical analysis
Statistical analysis was performed using SPSS software version 20. Inter and intra group analyses of variables were done by ANOVA and Tukey’s post hoc analysis. Pearson’s correlation was used to test the association of cardiac autonomic parameters with anthropometric parameters. Values are expressed as mean ± standard deviation. P < 0.05 was considered as statistically significant.
RESULTS
In the present study, a total 150 subjects were included in the age group of 17–19 years. They were divided into three groups and were investigated for anthropometric parameters and CAFs. The gender difference and mean of age in years in all three groups are listed in [Table 1]. ANOVA showed no statistical difference in age of the subjects.
| Groups | Female subjects | Male subjects | Age in years |
|---|---|---|---|
| Group 1* | 41 | 9 | 18.58±0.75 |
| Group 2** | 35 | 15 | 18.86±1.00 |
| Group 3*** | 15 | 35 | 18.30±0.89 |
Family history
[Table 1] shows gender distribution among all three groups and the average age in years of all participants. Group 1 had no family history of HTN. In Group 2, 64% of subjects had one parent having HTN, 36% having both parents as hypertensive. In Group 3, 58% of subjects had one parent having HTN, 30% had both parent’s being hypertensive and 12% had no family history of HTN.
[Table 2] shows one-way ANOVA and Tukeys post hoc test, analysis between all three groups. Weight and height of subjects in pre-hypertensive group (Group 3) were significantly high compared to Groups 1 and 2. BMI showed no statistical difference between all 3 groups. For SBP and DBP, Groups 1 and 2 were normotensive subjects while for Group 3 it was pre-HTN. SBP and DBP were significantly higher in Group 3 compared to Groups 1 and 2 [Graph 1].
| Parameter | Group | Value | Group | Value | P value |
|---|---|---|---|---|---|
| Height (mts) | Group 1* | 1.61±0.09 | Group 3*** | 1.68±0.09 | 0.001# |
| Group 2** | 1.62±0.09 | Group 3 | 1.68±0.09 | 0.005# | |
| Weight (kgs) | Group 1 | 58.53±12.35 | Group 3 | 66.52±13.76 | 0.007# |
| BMI | No significant difference between groups | ||||
| BP in mm of Hg (mean±SD) | Group 1: SBP | 114.7±5.32, | Group 3: SBP | 132.2±5.23, | <0.001# |
| DBP | 73.02±5.70 | DBP | 83±3.77 | <0.001# | |
| Group 2: SBP | 115.1±3.84, | Group 3: SBP | 132.2±5.23, | <0.001# | |
| DBP | 73.44±5.47 | DBP | 83±3.77 | <0.001# | |
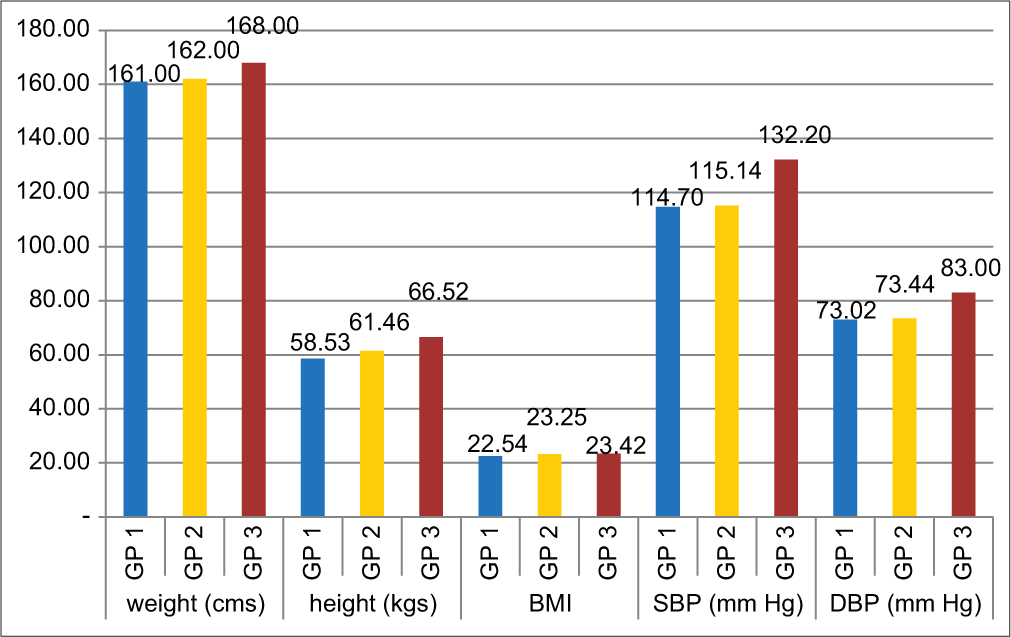
- Showing means of height, weight, BMI, Systolic BP and Diastolic BP in all 3 groups. (Group 1 had no family history of hypertension. In Group 2, 64% of subjects had 1 parent having hypertension, 36% having both parents as hypertensive. In Group 3, 58% of subjects had 1 parent having hypertension, 30% had both parent’s hypertensive and 12% had no family history of hypertension).
Results for CAF test
Following criteria’s were followed to differentiate normal, borderline and abnormal values in CAF analysis as mentioned in [Table 3].
| Resting Pulse rate (R. PR) | Normal (N) | <100 beats/min |
| Abnormal (AbN) | >100 beats/min | |
| Sinus arrhythmia difference (SA. Diff) | Normal (N) | >18 beats/min |
| Borderline (Brl) | 18–10 beats/min | |
| Abnormal (AbN) | <10 beats/min | |
| Sinus arrhythmia Ratio | Normal (N) | >1.23 |
| (SA. R) | Abnormal (AbN) | <1.23 |
| Valsalva Ratio | Normal (N) | >1.45 |
| (Val. R) | Borderline (Brl) | 1.45–1.21 |
| Abnormal (AbN) | <1.21 |
In the above table, brackets provide abbreviations which will be used to determine values in those categories. (E.g.: R. PR followed by N means normal value in Resting Pulse Rate). In all three groups with 50 students in each group, the total number of subjects who had borderline or abnormal findings in the said tests are follows in Table 4.
From the observations made in [Table 4 and Graph 2], it was seen that
| Groups | Number of subjects | R. PR^ | SA. Diff^^ | SA. R^^^ | Val. R^^^^ | ||||||
|---|---|---|---|---|---|---|---|---|---|---|---|
| N | AbN | N | Brl | AbN | N | AbN | N | Brl | AbN | ||
| 50 | 0 | 50 | 0 | 0 | 50 | 0 | 31 | 19 | 0 | ||
| Group 2** | 50 | 19 | 31 | 40 | 8 | 2 | 38 | 12 | 15 | 15 | 3 |
| Group 3*** | 50 | 22 | 28 | 27 | 18 | 5 | 23 | 27 | 22 | 26 | 2 |
#N: Normal, Brl: Borderline, Abn: Abnormal. *Group 1: Normotensive offspring’s without family history of HTN, **Group 2: Normotensive adolescents with positive family history of HTN, ***Group 3: Prehypertensives. ^Resting Pulse rate (R. PR); ^^Sinus arrhythmia difference (SA. Diff); ^^^Sinus arrhythmia Ratio (SA. R); ^^^^Valsalva Ratio (Val. R)
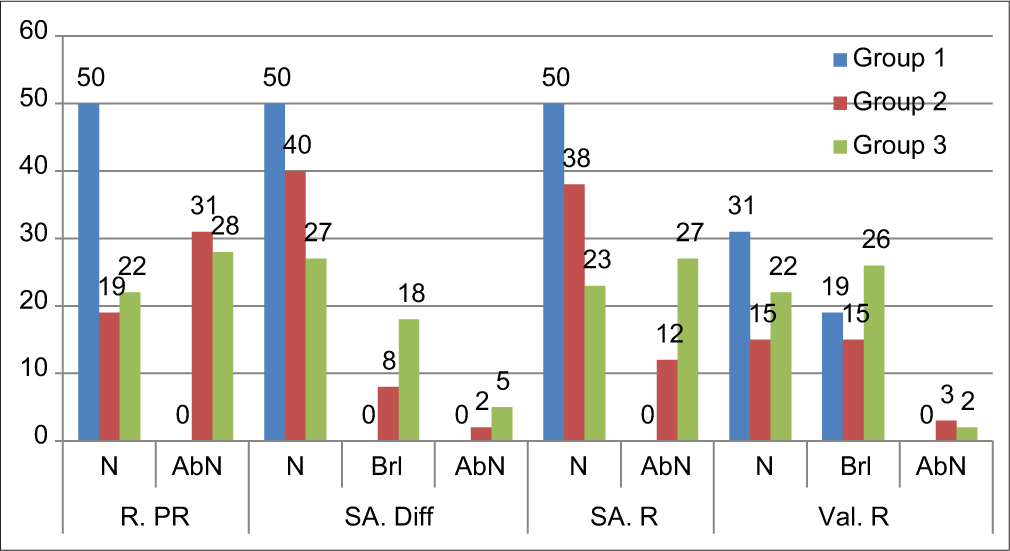
- In all three groups with 50 students in each group, the total number of subjects who had borderline or abnormal findings in the said tests R. PR: Resting pulse rate (to record resting tachycardia) in beats per minute. SA. Diff: Sinus Arrhythmia Difference (difference between maximum and minimum heart rate for six measured cycles) in beats per minute. SA. R: Sinus Arrhythmia Ratio (The expiratory-inspiratory ratio (E: I ratio), which is the ratio of the longest RR interval during expiration and the shortest RR interval during inspiration from 5 cycles). Val. R: Valsalva Ratio (ratio of maximum tachycardia (shortest R-R interval) during the manoeuvre to the maximum bradycardia (longest R-R interval) after the manoeuvre).
Resting pulse rate: All the subjects in Group 1 were within normal range, that is, PR <100 beats/min. while in Group 2 and Group 3, number of subjects with resting tachycardia was 31 and 28, respectively.
Sinus arrhythmia: The number of subjects in borderline SA. Diff and abnormal findings in Group 2 were 8 and 2 while in Group 3 were 18 and 5, respectively. Also SA. R was higher in Group 2 = 12 and in Group 3 = 27.
Valsalva ratio: There were 19 subjects in Group 1 who showed borderline scores in Val. R. The number of subjects with borderline or abnormal findings was higher in Group 2 (15, 3) and Group 3 (26, 2).
As described in the materials and methods section, subjects with 2 or more values being abnormal are diagnosed as CAN[13] with these criteria following are noted in [Table 5].
| No. of students | 1 test abnormal | 2 tests abnormal | All 3 tests abnormal | Diagnosed as CAN |
|---|---|---|---|---|
| Group 1* | 19 | 0 | 0 | 0 |
| Group 2** | 15 | 15 | 3 | 15+3 = 18 |
| Group 3*** | 18 | 14 | 9 | 14+9 = 23 |
Thus a total of 18 subjects in Group 2 had CAD and a total of 23 subjects in Group 3 had CAN. In other words, out of 50 subjects in each group, 0% in Group 1, 36% of subjects in Group 2 and 46% of subjects in Group 3 had confirmed CAD findings.[21]
Results for correlations between anthropometric parameters and CAFs
For the evaluation of our 4th objective, Pearson’s correlation was used for all the 150 subjects and the following findings are obtained in [Table 6].
| Correlations | ||||||
|---|---|---|---|---|---|---|
| SBP | DBP | R.PR | SA.Diff | SA. R | Val. R | |
| Weight | ||||||
| Pearson Correlation | 0.275 | 0.214 | 0.163 | −0.173 | −0.139 | −0.069 |
| P value | 0.001* | 0.009* | 0.047* | 0.034* | 0.090 | 0.399 |
| Height | ||||||
| Pearson Correlation | 0.276** | 0.188* | 0.098 | −0.071 | −0.017 | 0.043 |
| P value | 0.001 | 0.022 | 0.232 | 0.388 | 0.839 | 0.605 |
| BMI | ||||||
| Pearson Correlation | 0.148 | 0.087 | 0.009 | 0.045 | 0.088 | 0.116 |
| P value | 0.071 | 0.292 | 0.913 | 0.583 | 0.286 | 0.156 |
Weight: A significant positive correlation was seen between weight, blood pressure and resting pulse rate showing that, increased weight leads to increased incidence of resting tachycardia. While a negative correlation was seen with sinus arrhythmia which was significant (P = 0.034) and with Valsalva ratio but was not significant (r = −0.069; P = 0.399).
Height: A significant positive correlation was seen with blood pressure. A positive correlation with resting pulse rate (r = 0.098) and negative correlation with sinus arrhythmia was noted (r = −0.071 and −0.017), both being non-significant.
BMI: Although a positive correlation was seen with all CAF test, none were statistically significant.
DISCUSSION
Our study sought to find prevalence of early and undiagnosed CAD in adolescent subjects. Furthermore, our study analysed family history of HTN as a factor for the onset of early CAD and the occurrence of CAD in prehypertensive subjects. We also tried to correlate anthropometric parameters such as height, weight and BMI with various CAF tests used. Subjects were divided into three groups, containing 50 subjects in each group. Following observations were made:
Height and weight of prehypertensives were significantly high compared to normotensive subjects with or without family history of HTN [Table 2]. Based on research by Abdulle et al. (2014), the prevalence of elevated BP, especially SBP was significantly high among the Emirati children and adolescents in Abu Dhabi. High BP was strongly related to body weight and even more so with BMI.[23] In our study, height of prehypertensives was also significant higher, which might be constitutional. Hence there was no difference in BMI recorded. This difference might get nullified with a larger sample size. As shown in [Table 2], there was a significant difference in SBP and DBP in prehypertensives compared to normotensives.
We considered three tests, that is, resting heart rate, heart rate variation to deep breathing and valsalva ratio. If any two of them were abnormal CAD was considered to be present.[20,21]
From [Tables 3-5] it is seen that, in Group 1, that is, subjects with normotensive parents, 19 subjects had abnormal Valsalva ratio. But they cannot be diagnosed as CAD as the other autonomic parameters were recorded normal. While, 30% of subjects with positive family history had 2 abnormal CAF and 6% of these subjects had all three tests recorded abnormal. Also in prehypertensives, 28% had 2 tests abnormal and 18% had all 3 CAF tests abnormal. A total of 36% and 48%, respectively, of subjects were diagnosed as having CAN. Our study provides the statistical evidence that an altered CAF is present in subjects with positive family history of HTN and pre HTN.
The previous study has shown that parasympathetic drive impairment exists in subjects with positive family history of HTN, while sympathetic control with parasympathetic modulation is enhanced in the case of pre-HTN.[11] The study explains that, decreased parasympathetic drive with increased sympathetic tone might be related to hemodynamic transition from normotension to pre-HTN.[11] It has been characterised by an elevated cardiac output and normal vascular resistance. This high cardiac output has been associated with both an increased cardiac sympathetic drive and a decreased parasympathetic tone in pharmacological blockade studies.[24]
The next objective of our study was to find any significant correlation between anthropometric parameters and CAF test used. As shown in [Table 6], a strong correlation was seen between height, weight and SBP and DBP. Central fat distribution and genetic predisposition are main players for the genesis of metabolic syndrome: HTN, diabetes and dyslipidemia as indicated by Genetic epidemiology. Overweight is associated with increased coronary blockade risk when accompanied by HTN. Excess fat accumulation causes toxic cellular effects in many tissues including heart.[25]
[Table 6] also showed a significant positive correlation of weight with resting tachycardia and negative correlation with sinus arrhythmia. Height also showed similar results but not statistically significant. The previous research shows increased weight and BMI are associated with high sympathetic and low parasympathetic indices. Hirsch et al. showed that a 10% body weight gain significantly decreased HRV, which was attributable to decreased parasympathetic activity. These findings support the hypothesis that the autonomic nervous system tends to oppose weight change.[26] Masuo et al. have reported that plasma norepinephrine concentrations increase following weight gain in men.[22] The results of many studies consistently reveal higher muscle sympathetic nerve activity in obese compared with non-obese individuals. The mechanism by which weight gain elicits sympathetic neural activation remains unclear. It was hypothesised that the increase in sympathetic nervous system activity associated with weight gain serves the homeostatic role of stimulating thermogenesis to prevent further weight gain. Maintenance of a reduced or elevated body weight is associated with compensatory changes in energy expenditure, which oppose the maintenance of a body weight different from the ideal weight. These compensatory changes may account for the poor long-term efficacy of treatment of obesity.[27] Future studies will be necessary to determine the mechanisms mediating sympathetic neural activation following weight gain.
CONCLUSION
Subclinical CAD, with two abnormal autonomic test results and clinical CAD with resting tachycardia exits in 36% of subjects with first degree hypertensive relatives and 46% of adolescents in with prehypertensive values of SBP and DBP.
A positive family history caused CAD in significant number of participants without signs of pre HTN showing independent influence of genetics on autonomic functions.
Anthropometric parameters like increased weight showed strong positive correlation with elevated SBP, DBP and resting PR and negative correlation with sinus arrhythmia difference, while height correlated positively with elevated SBP and DBP proving that anthropometric measurements independently influence CAD.
Prehypertensive subjects had significantly higher weight, height and strong family history of HTN showing additive effect of all these components on early genesis of pre HTN among adolescent age group.
Early onset clinical and subclinical CAD and pre HTN exists in alarming numbers in young adults. These adolescents have adverse anthropometric parameters and strong family history of HTN. Knowledge of the same, especially in youth is of utmost importance to bring about early and stringent preventive measures.
Abbreviations
Group 1: Subjects with normotensive parents
Group 2: Subjects with hypertensive parents
Group 3: Prehypertensive subjects
Wt: Weight in Kgs
Ht: Height in centimetres
BMI: Body mass index (given by the formula weight in kgs/square of height in meters)
SBP: Systolic blood pressure in mm of Hg
DBP: Diastolic blood pressure in mm of Hg
R. PR: Resting pulse rate (to record resting tachycardia) in beats per minute.
SA. Diff: Sinus Arrhythmia Difference (difference between the maximum and minimum heart rate for six measured cycles) in beats per minute.
SA. R: Sinus Arrhythmia Ratio (The expiratoryinspiratory ratio (E: I ratio), which is the ratio of the longest RR interval during expiration and the shortest RR interval during inspiration from 5 cycles).
Val. R: Valsalva Ratio (ratio of maximum tachycardia (shortest R-R interval) during the manoeuvre to the maximum bradycardia (longest R-R interval) after the manoeuvre.
CAD: Cardiac autonomic dysfunction
CAN: Cardiac autonomic neuropathy
CAF: Cardiac autonomic function test.
Declaration of patient consent
The authors certify that they have obtained all appropriate patient consent.
Financial support and sponsorship
Part of STS-ICMR project Reference ID: 2018-02526.
Conflicts of interest
There are no conflicts of interest.
References
- 2018 ESC/ESH guidelines for the management of arterial hypertension: The task force for the management of arterial hypertension of the European society of cardiology and the European society of hypertension: The task force for the management of arterial hypertension of the European society of cardiology and the European society of hypertension. J Hypertens. 2018;36:1953-2041.
- [CrossRef] [Google Scholar]
- Harrison's Principles of Internal Medicine (18th ed). Ch. 247. New York: McGraw Hill; 2011.
- [Google Scholar]
- Global burden of hypertension: Analysis of worldwide data. Lancet. 2005;365:217-23.
- [CrossRef] [Google Scholar]
- Emerging trends in hypertension epidemiology in India. J Hum Hypertens. 2019;33:575-87.
- [CrossRef] [PubMed] [Google Scholar]
- Hereditary determinants of human hypertension: Strategies in the setting of genetic complexity. Hypertension. 2008;51:1456-64.
- [CrossRef] [PubMed] [Google Scholar]
- Pediatric hypertension: Genetics of hypertension current status. J Med Liban. 2010;58:175-8.
- [Google Scholar]
- Autonomic reflexes In: Binder MD, Hirokawa N, Windhorst U, eds. Encyclopedia of Neuroscience. Berlin, Heidelberg: Springer; 2008.
- [Google Scholar]
- Autonomic dysfunction in essential hypertension: A systematic review. Ann Med Surg (Lond). 2014;3:2-7.
- [CrossRef] [PubMed] [Google Scholar]
- Association of cardiac autonomic function and the development of hypertension: The ARIC study. Am J Hypertens. 1996;9:1147-56.
- [CrossRef] [Google Scholar]
- Reduced heart rate variability and new-onset hypertension: Insights into pathogenesis of hypertension: The Framingham Heart Study. Hypertension. 1998;32:293-7.
- [CrossRef] [PubMed] [Google Scholar]
- Epidemiological study on the effect of pre-hypertension and family history of hypertension on cardiac autonomic function. J Am Coll Cardiol. 2008;51:1896-901.
- [CrossRef] [PubMed] [Google Scholar]
- Skinfold thickness, body mass index, and fatal coronary heart disease: 30 year follow up of the Northwick Park heart study. J Epidemiol Community Health. 2006;60:275-9.
- [CrossRef] [PubMed] [Google Scholar]
- Relationship between blood pressure and anthropometry in a cohort of Brazilian men: A cross-sectional study. Am J Hypertens. 2009;22:980-4.
- [CrossRef] [PubMed] [Google Scholar]
- The adventitia: Essential regulator of vascular wall structure and function. Annu Rev Physiol. 2013;75:23-47.
- [CrossRef] [PubMed] [Google Scholar]
- Increased vascular smooth muscle cell stiffness: A novel mechanism for aortic stiffness in hypertension. Am J Physiol Heart Circ Physiol. 2013;305:H1281-7.
- [CrossRef] [PubMed] [Google Scholar]
- Portable Leicester Height Measure with Carry Case. Available from: http://www.marsden-weighing.co.uk/index.php/marsden-hm-250p.html [Last accessed on 2021 Mar 25]
- [Google Scholar]
- Available from: https://udallas.edu/care/_documents/_training/Weight%20and%20Height%20instructions%20prelim.pdf [Last accessed on 2021 Mar 25]
- About Adult BMI. 2020. Atlanta, Georgia: Centers for Disease Control and Prevention; https://www.cdc.gov/healthyweight/assessing/bmi/adult_bmi/index.html . [Last accessed on 2021 Mar 25]
- [Google Scholar]
- Available from: http://file:///C:/Users/shantala/Documents/Manuscript/Subclinical%20CAD%20for%20IJPP/standard%20ECG%20recording.pdf [Last accessed on 2021 Mar 28]
- The epidemiology of diabetic neuropathy. Diabetic cardiovascular autonomic neuropathy multicenter study group. J Diabetes Complications. 1992;6:49-57.
- [CrossRef] [Google Scholar]
- Cardiac autonomic dysfunction in diabetes mellitus. Methodist Debakey Cardiovasc J. 2018;14:251-6.
- [CrossRef] [PubMed] [Google Scholar]
- Serum uric acid and plasma norepinephrine concentrations predict subsequent weight gain and blood pressure elevation. Hypertension. 2003;42:474-80.
- [CrossRef] [PubMed] [Google Scholar]
- High blood pressure and its association with body weight among children and adolescents in the United Arab Emirates. PLoS One. 2014;9:e85129.
- [CrossRef] [PubMed] [Google Scholar]
- Role of parasympathetic inhibition in the hyperkinetic type of borderline hypertension. Circulation. 1971;44:413-8.
- [CrossRef] [PubMed] [Google Scholar]
- Heart rate variability as a measure of autonomic function during weight change in humans. Am J Physiol. 1991;261:R1418-23.
- [CrossRef] [PubMed] [Google Scholar]
- Relationship of height, weight and body mass index to heart rate variability. Sudan Med J. 2011;47:14-9.
- [Google Scholar]


