
Translate this page into:
Age-associated changes in vascular health and its relation with erythropoietin
*Corresponding author: Dr. Jyoti P. Khodnapur, MD, PhD Associate Professor, Laboratory of Vascular Physiology and Medicine, Department of Physiology, BLDE (Deemed to be University), Shri. B. M. Patil Medical College and Research Centre, Vijayapur - 586 103, Karnataka, India. jyoti.khodnapur@bldedu.ac.in
-
Received: ,
Accepted: ,
How to cite this article: Khodnapur JP, Das KK. Age-associated changes in vascular health and its relation with erythropoietin. Indian J Physiol Pharmacol 2021;65(2):119-26.
Abstract
Objectives:
Vascular stiffness due to ageing assessed by alteration in mean arterial blood pressure, brachial-ankle and carotid-femoral pulse wave velocity (b-f PWV/c-f PWV) and brachial and ankle arterial stiffness index (ASI). The present study aimed to determine the influence of ageing on vascular health and its relation to oxygen sensing protein that is, erythropoietin (EPO), in both genders (men and women).
Materials and Methods:
Randomly selected 204 healthy participants involving men and women between 20 and 95 years among the general population of city. The total sample size was split into six groups from Group I to VI, each containing 17 men participants and 17 women participants. We determined PWV [brachial-ankle and carotid-femoral (PWV)] and ASI (brachial ASI and ankle ASI) by using periscope and estimated serum erythropoietin (Epo) by ELISA method and implemented a one-way ANOVA post hoc test for statistical analysis by using SPSS software version 23.
Results:
Decreased serum EPO with increased vascular parameters such as mean arterial pressure (MAP), PWV and ASI observed in Group 5 and 6 of both genders.
Conclusion:
We conclude that ageing influences PWV, ASI, MAP and EPO in men and women participants.
Keywords
Ageing
Pulse wave velocity
Arterial stiffness index
vascular health
Erythropoietin

INTRODUCTION
As aged population is rising globally, hence, the assessment of total vascular risk in relation to ageing is critically important. Old age is usually associated with cardiovascular (CV) diseases and neurological disorders lead to the serious causes of morbidity, mortality and disability in most of the countries.[1] Evidence indicates the link between ageing and arterial stiffness from various parts of the world. Increased arterial stiffness considered to be an independent predictor of CV mortality and morbidity.[2-5] Increased arterial stiffness with age is the guideline of CV risk.[6] Studies showed that pulse wave velocity (PWV) is a broadly endorsed parameter for a measure of arterial stiffness. Arterial stiffness also determined by arterial stiffness index (ASI). Increased PWV depicts an increase in arterial stiffness.[2,3,7,8] Carotid-femoral PWV (c-f PWV) and brachial-ankle PWV (b-a PWV) are gold standard measure of aortic stiffness.[6,9] Erythropoietin (EPO) is a glycoprotein growth factor acts as an oxygen-sensing device which is synthesised by cells adjacent to the proximal renal tubules in response to signals from the renal system.[10] EPO regulates most of the oxygen sensing gene expression which, in turn, maintains vascular health and probably influences ageing. Several studies have shown that EPO used clinically as a vital drug for erythropoiesis. In experimental animal studies of cardiovascular disorders, EPO exerts protection by increasing endothelial production of nitric oxide, blocking the programmed cell death of myocytes, smooth muscle cells and endothelial cells of the heart. EPO accelerates the repair of damaged endothelium and new vessel formation by mobilising the parent cells from bone marrow. A better understanding of the role of erythropoietin in vascular health in the process of ageing is needed.[11]
This study aimed to assess the EPO and vascular functions in ageing in both men and women among the general healthy population of Vijayapura city, Karnataka, India. Hence, the present study’s hypothesis predicts that the oxygen sensing mechanism that is, EPO, alters with ageing. Further sex influences age-related changes in vascular physiology EPO.
MATERIALS AND METHODS
This cross-sectional study was conducted, including 204 healthy participants ranging from 20 to 95 years from Vijayapura city, Karnataka, India. After obtaining informed consent from participants, the recordings were done at supine posture after rest for 10 min between 9 am and 11 am at room temperature. Participants from both sexes with BMI <25 kg/m2, resting BP <140/90 mmHg were included in the study. Participants with smoking, tobacco consumption in any form, alcohol intake, suffering from hypercholesterolemia, hypertension, diabetes mellitus and taking medications such as statins, antidiabetics, diuretics, antihypertensives, beta-blockers and vasodilators were excluded from the study.
Sample size calculation
The present study will determine an association between EPO and age at a two-sided 0.05 significant level if the actual change in the dependent variable (EPO) is 0.5IU/L/1 standard deviation change in the independent variable (age). The power of the study is 80%.
(Where, n is the sample size required in each group, α is the selected level of significance, 1-β is the selected power, σ is standard deviation and μ is mean difference).
Systematic randomised sampling method was followed. The whole sample was divided into six groups having 34 participants in each group again subdivided into men and women in each group including 17 participants: [12] Group I, age 20–29 years; Group II, age 30–39 years; Group III, age 40–49 years; Group IV, 50–59 years; Group V, 60–69 years and Group VI, 70 plus years.
Recording of physiological parameters
Height (cm), weight (kg), BMI (kg/m2), heart rate in (beats/ min), pulse pressure (mmHg) and mean arterial blood pressure using stadiometer and mercury sphygmomanometer (mmHg) recorded in all participants. Blood pressures were recorded by auscultatory method. Each of the parameters was assessed thrice for each of the subjects and considered the average value.[13]
Haematological analysis
One millilitre of blood was collected in commercial tubes containing about 40 μl potassium EDTA as anticoagulant and the blood cell count was analysed within 24 h by automated haematology cell counter (CYSMAX K4500 Transatia). Complete blood count analysis including red blood cell, white blood cell, haemoglobin percentage %, packed cell volume, platelet count and blood indices such as mean corpuscular volume, mean corpuscular haemoglobin and mean corpuscular haemoglobin concentration.[14]
Arterial stiffness parameters
Determined arterial stiffness parameters using periscope, a non-invasive automatic device, based on oscillometric method (Periscope, Genesis Medical Systems, India).[15] All recordings were made in supine position. Avoided operator bias as the device is fully automated; it displays the results by itself.
Following are the arterial stiffness parameters:
PWV
b-aPWV
To estimate b-a PWV, periscope uses ECG recordings (Lead I and II) and brachial and tibial artery pressure waveforms. b-a PWV reflects the stiffness of the central elastic artery and peripheral semi-muscular arteries. Pulse transit time (PTT) between brachium (brachial artery) and respective ankle will be calculated as the time difference between the feet of the respective pulse wave, which originates from the R-wave (QRS complex) of ECG. Periscope uses the height of the subject to calculate the distance between the sampling points of b-a PWV. The formula is used to calculate b-a PWV is
(Where, b-aPWV is brachial ankle pulse wave velocity, Lba = Distance between respective brachium and ankle and PTTba = PTT between brachium and respective ankle was calculated as the time difference between the feet of respective pulse wave originated from R-wave (QRScomplex) of ECG).
The c-f PWV
The c-f PWV: The formula used to calculate the c-f PWV is (0.8333*Avg. b-a PWV-233.33) derived by periscope.[9]
Calculation of ASI
ASI reflects local arterial stiffness. Periscope calculates ASI using oscillometric envelopes.[16] ASI at brachial artery as brachial ASI (bASI) and tibial artery as ankle ASI (aASI) was calculated by quantifying the oscillometric envelopes derived from the oscillations in the respective artery.
(ASI = [Systolic side value of cuff pressure at 80% of maximal oscillation amplitude of cuff] − [Diastolic side value of cuff pressure at 80% of maximal oscillation amplitude of cuff]).
Serum EPO
Serum EPO levels were determined using EPO enzyme-linked immunosorbent assay (ELISA) kit (Ray Biotech Company). This kit was based on the principle of standard sandwich ELISA.[17]
Ethical considerations
Ethical issues of study were reviewed and approved by the Institutional Ethical Committee. (BLDE University, Shri B.M. Patil Medical College, Vijayapura, Karnataka, India [IEC Ref No-141/2015-16 dated 20 July 2015]). Declaration of Helsinki has been followed during the entire study.
Statistical analysis
Data were expressed as mean ± S.D. Comparisons of normally distributed variables between the age groups were done using unpaired ‘t’ test and one-way ANOVA followed by post hoc test (LSD). Two-tailed level of significance was P < 0.05 or P < 0.01 using SPSS software 16.0.
Impact % calculation
Impact of each parameter value has been calculated by mean difference of each age group as compared to Group I (20–29 years) in % and presented as figures for both men and women separately.
RESULTS
Age-related changes in anthropometric, physiological and haematological parameters in men and women participants
[Table 1] shows the anthropometric, physiological and haematological parameters among males divided into six groups by age. There was no significant difference in weight (P = 0.091), height (P = 0.081) and BMI (P = 0.076) between groups observed. In case of PR (P = 0.025) and mean arterial pressure (MAP) (P < 0.001), ANOVA shows significance. There was no significant difference (p<0.05) in RBC count, WBC count, Hb concentration, oxygen carrying capacity, PCV, MCV, MCH, MCHC and platelet count between all groups. [Table 2] shows the anthropometric, physiological and haematological parameters among female participants divided into six groups by age decades. In case of height (P = 0.008), weight (P < 0.05), BMI (P = 0.003), PR (P = 0.031) and MAP (0.013), ANOVA shows statistical significance but all the values are within normal range. There was no significant difference (P < 0.05) in RBC, WBC, Hb concentration, oxygen carrying capacity, PCV, MCV, MCH, MCHC and platelet count between all groups.
| Parameters | Age groups (years) | ||||||
|---|---|---|---|---|---|---|---|
| Group I | Group II | Group III | Group IV | Group V | Group VI | ANOVA | |
| 20–29 years (n=17) |
30–39 years (n=17) |
40–49 years (n=17) |
50–59 years (n=17) |
60–69 years (n=17) |
70 years plus (n=17) |
P’ value | |
| Weight, kg | 68.25+9.75 | 65+4.94 | 72.37+9.72 | 65+4.3 | 68+15.87 | 58.44+10.15 | 0.091 |
| Height, cm | 168.5+4.06 | 167.6+4.20 | 162.66+6.34 | 167.7+7.76 | 167.9+5.52 | 162.9+6.3 | 0.081 |
| BMI, kg/m2 | 24.06+2.8 | 23.33+1.16 | 25.76+2.44 | 24.84+0.85 | 23.87+4.54 | 21.89+2.31 | 0.076 |
| HR, bpm | 73.58+8.37 | 74.86+9.86 | 77.82+9.55 | 75.54+6.77 | 72.9+10.7 | 63.1+7.43* | 0.025 |
| SBP, mmHg | 118.35+6.4 | 118.53+9.4 | 122.6+4.8 | 122+13.4 | 131.7+11.1+ | 137.3+10* | <0.001 |
| DBP, mmHg | 70.11+6.5 | 69.7+7.11 | 73.29+6.16 | 76.5+8.3 | 81+11.7+ | 79.3+5.1* | <0.001 |
| MAP, mmHg | 86.2+5.8 | 85.9+5.9 | 89.7+4.5 | 91.48+9.9 | 97.9+11.6+ | 98.6+6.4* | <0.001 |
| RBC count, millions/mm3 | 5.31+0.27 | 5.21+0.31 | 4.62+0.62 | 4.92+0.59 | 5.02+0.18 | 4.33+0.6 | 0.06 |
| WBC, thousands/mm3 | 7310+1524.16 | 9235+1376.57 | 6954+1577 | 6827.5+697.2 | 7143.3+1928.8 | 5700+1110 | 0.06 |
| Hb, gm% | 15.57+1.08 | 14.67+2.05 | 14.4+1.24 | 14.67+0.57 | 14.7+0.60 | 13.34+1.16 | 0.146 |
| O2 carrying capacity, ml | 20.8+1.44 | 19.66+2.75 | 19.29+1.66 | 19.6+0.75 | 19.69+0.8 | 17.87+1.56 | 0.145 |
| PCV, % | 47.05+3.2 | 44.9+4.49 | 44.42+4.03 | 45.95+2.85 | 46.16+2.08 | 41.37+3.5 | 0.16 |
| MCV, fl | 88.6+6.03 | 86.37+7.13 | 96.72+6.91 | 93.8+6.76 | 91.9+4.5 | 96.64+8.7 | 0.197 |
| MCH, pg | 29.3+1.6 | 28.2+3.8 | 31.32+1.8 | 30.02+2.9 | 29.26+1.61 | 31.18+3.18 | 0.484 |
| MCHC, % | 33.12+0.76 | 32.55+1.83 | 32.42+1.04 | 32+1.39 | 31.86+0.35 | 32.2+0.76 | 0.683 |
| Platelet count, lakhs/mm3 | 2.72+0.49 | 2.95+0.28 | 2.08+0.25 | 2.79+1.1 | 2.51+0.51 | 2.16+0.57 | 0.175 |
Data are Mean+SD. Values in the final column represent results of one-way analysis (ANOVA) among different age groups. Post hoc comparisons were made between each group with LSD method. +,*Indicates a significant difference of Groups V and VI with Groups I, II, III and IV, respectively. P<0.05 considered as significant. BMI: Body mass index, HR: Heart rate, PP: Pulse pressure, MAP: Mean arterial pressure
| Parameters | Age groups (years) | ||||||
|---|---|---|---|---|---|---|---|
| Group I | Group II | Group III | Group IV | Group V | Group VI | ANOVA | |
| 20–29 years (n=17) |
30–39 years (n=17) |
40–49 years (n=17) |
50–59 years (n=17) |
60–69 years (n=17) |
70 years plus (n=17) |
P’ value | |
| Weight, kg | 56+8.6 | 55.82+6.73 | 59.1+5.93 | 62.2+7.0 | 57.6+10.39 | 43.5+5* | 0.008 |
| Height, cm | 158.29+2.73 | 152.0+6.3 | 151.1+3.5 | 156.6+3.92 | 150.06+4.77 | 148.5+3.10 | <0.05 |
| BMI, kg/m2 | 22.42+3.38 | 24.02+3.01 | 25.35+2.3 | 25+2.6 | 25.44+3.3 | 19.72+2.39 | 0.003 |
| HR, bpm | 74+9.17 | 74.13+11.24 | 71.58+7.77 | 75.41+4.4 | 71.93+8.5 | 65.33+12.09 | 0.031 |
| SBP, mmHg | 111+10.7 | 110.2+10.8 | 116.5+14.6 | 118.8+8.42 | 129.8+20+ | 128.94+20.7* | <0.05 |
| DBP, mmHg | 67.4+75.8 | 69.4+9.05 | 73.88+12.6 | 72.2+5.4 | 73.8+9.3 | 73.88+8.8 | 0.16 |
| MAP, mmHg | 81.97+6.6 | 83.03+9.5 | 88.1+13.1 | 87.7+5.7 | 92.5+12.4+ | 109.9+19* | <0.05 |
| RBC count, millions/mm3 | 4.32+0.46 | 4.51+0.45 | 4.26+0.23 | 4.93+0.42 | 4.52+0.30 | 4.65+0.82 | 0.056 |
| WBC, thousands/mm3 | 8922+2041 | 7796+1414 | 7666.6+681 | 8136.6+2000 | 7886+2259 | 7250+1992 | 0.06 |
| Hb, gm% | 12.92+1.0 | 12.7+0.5 | 12.7+0.5 | 12.1+2.49 | 13.16+0.9 | 12.6+0.9 | 0.146 |
| O2 carrying capacity, ml | 17.05+1.4 | 16.8+0.63 | 16.8+0.75 | 15.9+3.29 | 17.36+1.29 | 16.6+1.19 | 0.145 |
| PCV, % | 39.98+3.0 | 39.78+1.93 | 40.16+1.98 | 39.56+5.8 | 41.98+2.62 | 40.5+1.11 | 0.16 |
| MCV, fl | 92.8+4.3 | 88.68+6.0 | 94.16+2.8 | 80.03+6.68 | 92.88+4.12 | 89+16.3 | 0.197 |
| MCH, pg | 30+2.03 | 28.36+2.4 | 29.86+1.4 | 24.4+3.5 | 29.12+1.37 | 27.86+5.95 | 0.484 |
| MCHC, % | 32.32+0.78 | 31.94+0.6 | 31.7+0.62 | 30.4+1.9 | 31.34+0.55 | 31.16+1.4 | 0.683 |
| Platelet count, lakhs/mm3 | 3.43+0.34 | 3.27+0.43 | 2.91+0.89 | 3.72+0.81 | 2.76+0.91 | 2.78+0.19 | 0.175 |
Data are Mean+S.D. Values in the final column represent results of one-way analysis (ANOVA) among different age groups. Post hoc comparisons were made between each group with LSD method. +,*Indicates a significant difference of Groups V and VI with Groups I, II, III and IV, respectively. P<0.05 considered as significant. BMI: Body mass index, HR: Heart rate, PP: Pulse pressure, MAP: Mean arterial pressure
Age-related changes in vascular functions in men and women participants
[Figure 1] depicts the mean + SD of b-a PWV and c-f PWV among both men and women in different age groups. Results showed increased both b-f and c-f PWV with age among both men and women participants also showed that mean values of b-f and c-f PWV in women were lower as compare to men in all age groups except Group V (60–69 years) and VI (70 years plus). We further observed a greater magnitude of the steady rise in brachial-ankle and carotid-femoral (PWV) in women from age forty onwards compared to men. It has also been observed that values of b-a PWV and c-f PWV are almost same in men and women participants after the age of 60.
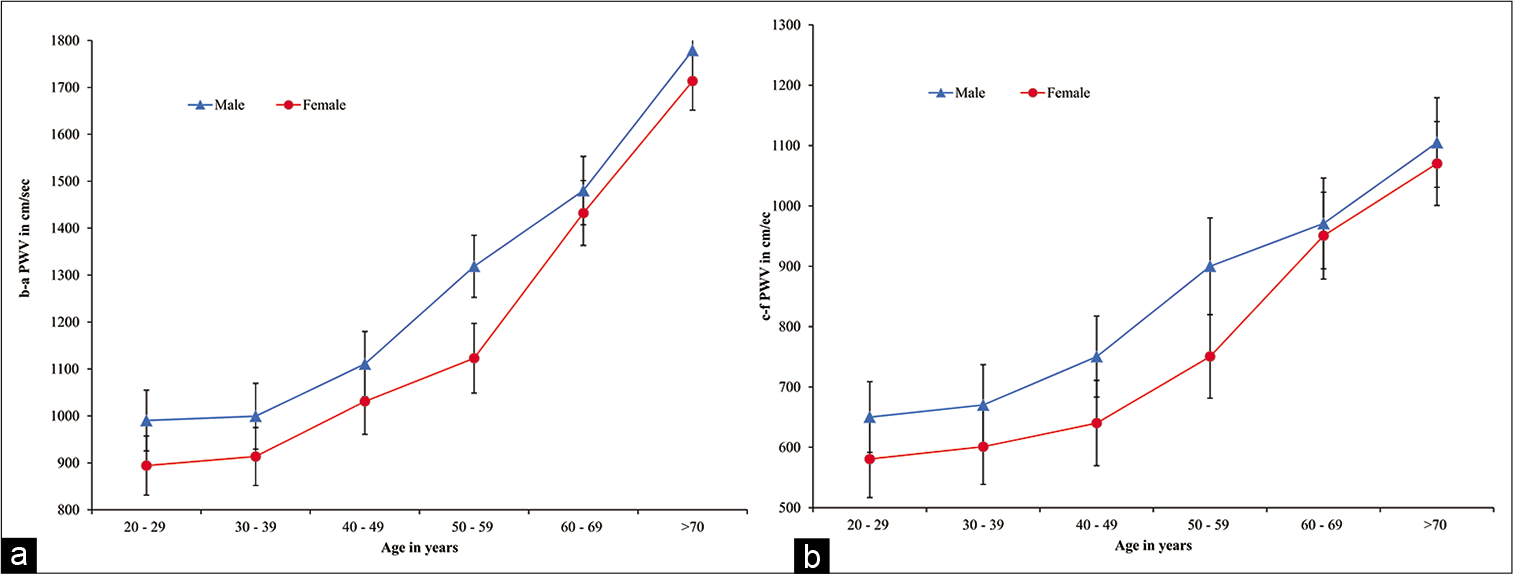
- (a) b-a PWV values in men and women of different age groups. Values are mean+SD of each age group. (b) c-f PWV values in men and women of different age groups. Values are mean+SD of each age group. b-a PWV: Brachial-ankle pulse wave velocity, c-f PWV: Carotidfemoral pulse wave velocity
[Figure 2] depicts the mean + SD of the bASI and aASI of different age groups among both men and women. It has been found that both bASI and aASI progressively increased along with the age in both men and women participants which are further noticed that from Group I (20–29 years) to III (40–49 years) statistically significant increase in both bASI and aASI. Further, it has been noticed that both bASI and aASI values in women were higher than men after the age of 50 and 40, respectively. While comparing the mean values of the results of bASI and aASI between men and women showed statistically significant differences at group VI onwards (bASI) and group V onwards (aASI).

- (a) bASI value in men and women participants of different age groups. Values are mean+SD of each age group in males and females men and women participants. (b) aASI value in men and women participants of different age groups. Values are mean+SD of each age group in men and women participants. bASI: Brachial arterial stiffness index, aASI: Ankle arterial stiffness index
Age-related changes in EPO in men and women participants
The results showed decreased serum EPO level among both men and women as age progressed [Figure 3]. The decrease of EPO values was significant in both males and females in Group V and VI as compared Group I.
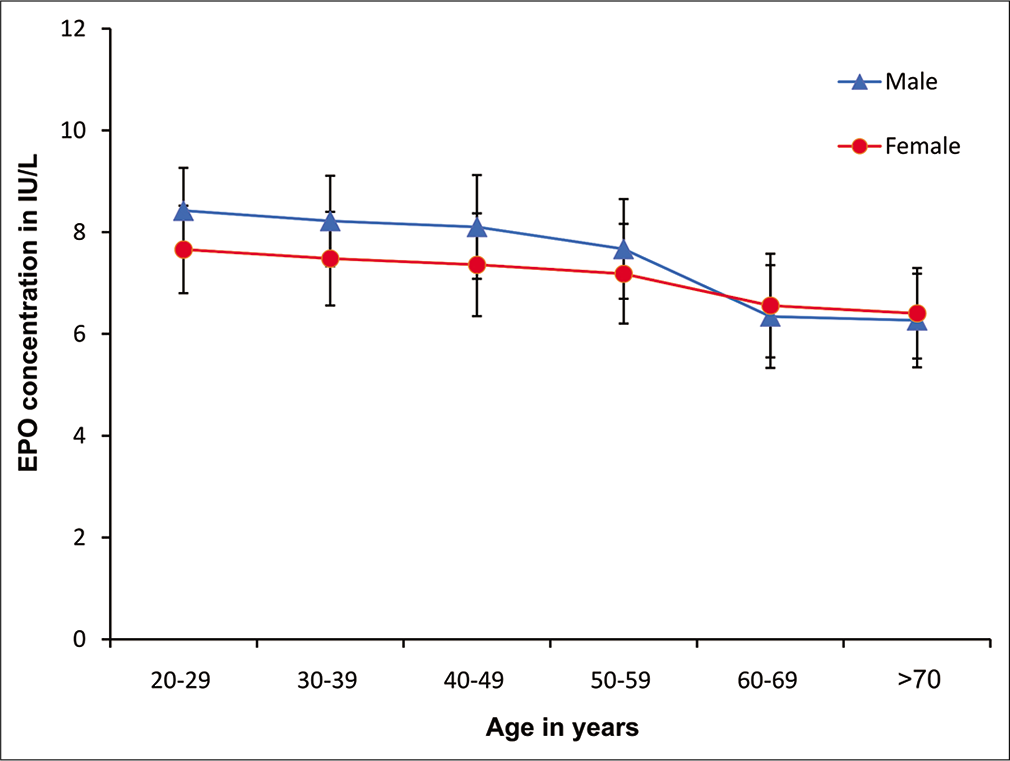
- Serum EPO value in men and women participants of different age groups. Values are mean+SD of each age men and women participants. EPO: Erythropoietin
Percentage change values (impact) of MAP, b-a PWV, c-f PWV, bASI, aASI and EPO in men and women
[Figure 4] depicts the percentage change values (impact) of MAP, b-a PWV, c-f PWV, bASI, aASI and EPO in males and females men and women, respectively. It has been noticed that both PWV and ASI were increased with age in both men and women participants while serum EPO level decreased with age among both men and women participants. MAP was also found to be increased with age among both men and women. Impact of decrease of EPO is remarkable in both men and women in age Group IV (50–59 years), V (60–69 years) and Group VI (70 years plus). It is further noticed that percentage change (impact) decrease of EPO is relatively higher in men as compared to women counterparts.
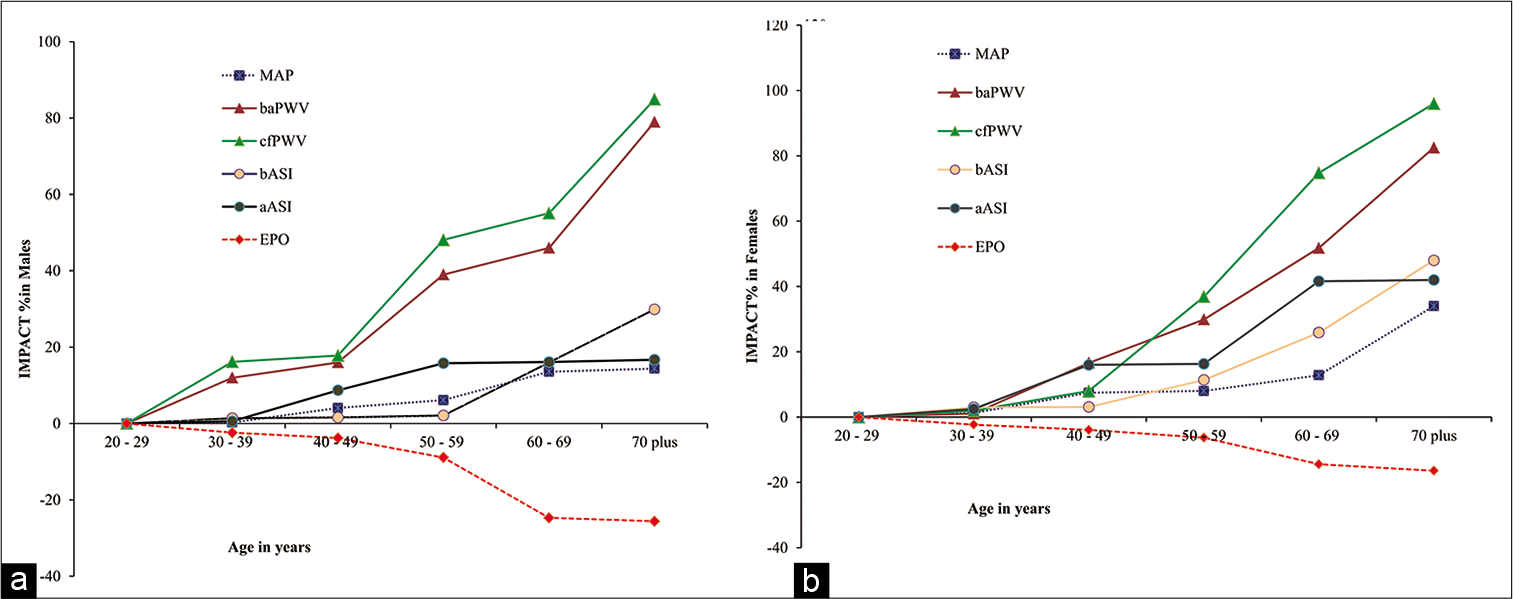
- (a) Impact of ageing on vascular function and oxygen sensing mechanism among men participants from different age groups. Values are percentage (%) of each parameter of each age group men and women participants. (b) Impact of ageing on vascular function and oxygen sensing mechanism among women participants from different age groups. Values are percentage (%) of each parameter of each age group in men and women participants.
DISCUSSION
Arterial stiffness (PWV and ASI) and one of the oxygen sensing protein that is, EPO in relation to ageing among different age groups including both men and women participants (20–95 years) were assessed.
Age-related changes in anthropometric, physiological and haematological parameters in men and women participants
Our study showed a statistical increase in MAP later in Group V (60–69 years) and VI (70 plus years) that is, after the age of 60 years in both men and women participants. The present study also showed a significant increase (p < 0.05) in SBP after the age of 60 years in males and females that is, in Group V (60–69 years) and VI (70 plus years). Results relating to BP in all the age groups in both men and women support with the different studies.[18-20]
Age-related changes in vascular functions in men and women participants
Our study showed significant (P < 0.05) increase in the b-f and c-f PWV in both men and women participants with age and our results corroborate with study by McEniery et al. (2005) and Liu et al. (2005).[21,22] Our study consistently showed a higher b-a PWV and c-f PWV in men as compare to women until the age group of 50–59 years later the PWV becomes almost equal in both men and women participants. The differential changes of PWV in women compared to men are due post-menopausal physiology in women.[23,24] Similar results were found in a study by Millar et al.[19] Bia et al. (2017) in their study concluded that patients with diabetic nephropathy showed increased PWV ratio. Patil et al. showed significant association of PWV ratio with body hydration status and age but did not show association with BP.[25]
Significant increase in bASI and aASI of both men and women participants in the present study reflects age-dependent brachial and tibial artery stiffness.[26] Increase in arterial stiffness of the present study further indicates the rigidity of the vascular wall that is, arteriosclerosis possibly due to altered biochemical and histopathological architecture in arterial wall.[27,28] Disarrangement of elastic laminae along with increased in collagen fibres and connective tissues may be other reasons behind age-related increase in arterial stiffness.[29,30]
A significant increase of bASI and aASI in women after 50 years (Group V and Group VI) in our study may be due to post-menopausal hormonal profile.[31] It has further observed that vessel diameter increased due to decreased elasticity could increase rigidity and make the vessel more vulnerable to risk factors.[30] Further, it has also been reported that PWV and aortic stiffness index of women are good indicators to assess age-dependent cardiovascular risk factors.[32]
Age-related changes in EPO in men and women participants
Our results showed significant decrease in the serum EPO level with ageing among both men and women indicate a possibility of age-related development of vasoconstriction and angiogenesis.[33,34] Our results differed from the study of Musso et al. (2004)[35] where their results showed unaltered EPO levels in relation to ageing. Ershler et al.[36] noticed increased EPO in relation to ageing. Another study showed significant higher values of aortic PWV in never treated hypertensive (47.8 ± 10 years) patients compared to age- and sex-matched (47 ± 8.6 years) controls but did not show any significant alteration in EPO levels also did not show any correlation of EPO with aortic PWV.[37] Study by Bartels et al. (2012) showed therapy with EPO does not deteriorate arterial stiffness and endothelial function in renal transplant recipients.[38]
In our study, we noticed age associated low EPO but unchanged erythrocyte count and Hb concentration indicate no serious pathophysiological impact in haematopoiesis on ageing where as a study by Montero et al. (2016) showed that arterial stiffness is associated with low red blood cell volume in healthy individuals (age 23+2).[39] Although the study showed an age-dependent greater bASI and aASI in females, it did not corroborate with the age-dependent EPO secretion in women. These findings reflect that the secretion of EPO in women in ageing is independent of ovarian steroids hormones.[40]
Percentage change values (impact) of MAP, b-a PWV, c-f PWV, bASI, aASI and EPO in men and women
The present study clearly showed age associated changes in vascular functions with increased PWV, ASI and MAP in higher age groups of men and women. Age-related decrease in serum EPO level in both men and women predicts possible functional alterations of haematopoiesis, haemodynamics and vascular homeostasis.
Shortcomings
The sample size of the present is limited as the study involved different groups. Our study included only 204 participants involving different groups. Moreover, we have not done in details of cardiac haemodynamics.
Future direction
Expression of EPO gene and protein needs to be done for further understanding of oxygen sensing homeostasis in ageing.
CONCLUSION
We conclude by our study that ageing influences PWV, ASI, MAP and EPO in both men and women participants. Arterial PWV may be endorsed as important parameter in age-dependent arterial stiffness. The present study showed differential changes in PWV in both men and women participants reflected by inverse relationship between PWV and EPO in both men and women in relation to age. Understanding of these mechanisms may support greater pharmacophysiological perspective of arterial stiffness and ageing.
Declaration of patient consent
The authors certify that they have obtained all appropriate patient consent.
Financial support and sponsorship
BLDE (Deemed to be University), Vijayapura.
Conflicts of interest
There are no conflicts of interest.
References
- Aortic stiffness is an independent predictor of all-cause and cardiovascular mortality in hypertensive patients. Hypertension. 2001;37:1236-41.
- [CrossRef] [Google Scholar]
- Aortic pulse wave velocity predicts cardiovascular mortality in participants> 70 years of age. Arterioscler Thromb Vasc Biol. 2001;21:2046-50.
- [CrossRef] [Google Scholar]
- Carotid artery plaque burden, stiffness, and mortality risk in elderly men. Circulation. 2004;110:344-8.
- [CrossRef] [Google Scholar]
- Increased arterial stiffness is independently related to cerebrovascular disease and aneurysms of the abdominal aorta. Stroke. 2004;35:1642-6.
- [CrossRef] [Google Scholar]
- Recent advances in arterial stiffness and wave reflection in human hypertension. Hypertension. 2007;49:1202-6.
- [CrossRef] [Google Scholar]
- Expert consensus document on arterial stiffness: Methodological issues and clinical applications. Eur Heart J. 2006;27:2588-605.
- [CrossRef] [Google Scholar]
- Arterial stiffness index: A new evaluation for arterial stiffness in elderly patients with essential hypertension. Geriatr Gerontol Int. 2002;2:199-205.
- [CrossRef] [Google Scholar]
- Validity, reproducibility, and clinical significance of noninvasive brachial-ankle pulse wave velocity measurement. Hypertens Res. 2002;25:359-64.
- [CrossRef] [Google Scholar]
- Regulation of erythropoietin gene expression depends on two different oxygen-sensing mechanisms. Mol Genet Metab. 1999;67:113-7.
- [CrossRef] [Google Scholar]
- Classification of age groups based on facial features. Tamkang J Sci Eng. 2001;4:183-92.
- [Google Scholar]
- Standardization of rat blood clotting tests with reagents used for humans. Proc West Pharmacol Soc. 2001;44:153-6.
- [Google Scholar]
- Validity and reproducibility of arterial pulse wave velocity measurement using new device with oscillometric technique: A pilot study. Biomed Eng Online. 2005;4:49.
- [CrossRef] [Google Scholar]
- Non-Invasive measurement of aortic pressure in patients: Comparing pulse wave analysis and applanation tonometry. Indian J Pharmacol. 2012;44:230-3.
- [CrossRef] [Google Scholar]
- Two-site sandwich enzyme immunoassay with monoclonal antibodies to human alpha-fetoprotein. J Immunol Methods. 1981;42:11-5.
- [CrossRef] [Google Scholar]
- Implications of pulse pressure as a predictor of cardiac risk in patients with hypertension. Hypertension. 2000;36:907-11.
- [CrossRef] [Google Scholar]
- Hemodynamic patterns of age-related changes in blood pressure. Circulation. 1997;96:308-15.
- [CrossRef] [Google Scholar]
- Normal vascular aging: Differential effects on wave reflection and aortic pulse wave velocity: The Anglo-Cardiff collaborative trial (ACCT) J Am Coll Cardiol. 2005;46:1753-60.
- [CrossRef] [Google Scholar]
- Comparison of brachial-ankle pulse wave velocity in Japanese and Russians. Tohoku J Exp Med. 2005;207:263-70.
- [CrossRef] [Google Scholar]
- Determinants of arterial stiffness in an apparently healthy population over 60 years. J Hum Hypertens. 2006;20:749-56.
- [CrossRef] [Google Scholar]
- Aortic-radial pulse wave velocity ratio in end-stage renal disease patients: Association with age, body tissue hydration status, renal failure etiology and five years of hemodialysis In: High Blood Press Cardiovasc Prev. Vol 24. 2017. p. :37-48.
- [CrossRef] [Google Scholar]
- Evaluation of arterial stiffness in elderly with prehypertension. Indian J Physiol Pharmacol. 2015;59:16-22.
- [Google Scholar]
- Brachial-ankle pulse wave velocity in the measurement of arterial stiffness: Recent evidence and clinical applications. Curr Hypertens Rev. 2014;10:49-57.
- [CrossRef] [Google Scholar]
- The blood vessels In: Pathology Secrets. Missouri: Mosby; 2009. p. :121-36.
- [CrossRef] [Google Scholar]
- A lamellar unit of aortic medial structure and function in mammals. Circ Res. 1967;20:99-111.
- [CrossRef] [Google Scholar]
- Transmural organization of the arterial media. The lamellar unit revisited. Arterioscler Thromb Vasc Biol. 1985;5:19-34.
- [CrossRef] [Google Scholar]
- Influences of age and gender on results of non-invasive brachial-ankle pulse wave velocity measurement-a survey of 12 517 participants. Atherosclerosis. 2003;166:303-9.
- [CrossRef] [Google Scholar]
- Associations of endogenous sex hormones with the vasculature in menopausal women: The study of women's health across the nation (SWAN) Menopause. 2008;15:414.
- [CrossRef] [Google Scholar]
- Gender difference in arterial stiffness in a multicenter cross-sectional study: The Korean arterial aging study (KAAS) Pulse. 2014;2:11-7.
- [CrossRef] [Google Scholar]
- The effect of erythropoietin on normal and neoplastic cells. Biologics. 2012;6:163-89.
- [CrossRef] [Google Scholar]
- Peripheral neuropathy response to erythropoietin in Type 2 diabetic patients with mild to moderate renal failure. Clin Neurol Neurosurg. 2012;114:663-7.
- [CrossRef] [Google Scholar]
- Plasma erythropoietin levels in the oldest old. Int Urol Nephrol. 2004;36:259-62.
- [CrossRef] [Google Scholar]
- Serum erythropoietin and aging: A longitudinal analysis. J Am Geriatr Soc. 2004;53:1360-5.
- [CrossRef] [Google Scholar]
- Circulating levels of erythropoietin and its relation to arterial stiffness in patients with hypertension. Int J Clin Exp Med. 2013;6:706-11.
- [Google Scholar]
- Influence of erythropoietin on arterial stiffness and endothelial function in renal transplant recipients. Am J Nephrol. 2012;36:355-61.
- [CrossRef] [Google Scholar]
- Arterial stiffness is strongly and negatively associated with the total volume of red blood cells. Int J Cardiol. 2016;221:77-80.
- [CrossRef] [Google Scholar]
- Effects of aging on erythropoietin secretion in female rats. Mech Ageing Dev. 1998;103:81-90.
- [CrossRef] [Google Scholar]


