
Translate this page into:
Assessment of obesity indices for prediction of hyperglycemia in adult population of Varanasi (Uttar Pradesh), India
*Corresponding author: Jyotsna Kailashiya, Department of Biochemistry, Institute of Medical Sciences, Banaras Hindu University, Varanasi, Uttar Pradesh, India. jyotsna.kailashiya@gmail.com
-
Received: ,
Accepted: ,
How to cite this article: Rai N, Sharma HB, Kumari R, Kailashiya J. Assessment of obesity indices for prediction of hyperglycemia in adult population of Varanasi (Uttar Pradesh), India. Indian J Physiol Pharmacol 2020;64(3):195-200.
Abstract
Objectives:
Obesity is a known risk factor for diabetes mellitus. Multiple obesity indices are available to assess and classify obesity status, including Body Mass Index (BMI), Waist Circumference (WC), and Waist-Height Ratio (WHtR). The present research was conducted to assess these obesity indices for their usefulness in predicting hyperglycemia.
Materials and Methods:
BMI, WC, WHtR, and Random Capillary Blood Glucose (RCBG) levels were measured in total 188 adult volunteers from Varanasi, Uttar Pradesh, India. Pearson correlation, unpaired Student’s t-test, and Chi-square tests were applied to assess associations and difference of measured parameters among different categories. Receiver operating curve analysis was performed to find best obesity indices to predict hyperglycemia (RCBG ≥140 mg/dl) and to find optimal cut off values for prediction.
Results:
Age of subjects, WC and WHtR (but not BMI) were found significantly correlated with RCBG levels. WHtR classified highest number of subjects as obese, compared to BMI and WC. WHtR was also found to be the best obesity index to predict hyperglycemia in both male and female subjects.
Conclusion:
WHtR can be used as cost effective, non-invasive, and convenient obesity index for screening and prediction of hyperglycemia in apparently healthy adult subjects. Thus, identified subjects can further be advised to undergo blood glucose testing for the early detection of diabetes and prediabetes.
Keywords
Diabetes mellitus
Obesity
Waist circumference
Waist-height ratio
Random capillary blood glucose

INTRODUCTION
Diabetes mellitus (DM) is a known obesity related non-communicable disease.[1] Both obesity and DM cases are currently on rise, especially in India.[2,3] The prevalence of prediabetes and diabetes is on rise globally as well as in India, even in young population, imparting adverse effects on health and economy.[4-6] A large number of prediabetic and diabetic cases remain undiagnosed in India,[5-7] warranting requirement of suitable screening method for early identification of these cases.
Diagnosis of hyperglycemia (prediabetic and diabetic) is essentially based on measurement of blood glucose levels, which is an invasive test. Direct relationship between high blood glucose levels (hyperglycemia) and obesity indices such as Body Mass Index (BMI), Waist-Hip Ratio (WHR) and Waist Circumference (WC) has already been well recognized and the term “diabesity” has been coined to denote diabetes occurring in obese people.[1,8] Previously reported strong association of obesity indices with DM offers a non-invasive way to screen hyperglycemia and diabetes risk at an early stage, quickly and cost effectively.
Multiple methods and criteria to assess obesity are available, such as BMI, WC, WHR and Waist-Height Ratio (WHtR), which are now internationally recognized and accepted.[8,9] BMI is used as criteria for recognition and classification of generalized obesity, while WC, WHR and WHtR are simpler methods of assessing fat distribution and central obesity.[10-12] It has been suggested that measure of central or abdominal obesity is better overall obesity related disease risk predictor.[11-13]
Indian population shows higher risk of diabetes and other obesity related non-communicable diseases even at lower values of obesity indices, compared to western population.[2,3] Studies documenting association of obesity in relation to blood sugar levels and diabetes, describing Indian population related cutoff limits of obesity indices are scanty[3] and controversial as some have reported significant association,[14-16] while others did not[9,17] in different parts of India. We conducted this study to assess association of random capillary blood glucose (RCBG) levels with obesity indices (BMI, WC and WHtR) and their cutoff values for predicting hyperglycemia as a convenient, cost-effective, and non-invasive method.
MATERIALS AND METHODS
This study was conducted in the Department of Biochemistry, Institute of Medical Sciences, Banaras Hindu University, Varanasi, India. Apparently healthy residents of Varanasi who visited the institute (including patients’ attendants, students, and employees) during study duration were offered free RCBG level estimation and obesity indices measurements. Consecutive visitors who gave consent and were willing to participate in this study were enrolled and tested. Inclusion criteria was – volunteer subjects, above 18 years of age, who were not diagnosed cases of DM. Subjects younger than 18 years age and self-reported diagnosed DM who were undergoing antidiabetic drug treatment were excluded to avoid medication-related confounding with blood glucose levels and other parameters. All testing and measurements were performed during 10 am–4 pm timing. For optimum subject compliance and convenience, RCBG levels were measured with Glucometer (Dr. Morpen GluoOne Model BG-03), following all aseptic precautions and under instrument recommended guidelines.[8,18,19] RCBG < 140 mg/dl was considered as normal and ≥140 mg/dl was taken as hyperglycemia to classify subjects.[19]
Weight (Wt) and height (Ht) were measured by resident doctors of the department. Subjects were instructed to remove heavy clothing or ornaments and shoes. Calibrated weighing balance (Crown Victoria Dx, Ramon surgical company, India) was used to measure Wt to nearest 0.5 Kg. A wall mounted stature meter (EasyCare, Krives international limited) was used to measure Ht of subjects to nearest 0.5 cm.[19] Non-flexible measuring tape (Futaba, India) was used for measuring WC at the level between lower border of costal margin and iliac crest. BMI (Kg/m2) was calculated from Wt and Ht data and following criteria were applied – <18.5 – Underweight; 18.5–22.9 – Normal; 23–24.9 – Overweight and ≥25 - obese.[2] WHtR cutoff was taken as ≥0.5 for all subjects.[9,11] WC cutoff was taken as ≥90 cm for male and ≥80 cm for female subjects.[2,9]
Total 188 subjects who fulfilled inclusion criteria during the study period were enrolled in this study. Data recorded from these 188 apparently healthy subjects (135 males and 53 females) were analyzed. Collected data were tabulated and subjects were assigned RCBG, BMI, WC and WHtR status according to the set criteria as described above. Statistical analysis was performed with help of Statistical Package for the Social Sciences (SPSS) software, version 20. Comparison of data mean of male and female was done by unpaired Student’s t-test. Pearson correlation was applied to test correlation between numerical data. Pearson Chi-square test was used to test difference in RCBG status distribution across categories of age and obesity indices. Receiver Operating Characteristic (ROC) curve analysis was performed to calculate Area Under Curve (AUC), cutoffs and sensitivity and specificity (based on highest Youden index).[12] P ≤ 0.05 was considered statistically significant.
RESULTS
[Table 1] summarizes descriptive statistics of measured variables, comparison between male and female subjects and correlation with RCBG levels. We found that there was no significant difference in age, RCBG levels, BMI and WC between male and female subjects. Males had higher mean Wt and Ht than females as expected. Despite having lower WC and Ht, females showed significantly higher WHtR than male subjects. Correlation analysis showed that age of subjects in males and WC in females is positively correlated with RCBG levels [Table 1]. WHtR showed positive correlation with RCBG when calculated for total population [Table 1].
| Total (n=188) |
Males (n=135) |
Females (n=53) | Male versus Female (unpaired student ttest P value) | Pearson correlation with RCBG levels (r, Pvalue) |
|||
|---|---|---|---|---|---|---|---|
| Mean (SD) | Mean (SD) | Mean (SD) | Males (n=135) | Females (n=53) | Total (n=188) | ||
| Age (years) | 38.19 (14.99) | 39.07 (15.34) | 35.94 (13.92) | 0.200 | 0.233, 0.006 | 0.253, 0.068 | 0.233, 0.001 |
| Random capillary blood glucose (mg/dl) | 111.99 (39.72) | 112.37 (44.26) | 111.02 (24.99) | 0.834 | - | - | - |
| Weight (Kg) | 66.68 (13.37) | 69.74 (12.54) | 58.91 (12.32) | 0.000 | −0.034, 0.693 | 0.135, 0.337 | 0.002, 0.983 |
| Height (cm) | 165.24 (8.82) | 168.95 (6.61) | 155.77 (6.31) | 0.000 | −0.127, 0.142 | 0.091, 0.519 | −0.054, 0.458 |
| Body mass index (Kg/m2) |
24.40 (4.52) | 24.42 (4.14) | 24.37 (5.41) | 0.961 | 0.018, 0.834 | 0.088, 0.533 | 0.032, 0.665 |
| Waist Circumference (cm) | 90.71 (11.67) | 90.91 (11.84) | 90.21 (11.33) | 0.715 | 0.018, 0.139 | 0.301, 0.028 | 0.155, 0.033 |
| Waist-height ratio | 0.55 (0.07) | 0.53 (0.07) | 0.58 (0.07) | 0.001 | 0.154, 0.074 | 0.259, 0.061 | 0.160, 0.028 |
Next, we analyzed number of subjects having normal and high RCBG levels in different categories of measured variables by cross tabulation [Table 2]. Total 88.3% subjects showed normal and 11.7% showed high RCBG levels. We observed that 33.81% subjects were obese as per BMI, 64.89% according to WC and 78.2% subjects were obese according to WHtR criteria. There was no difference in age group distribution and RCBG status between male and female subjects. Although generalized as well as central obesity were higher in female subjects, compared to males [Table 2]. The analysis of ROC curves [Figure 1] for AUC and cutoff limits of measured obesity indices for hyperglycemia (RCBG levels ≥140 mg/dl) are depicted in [Table 3].
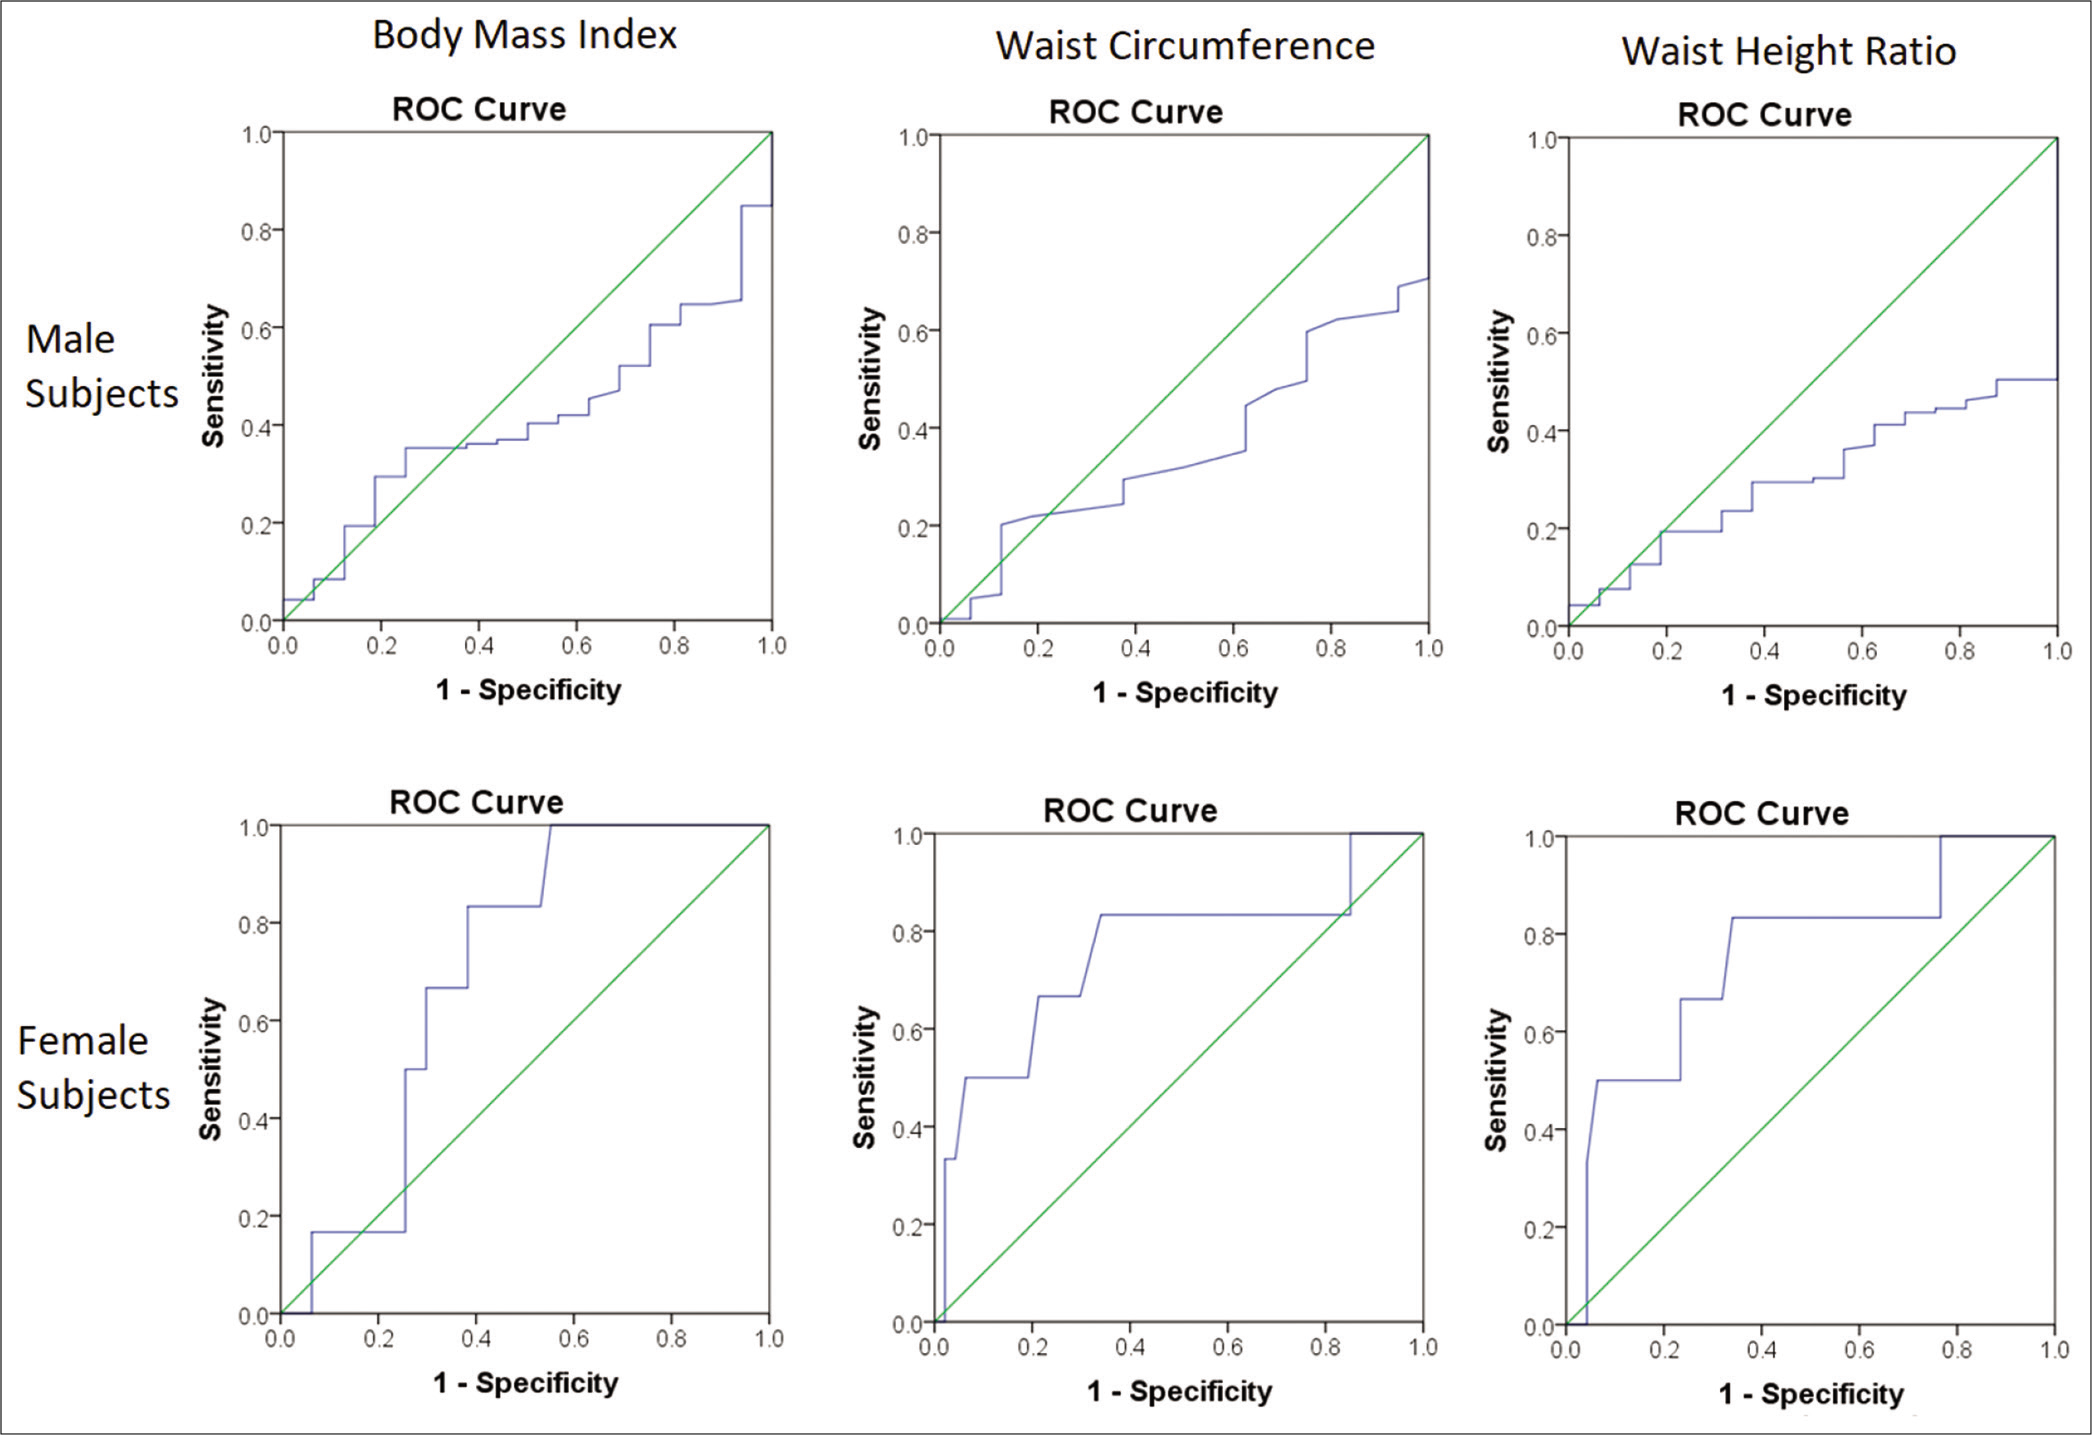
- Receiver operating curves for random capillary blood glucose.
| Parameter | Total (n=188) | Male (n=135) | Female (n=53) | Male versus Female | |
|---|---|---|---|---|---|
| Category | Number (%) | Number (%) | Number (%) | Pearson χ2test P value | |
| Age (years) | 18–25 | 59 (31.4) | 40 (29.6) | 19 (35.8) | 0.268 |
| 26–35 | 37 (19.7) | 28 (20.7) | 9 (17) | ||
| 36–45 | 26 (13.8) | 15 (11.1) | 11 (20.8) | ||
| 46–55 | 37 (19.7) | 27 (20) | 10 (18.9) | ||
| 56–65 | 24 (12.8) | 21 (15.6) | 3 (5.7) | ||
| 66–75 | 5 (2.7) | 4 (3) | 1 (1.9) | ||
| Random capillary blood glucose | Normal (<140 mg/dl) | 166 (88.3) | 119 (88.1) | 47 (88.7) | 0.919 |
| High (≥140 mg/dl) | 22 (11.7) | 16 (11.9) | 6 (11.3) | ||
| Body mass index | Underweight | 16 (8.5) | 10 (7.4) | 6 (11.3) | 0.010 |
| Normal | 64 (34) | 41 (30.4) | 23 (43.4) | ||
| overweight | 35 (18.6) | 33 (24.4) | 2 (3.8) | ||
| Obese | 73 (38.8) | 51 (37.8) | 22 (41.5) | ||
| Waist circumference | Normal | 66 (35.1) | 58 (43) | 8 (15.1) | 0.000 |
| High | 122 (64.9) | 77 (57) | 45 (84.9) | ||
| Waist-height ratio | Normal | 41 (21.8) | 35 (25.9) | 6 (11.3) | 0.029 |
| High | 147 (78.2) | 100 (74.1) | 47 (88.7) | ||
DISCUSSION
Early identification of hyperglycemia is critical for the prevention of diabetes as well as reduction of undiagnosed cases. Diabetes can even be prevented/delayed by lifestyle modification when blood glucose is still at prediabetic levels. Early diagnosis of hyperglycemia is limited in India by financial burden on subjects and also by lack of awareness about presence of risk factors associated with diabetes (like obesity). Present study was focused on determining usefulness of conveniently measured obesity indices as noninvasive, cost effective, user friendly and early screening method for the prediction of hyperglycemia.
In the present study, total 188 apparently healthy adults (135 males and 53 females) were assessed and their BMI was measured for generalized obesity, and WC and WHtR were measured for central obesity. In this study, it was found that percentage of obese subjects was higher than previously reported studies in Indian population indicating that obesity is comparatively more prevalent in Varanasi, UP, India.[9] Among three measured obesity indices WHtR criteria marked most subjects as obese, followed by WC and BMI criteria [Table 2]. This pattern has also been reported previously in Indian population.[9]
RCBG level was found significantly correlated with WC in females and WHtR in total subjects, but not with BMI [Table 1]. Earlier studies in Indian population have reported variable results, some have found no correlation between blood glucose levels and obesity indices,[9,17] while others have reported significant positive correlations.[14,20]
WC is a measure of abdominal adiposity.[10,12] It has been previously found to be significantly higher in Type II diabetic males, positively correlated with Type II diabetes status,[12] and the best predictor for Type II diabetes.[12,21] In the present study, WC is found significantly and positively correlated with RCBG when observed in females and total subjects [Table 1]. Significant positive correlation of fasting blood sugar with WC, and association of diabetes with high WC has already been reported in some previous studies in population of Pune city, India.[14,20] The analysis of ROC curve [Figure 1 and Table 3] revealed that WC is a significant predictor of hyperglycemia in females with a cutoff level of ≥93.5 cm at 83.30% and 66% sensitivity and specificity, respectively. WC cutoff in males for high RCBG was ≥83.50 cm (at sensitivity 100% and specificity 29.4%), although the cutoff reported in one previous study on Indian diabetic males was ≥102.75 cm (at 65% and 75% sensitivity and specificity, respectively).[12] The relatively higher WC cutoff for females might indicate that males are at greater risk of hyperglycemia even at the lower WC values, possibly due to gender specific physiology.
| Test parameters | Area under curve | Standard error | P value | 95% Confidence interval | Cutoff | Sensitivity, specificity | |
|---|---|---|---|---|---|---|---|
| Lower bound | Upper bound | ||||||
| Males (RCBG ≥140 mg/dl) | |||||||
| BMI (kg/m2) | 0.587 | 0.061 | 0.260 | 0.467 | 0.707 | 22.63 | 0.938, 0.345 |
| WC (cm) | 0.639 | 0.060 | 0.071 | 0.523 | 0.756 | 83.5 cm | 1, 0.294 |
| WHtR | 0.694 | 0.049 | 0.012 | 0.597 | 0.791 | 0.536 | 1, 0.496 |
| Females (RCBG ≥140 mg/dl) | |||||||
| BMI(kg/m2) | 0.700 | 0.081 | 0.113 | 0.542 | 0.858 | 24.34 | 0.833, 0.617 |
| WC (cm) | 0.755 | 0.124 | 0.043 | 0.513 | 0.998 | 93.50 | 0.833, 0.660 |
| WHtR | 0.755 | 0.112 | 0.043 | 0.537 | 0.974 | 0.596 | 0.833, 0.660 |
RCBG: Random capillary blood glucose, BMI: Body mass index, WC: Waist circumference, WHtR: Waist-height ratio
WHtR is also an indicator of visceral fat, and subjects having WHtR ≥ 0.5 had been reported to have strongly associated with cardiovascular disease.[10,11] WHtR is suggested to be a useful screening tool for people with high risk of diabetes[11,22] and insulin resistance with maximum AUC value (0.98) for Homeostatic Model Assessment of Insulin Resistance.[23] In our study, WHtR was significantly higher in females and was positively correlated with RCBG levels in total population [Table 1]. On further analysis by ROC curve [Figure 1], WHtR was found to be a significant classifier for hyperglycemia in both males and females [Table 3]. Cutoffs of WHtR for high RCBG were found to be ≥0.536 (at sensitivity 100% and specificity 49.6%) for males and ≥0.596 (at sensitivity 83.3% and specificity 66.0%) for females [Table 3].
Comparing all three measured obesity indices, we found that WHtR was best predictor for hyperglycemia in both males and females, followed by WC and BMI. WHtR had been reported to be better parameters than BMI alone, even for prediction of DM related complications and early health risks associated with central obesity.[10,11,24] Cutoffs of BMI indicating hyperglycemia in subjects of this study were found to be below (≥22.63 kg/m2 in males and ≥24.34 kg/m2 in females) value which are currently considered as normal according to existing criteria of BMI wise obesity classification for Indian population, indicating that even having normal range BMI, adult subjects can have hyperglycemia.
WC cutoff for hyperglycemia risk in males (83.5 cm) also came within criteria considered normal, but very high (93.5 cm) for females. Cutoffs of WHtR for both males (0.536) and females (0.596) were found higher than already set cutoff (0.5) for high WHtR, indicating that WHtR higher than these cutoffs can be taken as alarming sign for risk of hyperglycemia in both males and females.
The current findings thus support the notion that central or abdominal obesity is associated with risk for hyperglycemia, more than generalized obesity.[25] The measure of general adiposity which is BMI,[11,12] showed no significant correlation with RCBG, nor was the best classifier for hyperglycemia, while measures of central obesity (WC and WHtR) showed significant association with RCBG and were better in predicting high RCBG status in the study subjects. WHtR proved to be best index to classify obesity and to screen and predict high blood glucose levels, as also reported earlier.[13]
Strength of study was that RCBG levels, along with indices for generalized and central obesity were assessed and extensive analysis was performed to find associations and cutoff values to predict hyperglycemia as a non-invasive and convenient method. Small sample size and regional distribution of sample population (Varanasi, UP) are the limitations of this study. Although, this is first study of its kind in this region of India. However, the study is cross-sectional type, thus causal relationship between the risk factors and the occurrence of disease could not be established.
CONCLUSION
WHtR was found to be the best obecity index to predict hyperglycemia. WHtR measurement can be used as a cost effective, simple and non invasive method for screening and prediction of hyperglycemia. Subjects having higher values of WHtR than provided cutoff values can be suggested to undergo blood glucose level tests for confirmation of hyperglycemia.
Acknowledgment
The authors are thankful to Prof. S. P. Mishra, Head, Department of Biochemistry, IMS, BHU, for providing Glucometers for free RCBG level estimation of the study subjects.
Declaration of patient consent
The authors certify that they have obtained all appropriate patient consent.
Financial support and sponsorship
Nil.
Conflicts of interest
There are no conflicts of interest.
References
- Obesity-related non-communicable diseases: South Asians vs white caucasians. Int J Obes. 2011;35:167-87.
- [CrossRef] [PubMed] [Google Scholar]
- Temporal change in profile of association between diabetes, obesity, and age of onset in Urban India: A brief report and review of literature. Indian J Endocrinol Metab. 2018;22:429-32.
- [CrossRef] [PubMed] [Google Scholar]
- Epidemiology of diabetes mellitus in young population in rural districts of Northern Bihar. J Indian Med Assoc. 2013;111:103-6.
- [Google Scholar]
- Diabetes self-care in primary health facilities in India-challenges and the way forward. World J Diabetes. 2019;10:341-9.
- [CrossRef] [PubMed] [Google Scholar]
- How should one tackle prediabetes in India? Indian J Med Res. 2018;148:675-6.
- [CrossRef] [PubMed] [Google Scholar]
- Prevalence of diagnosed and undiagnosed diabetes and hypertension in India--results from the screening India's twin epidemic (SITE) study. Diabetes Technol Ther. 2012;14:8-15.
- [CrossRef] [PubMed] [Google Scholar]
- Correlation between body mass index, waist hip ratio, blood sugar levels and blood pressure in apparently healthy adult Nigerians. IOSR J Dent Med Sci. 2014;13:56-61.
- [CrossRef] [Google Scholar]
- Obesity indices comparison and its correlation with random blood sugar and blood pressure in adults in rural field practice area of a medical college. Int J Community Med Public Health. 2016;3:2555-60.
- [CrossRef] [Google Scholar]
- Waist-to-height ratio as an indicator of early health risk: Simpler and more predictive than using a matrix based on BMI and waist circumference. BMJ Open. 2016;6:e010159.
- [CrossRef] [PubMed] [Google Scholar]
- A systematic review of waist-to-height ratio as a screening tool for the prediction of cardiovascular disease and diabetes: 0.5 could be a suitable global boundary value. Nutr Res Rev. 2010;23:247-69.
- [CrossRef] [PubMed] [Google Scholar]
- Cardiorespiratory fitness and heart rate recovery in Type-II diabetic males: The effect of adiposity. Indian J Physiol Pharmacol. 2016;60:260-7.
- [Google Scholar]
- Waist-to-height ratio is a better screening tool than waist circumference and BMI for adult cardiometabolic risk factors: Systematic review and meta-analysis. Obes Rev. 2012;13:275-86.
- [CrossRef] [PubMed] [Google Scholar]
- Correlation of blood sugar with waist circumference and body mass index in an Indian population. Global J Pharmacol. 2012;6:8-11.
- [Google Scholar]
- Prevalence and risk factors of diabetes in a community-based study in North India: The Chandigarh urban diabetes study (CUDS) Diabetes Metab. 2011;37:216-21.
- [CrossRef] [PubMed] [Google Scholar]
- Prevalence and risk factors of diabetes in a large community-based study in North India: Results from a STEPS survey in Punjab, India. Diabetol Metab Syndr. 2017;9:8.
- [CrossRef] [PubMed] [Google Scholar]
- Is the association between glucose level and all causes and cardiovascular mortality risk, dependent on body mass index? Med J IR I. 1991;6:205-12.
- [Google Scholar]
- Relationship between casual blood sugar and body mass index in a suburban Northern Nigerian population: A short communication. Niger J Med. 2007;16:77-8.
- [CrossRef] [PubMed] [Google Scholar]
- Risk factor of Type 2 diabetes mellitus among adolescents from rural area of India. J Family Med Prim Care. 2017;6:600-4.
- [CrossRef] [PubMed] [Google Scholar]
- Prevalence of Type-2 diabetes mellitus and associated risk factors in an urban slum of Pune city, India. Natl J Med Res. 2013;1:6.
- [Google Scholar]
- Comparison of abdominal adiposity and overall obesity in predicting risk of Type 2 diabetes among men. Am J Clin Nutr. 2005;81:555-63.
- [CrossRef] [PubMed] [Google Scholar]
- Association of waist-height ratio with diabetes risk: A 4-year longitudinal retrospective study. Endocrinol Metab. 2016;31:127-33.
- [CrossRef] [PubMed] [Google Scholar]
- Evaluation of waist-to-height ratio as a predictor of insulin resistance in non-diabetic obese individuals. A cross-sectional study. Sao Paulo Med J. 2017;135:462-8.
- [CrossRef] [PubMed] [Google Scholar]
- The use of anthropometric measurements of obesity in prediction of microvascular complications in obese Type 2 diabetic patients. Acta Clin Croat. 2016;55:217-23.
- [CrossRef] [PubMed] [Google Scholar]
- Obesity, Diabetes, and Physical Activity In: in Physiology of Sport and Exercise. Champaign, IL: Human Kinetics; 2012. p. :546-70.
- [Google Scholar]


