
Translate this page into:
Association between modified ankle-brachial pressure index and indices of adiposity
*Corresponding author: Kumar Sarvottam, Department of Physiology, Institute of Medical Sciences, Banaras Hindu University, Varanasi, Uttar Pradesh, India. kumarsarvo@gmail.com
-
Received: ,
Accepted: ,
How to cite this article: Ranjan P, Sarvottam K, Yadav U. Association between modified ankle-brachial pressure index and indices of adiposity. Indian J Physiol Pharmacol 2021;65(1):21-7.
Abstract
Objectives:
Obesity is one of the important risk factors for peripheral arterial disease (PAD). Ankle-brachial pressure index (ABPI) is a non-invasive test, which may be used for earlier detection of PAD. ABPI in healthy obese/overweight subjects has not been studied. In present study, we investigated correlation of adiposity indices with ABPI. We have also compared ABPI by three different methods in healthy obese/overweight subjects.
Materials and Methods:
Weight, height, body mass index (BMI), waist circumference, hip circumference (HC), waist height ratio, waist hip ratio, skin fold thickness, and body fat percentage were measured in 45 healthy overweight/obese males. Ankle and brachial pressures were measured by Doppler ultrasound based method. ABPI was calculated using high ankle pressure (ABPI-HIGH), mean ankle pressure (ABPI-MEAN), and low ankle pressure (ABPI-LOW) methods.
Results:
BMI and HC show positive significant correlation with ABPI-LOW (P = 0.028, P = 0.046, respectively). Significant difference was observed between ABPI-LOW and ABPI-HIGH (P = 0.003). ABPI-MEAN and ABPILOW were also significantly different (P < 0.001).
Conclusion:
There is a correlation of obesity indices with ABPI-LOW. ABPI-LOW methods could be more appropriate method and contrastingly HC may have direct correlation with PAD detection by ABPI in apparently healthy obese.
Keywords
Obesity
Ankle-brachial index
Peripheral arterial disease
Modified ankle-brachial pressure index
Anthropometry

INTRODUCTION
Obesity is a global health burden which has taken a proportion of an epidemic.[1] Chronic obesity is considered as an important risk factor for the future development of peripheral artery disease (PAD) with adiposity induced vascular inflammation and endothelial dysfunction being an important mechanism for pathogenesis of PAD. Positive relationship between obesity and PAD has been dependent on obesity indices under considerations,[2] with patients of PAD reported with higher body mass index (BMI), body fat percentage (fat%), waist circumference (WC), or waist hip ratio (WHR).[3] Asian, particularly South Asians have a higher prevalence of vascular diseases, which can be attributed to increased adipocyte size, increased visceral adipose tissue, and higher level of inflammatory mediators.[4] PAD affects some 12–14% of the general population. The prevalence of PAD is age dependent, reaching 10% in people aged over 60 years, and some 20% aged over 75 years.[5,6]
There are various methods for the assessment of PAD that include both invasive and non-invasive methods substantiated with clinical findings, for example, plethysmography, tonoscillography, arteriography, magnetic resonance angiography, digital subtraction angiography (DSA), vascular ultrasound, and Doppler flow measurements.[7,8] Among them, DSA is considered as gold standard test.[8] Ankle-brachial pressure index (ABPI) is a non-invasive test which is a time saving and cost-effective method and Doppler ultrasound based ABPI parallels the invasive test with respect to sensitivity and specificity.[9,10] ABPI may be used for detection of earlier occurrence of PAD. ABPI refers to the ratio of ankle and brachial arterial blood pressure and drop in this ratio suggests an abnormal narrowing of the blood vessels in the arterial conduit between aorta and the ankle.[11] ABPI value 0.91–1.40 is considered normal, decreasing value is suggestive of increase in severity of PAD while ABPI higher than 1.40 specifies incompressible (calcified) artery.[12] Although ABPI is widely used parameter for assessment of vascular occlusion, there has not been a consensus in methods of calculation of the index. These methods are similar in terms of procedure and principles of recording which is based primarily on vascular Doppler ultrasound detection of systolic blood pressure of brachial artery and terminal arteries of lower limb. The difference in methods is primarily based on calculation of ABPI obtained from systolic blood pressure (SBP) of the upper and lower limb. ABPI has been calculated using highest of ankle SBP (ABPI-HIGH), lowest of the ankle SBP (ABPI-LOW) as well as mean of the ankle SBP (ABPI-MEAN) as numerators while denominator remains the highest value of SBP at arm.[13]
Studies have evaluated the relationship between ABPI scores and obesity, but most of these studies have been done either in diabetes mellitus patients or patients suffering from other associated diseases[14] or undergoing treatment for those diseases.[15] There is paucity of literature correlating indices of obesity and ABPI scores in healthy or uncomplicated obesity and no study has investigated correlation of obesity indices and different modified ABPI scores. Hence, in present study, we hypothesized that there is an inverse correlation of anthropometric parameters with ABPI scores obtained by different methods of ABPI calculation in asymptomatic Indian obese/overweight healthy subjects. We have also compared ABPI among different BMI categories of participants.
MATERIALS AND METHODS
Forty-five male overweight/obese subjects (BMI range 23– 34.99 kg/m2) of age range of 18–60 years with no known history of PAD, diabetes, ischemic heart diseases, and chronic inflammatory systemic diseases were included in this cross-sectional study. The subjects screened were primarily the attendants of patients visiting for health checkup in outdoors of the institute. Informed written consent was obtained from all participants before the study. Study was approved by institute ethical committee and ethical standards of Helsinki Declaration were followed while performing all the measurements. All the recordings were done at body composition and vascular physiology laboratory of the department of physiology.
The anthropometric parameters measured were weight, height, WC, hip circumference (HC), waist height ratio (WHtR), Waist hip ratio (WHR), skin fold thickness (SFT), and total fat%. Body weight was measured by digital weighing machine (Omron digital body weight scale HN-283) to the nearest 0.1 kg. Subjects were wearing light clothing with no footwear. Subjects were instructed to stand straight to the foot bar; legs were positioned to each side of digital scale. Self-reported weight was not used in the data. To measure height portable/wall mounted stadiometer (PIPER stature meter – 2 m) with movable head piece was used. Height was measured with precision of 0.1 cm. The calibration of stadiometer was done using standardized measuring rod.[16] The stadiometer was checked once in 2 weeks for any error. BMI was calculated using Quetelet’s formulas.[17] WC was measured at midpoint between lower rib margin and iliac crest by non-stretchable measuring tape (Anthroflex-2 m).[18] WHtR was calculated by dividing WC (cm) by height (cm). HC was measured as the maximal circumference over buttocks. WHR was obtained by dividing WC with HC.[19] SFT was measured precisely from the right side of the body at various sites, namely, triceps, biceps, subscapular, and supra-iliac regions by with the help of skinfold caliper (Slimguide skin fold caliper, C-120 B). At the triceps, SFT was measured on midline of the back of arm and the measurement site was fixed as the mid-point level between acromium process and tip of olecranon process. Biceps SFT was measured over the biceps at the same level as the midpoint for the triceps. Subscapular SFT was measured below the inferior angle of the scapula at an angle of 45° to the spine. Supra-iliac SFT was measured in the mid-axillary line above the iliac crest. SFT chart for age and gender was used for calculation of fat%.[20] ABPI was measured with the help of VERSALAB™ Auto (Diabetic Foot Care India Pvt Ltd, Chennai, India), a device well designed to determine the ankle artery as well as brachial artery pressure. At first subject was made to lie down in supine position. Standard segmental blood pressure cuffs were placed on each arm and on each ankle above malleoli. The arm blood pressures were initially determined. An uni-directional 8 MHz Doppler probe was used to detect a signal in the brachial artery. The Doppler probe is generally inclined at 30–45° with the direction of the artery to have a greater accuracy and a triphasic wave [Figure 1] appeared on the monitor with clear and distinct audible sound. The arm cuff was inflated above systolic pressure at which point the Doppler signal disappears. The cuff was then slowly deflated until the pulse wave reappeared at the systolic pressure of the arm. Each ankle systolic pressure was then determined using Doppler probe over the posterior tibial or dorsalis pedis artery whichever provided the loudest signal.[21] The determination of systolic pressures at ankle and brachial arteries was done 4 times for each patients. For calculation of ABPI by different methods, the denominator was highest of the systolic pressures recorded in brachial artery. The lowest ankle systolic pressure out of four recordings was taken as numerator in ABPI-LOW method while highest ankle pressure was taken in case of ABPI-HIGH. Average of ankle pressures was taken as numerator in ABPI-MEAN method.[13]
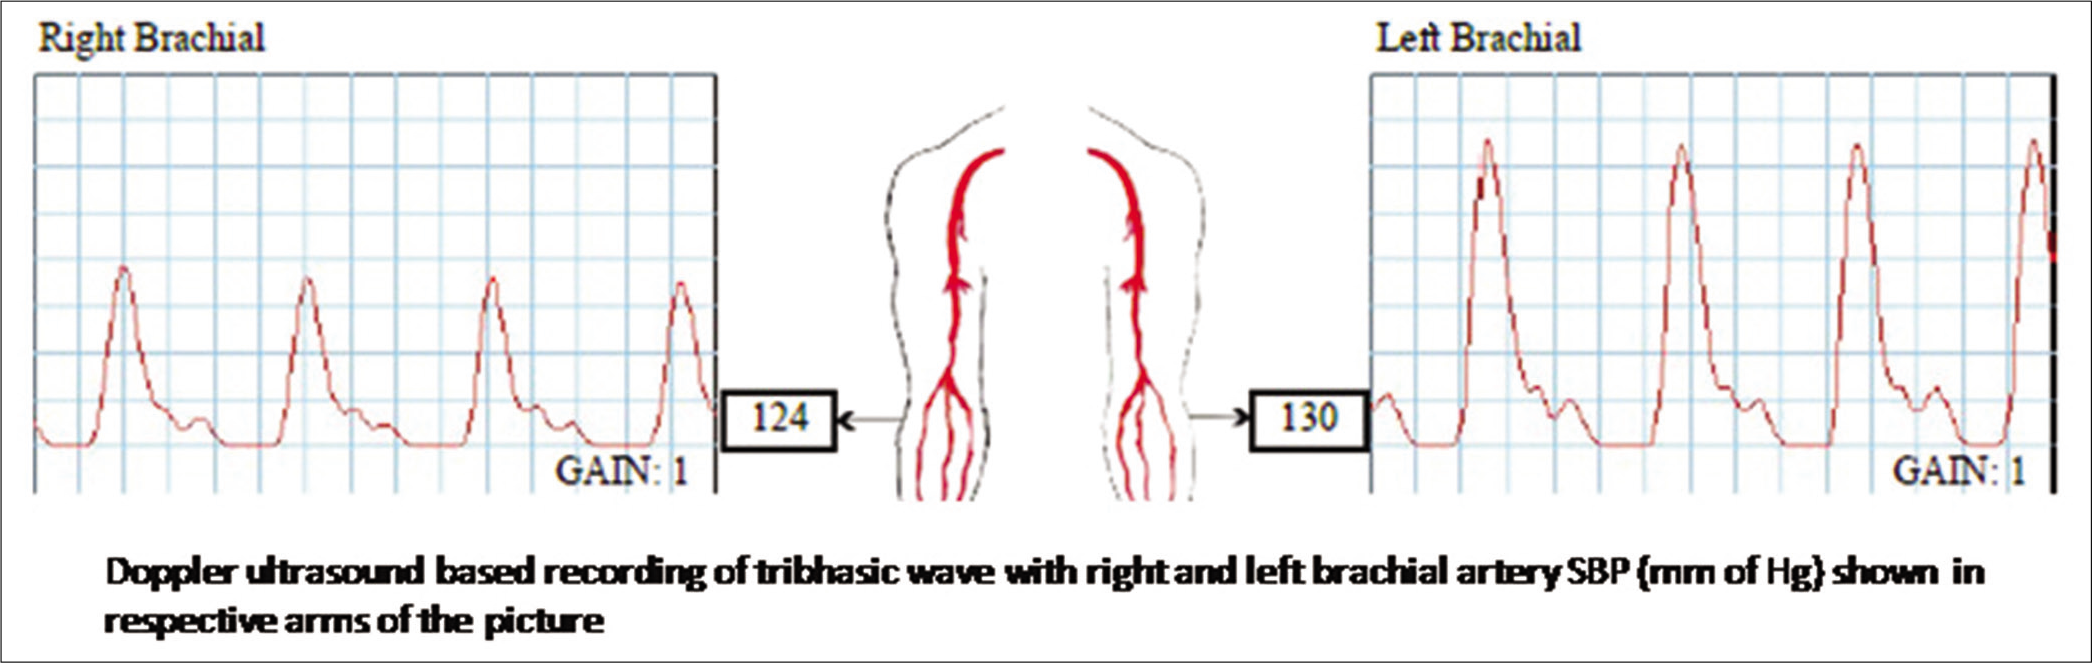
- Representative record of triphasic wave in Doppler ultrasound based ABPI recording.
We explored the correlation of obesity parameters and ABPI of all participants. In addition, to understand the effect of different grades of obesity on ABPI, we compared ABPI scores in four BMI groups. Based on BMI, four groups were formed, namely, Group 1 <24.99 Kg/m2, Group 2 = 25–27.99 Kg/m2, Group 3 = 28–29.99 Kg/m2, and Group 4 above 30 Kg/m2.
Statistical analysis was performed using SPSS 22.0 for windows. Data were checked for normal distribution by Kolmogorov-Smirnov test. Correlation between variables was measured using Pearson’s correlation test. One-way ANOVA with Tukey’s HSD post hoc test was applied to compare ABPI scores among three methods of ABPI calculation. Difference in ABPI among four BMI groups was measured using one way ANOVA. P < 0.05 was considered statistically significant.
RESULTS
Anthropometric parameters and ABPI values of 45 participants (mean age = 34.98 years) are expressed in [Table 1]. The data were normally distributed for all parameters.
| Parameters | Mean±SD |
|---|---|
| Age (years) | 34.98±10.26 |
| Weight (kg) | 78.33±12.23 |
| Height (m) | 1.67±0.05 |
| BMI (kg/m2) | 28.00±3.87 |
| WC (cms) | 95.70±10.35 |
| HC (cms) | 98.18±6.67 |
| TBF% | 27.46±4.30 |
| WHR | 0.97±0.07 |
| WHtR | 0.57±0.06 |
| ABPI-HIGH | 1.03±0.14 |
| ABPI-LOW | 0.87±0.22 |
| ABPI-MEAN | 0.93±0.25 |
Values are expressed in Mean±SD, BMI: Body mass index, WC: Waist circumference, HC: Hip circumference, fat%-total body fat, WHR: Waist hip ratio, WHtR: Waist height ratio, ABPI: Ankle-brachial pressure index
Pearson’s correlation test was applied to check the correlation between parameters and linear regression equations yielded highest correlation coefficient. To check whether obesity of subjects was due to fat% and central obesity, correlation of BMI and other anthropometric parameters was performed. BMI had significant direct correlation with WC, HC, fat%, WHR, and WHtR [Table 2].
| WC | HC | Fat% | WHR | WHtR | |
|---|---|---|---|---|---|
| BMI | |||||
| r | 0.801 | 0.776 | 0.503 | 0.400 | 0.776 |
| P | <0.001 | <0.001 | <0.001 | 0.006 | <0.001 |
Test used Pearson’s correlation test, BMI: Body mass index, WC: Waist circumference, HC: Hip circumference, fat%: Total body fat, WHR: Waist hip ratio, WHtR: Waist height ratio
Correlation between obesity indices and ABPI was performed. BMI and HC had significant positive correlation with ABPI-LOW. No other obesity parameters correlated significantly with ABPI [Table 3].
| ABPI-HIGH | ABPI-LOW | ABPI-MEAN | |
|---|---|---|---|
| BMI | |||
| r | −0.211 | −0.329* | −0.284 |
| P | 0.163 | 0.028 | 0.059 |
| WC | |||
| r | −0.250 | −0.259 | −0.291 |
| P | 0.098 | 0.085 | 0.053 |
| HC | |||
| r | 0.279 | 0.299* | 0.271 |
| P | 0.063 | 0.046 | 0.072 |
| Fat % | |||
| r | −0.136 | −0.205 | −0.255 |
| P | 0.373 | 0.177 | 0.090 |
| WHR | |||
| r | −0.087 | −0.077 | −0.141 |
| P | 0.569 | 0.617 | 0.354 |
| WHtR | |||
| r | −0.179 | −0.217 | −0.256 |
| P | 0.241 | 0.151 | 0.089 |
Test used-Pearson’s correlation test, BMI: Body mass index, WC: Waist circumference, HC: Hip circumference, fat%-total body fat, WHR: Waist hip ratio, WHtR: Waist height ratio, ABPI: Ankle-brachial pressure index, *Represents P<0.05.
Four BMI groups were compared for anthropometric parameters and ABPI scores. Significant differences were observed for weight, WC, HC, fat%, and WHtR. No significant differences were observed among ABPI scores [Table 4].
| Mean±SD | P-value | ||||
|---|---|---|---|---|---|
| BMI≤24.99 | BMI (25.00–27.99) | BMI (28.00–29.99) | BMI (>30) | ||
| ABPI-HIGH | 1.153±0.105 | 1.030±0.138 | 1.144±0.189 | 1.032±0.284 | 0.264 |
| ABPI-LOW | 0.956±0.135 | 0.889±0.243 | 0.895±0.215 | 0.745±0.292 | 0.192 |
| ABPI-MEAN | 1.078±0.092 | 1.013±0.138 | 1.061±0.130 | 0.955±0.209 | 0.216 |
Test used One-way ANOVA, BMI: Body mass index, ABPI: Ankle-brachial pressure index
Comparisons of ABPI observed by three methods were done using one-way ANOVA and post hoc Tukey’ HSD test. There were significant difference among three groups (F = 10.839, P < 0.001). Significant difference was observed between ABPI-LOW and ABPI-HIGH methods as well as between ABPI-LOW and ABPI-MEAN methods [Table 5].
| (I) | (J) | Mean Difference (I-J) | P-value | 95% Confidence Interval | |
|---|---|---|---|---|---|
| Lower Bound | Upper Bound | ||||
| L | H | 0.221 | 0.000 | 0.126 | 0.315 |
| M | 0.072 | 0.171 | -0.022 | 0.166 | |
| H | M | -0.149 | 0.001 | -0.242 | -0.055 |
Test used one-way ANOVA with post hoc Tukey’s HSD, L-ABPI LOW, H-ABPI-HIGH, M-ABPI: Mean, ABPI: Ankle-brachial pressure index
DISCUSSION
Obesity is an established and independent risk factor of atherogenesis, it also contribute in pathogenesis of it by association of elevated blood pressure, dyslipidemia, hyperglycemia, or reduced insulin sensitivity and by upregulation various inflammatory cytokines and other biomolecules.[22] Chronic elevation of these inflammatory mediators leads to cardiovascular morbidity and mortality including notably coronary and PADs.[23] Early detection of PAD is essential in obese/overweight individuals by best available noninvasive techniques. In current study, we utilized ABPI as such a tool to detect PAD and correlated it with obesity indices. We also compared different methods of ABPI scores for the aforementioned objective. BMI was found to correlate with different measures of obesity. Indices of obesity correlated with ABPI Scores, method based differences in ABPI scores were observed with superiority of ABPI-LOW (modified) method over ABPI-MEAN and ABPI-HIGH methods.
In our study, we observed significant positive correlation of BMI with WC, WHR, WHtR, and fat%. In the present study, correlation of BMI with central obesity measures indicates increase in higher BMI was associated with increased fat percentage as evidenced by WC, WHR, WHtR, and fat%. In a study, several common anthropometric measures were moderately to highly and equally correlated with total body fat, CT-measured body fat, and CVD risk factors. The comprehensive analysis done provided evidence of the linkage between simple anthropometric measurements such as BMI, WC, WHR, and the purported pathways between adiposity and health.[24] Our study remains distinctly placed, as we have taken lower cutoffs of obesity as suggested by WHO and ICMR for Indian population.
There was significant negative correlation between BMI and ABPI scores which indicates that increasing BMI may be associated with occurrence of PAD in apparently healthy obese/overweight individuals. Obesity leads to increase in body fat which contribute in vascular inflammation and may leads to atherosclerotic vascular events.[25] Similar findings have been observed in a study performed on 200 subjects to see the adiposity indices and ABPI as cardiovascular risk predictors tool in acute myocardial infarction (AMI) patients. The frequency of patients with lower ABI was significantly higher in AMI group as compared with control. It was concluded that obesity indices were an aggravating factor that disrupted the oxidant antioxidant balance leading to enhanced oxidative stress.[14] In a different prospective cohort study done by a group on 60 subjects had findings of independent association of obesity and adiponectin with severity of PAD measured by ABPI. WC independently predicted the PAD. The occurrence of low ABPI was 4 times higher at higher BMI as compared with the lower BMI.[26] In our study, we got strong positive correlation of BMI with WC and WHtR, indicating the fact that obesity in our study group was primarily abdominal obesity, but correlation of WC and WHtR to ABPI was not found statistically significant though numerical negative correlation was indicative of abdominal obesity induced lower scores of ABPI.
Study done to detect the relationship between abdominal obesity and PAD in HD patients reported that patients with abdominal obesity had lower ABI scores.[15] Obesity and lower ABPI scores are predictor of complexity and severity of CAD.[27] Study focused on weight loss stated that the association of higher BMI with low ABPI in overweight/obese adults with diabetes. However, intensive weight loss interventions did not significantly change the ABPI.[28] Higher BMI has been suggested to be associated with PAD.[29] A study with similar objective as ours has investigated body composition and ABPI in asymptomatic PAD patients and found that BMI more than 30 kg/m2 increased the odds of overall PAD as evidenced by decreased ABPI scores. Although the results of this study were similar with our study in terms of ABPI and BMI relationship in obese/overweight subjects, there were very basic differences with our study in terms of study design, protocol, and methodology. This study was a case–control study while ours was of cross-sectional design. BMI cutoff for obesity was taken more than 30 kg/m2 while we selected subjects with BMI higher than 23 kg/m2 as per Asian standards.[30] The two studies listed below have contrasting results as they have observed higher BMI and WHtR associated with higher ABPI. Study performed to determine clinical phenotype of diabetes having higher ABPI revealed the occurrence of higher BMI and higher WHtR.[31] The prevalence of low ABI is lower in obese as compared to non-obese, while ABI <0.9 significantly associated with all-cause and cardiovascular mortality among non-obese as reported by a study and they concluded that these findings need further research as they question the reliability of using ABI as a marker of PAD or marker of risk in obese individuals. These studies have been done in subjects who were symptomatic with either diabetes or they had cardiovascular diseases (CVDs).[32] The present study was different as we had selected apparently healthy non-diabetics, non-hypertensive subjects with no history of any CVD. All subjects participated in study were asymptomatic for PAD.
The second important result we got in our study was significant correlation of HC with ABPI scores. HC is an important anthropometric parameter for calculation of waist-hip ratio. HC on one side has been considered as positive factor related with decreased disease morbidity of atherosclerotic adverse events. Many evidences exist to show that the fat tissue in the hip has quite different metabolic properties in comparison with fat tissue around the waist and is in fact protective against metabolic disorders such as diabetes and CVD. Higher HC also denotes greater muscle mass.[33] Now, there are recommendations to include HC and WC to be considered jointly for inclusion in CVD risk prediction models and in the assessment of obesity related risk of future deaths.[34] On the other hand, there are evidences to suggest that there is no protective role of HC against vascular diseases in men. A large HC seems to have independent and positive effects on CVD and CHD morbidity and mortality in women, but no protective effect on cardiovascular health in men as evidenced in a study done to relate HC and cardiovascular morbidity and mortality in men and women.[35] In Chinese women, greater mass in the lower trunk region was inversely associated with incident high triglycerides, low HDL-C, and multiple metabolic abnormalities when adjusted for general and central adiposity. This association was not detected in men.[36]
HC has been found to be an important predictor of plasma CRP as it is found to correlate directly in overweight and obese Taiwanese women.[37] This study create an insight to the fact that our study population was male subjects so it is likely to have inverse correlation of HC to ABPI-LOW. Our population of study was Indian male obese individuals which relates with demographic differences in pathogenesis of PAD.
We have compared ABPI values obtained from three methods in our study participants. ABPI values of three methods were significantly different. ABPI-LOW appears to be most sensitive method among them with its mean value <0.9 which was significantly lesser than ABPI-MEAN and ABPI-HIGH. Results in our study go in similar line of previously made observations “ABPI-LOW is the superior method of calculating ABPI to identify PAD as it has better specificity and sensitivity in detecting PAD.”[38] Our study stands out from this study as our subjects were asymptomatic apparently healthy obese/overweight individuals of minimum BMI cutoffs greater than 23 kg/m2. Hence, there is need of modifying the existing method of calculating the ABI and using the low ankle pressure as the numerator. The ABPI-LOW, by having a higher sensitivity, may result in early initiation of risk factor modification and primary intervention strategies in patients of PAD. In addition, secondary prevention interventions for future cardiovascular events might be initiated in these patients apparently missed by the ABPI-HIGH. Non-inclusion of control non-obese subjects remains one of the limitations of the study. Addition of toe-brachial index or post-exercise ABPI measurement along with resting ABPI[39] and comparison with gold standard test in asymptomatic obese/overweight subjects would have given more insight to the study observations.
CONCLUSION
There is a correlation of obesity indices with ABPI-LOW. ABPI-LOW methods could be more appropriate method and contrastingly HC may have direct correlation with PAD detection by ABPI in apparently healthy obese.
Declaration of patient consent
The authors certify that they have obtained all appropriate patient consent.
Financial support and sponsorship
Banaras Hindu University faculty start up grant.
Conflicts of interest
There are no conflicts of interest.
References
- The Asia-Pacific Perspective: Redefining Obesity and Its Treatment (2nd ed). Sydney, Australia: Health Communications Australia Pvt. Limited; 2000.
- [Google Scholar]
- Obesity and peripheral arterial disease: A Mendelian randomization analysis. Atherosclerosis. 2016;247:218-24.
- [CrossRef] [PubMed] [Google Scholar]
- Relationship of obesity distribution and peripheral arterial occlusive disease in elderly men. Int J Obes Relat Metab Disord. 2001;25:1068-70.
- [CrossRef] [PubMed] [Google Scholar]
- Adipocytokines: Mediators linking adipose tissue, inflammation and immunity. Nat Rev Immunol. 2006;6:772-83.
- [CrossRef] [PubMed] [Google Scholar]
- Primary prevention of ischemic stroke: A guideline from the American heart association/American stroke association stroke council: Cosponsored by the atherosclerotic peripheral vascular disease interdisciplinary working group; cardiovascular nursing council; clinical cardiology council; nutrition, physical activity, and metabolism council; and the quality of care and outcomes research interdisciplinary working group: The American academy of neurology affirms the value of this guideline. Stroke. 2006;37:1583-633.
- [CrossRef] [Google Scholar]
- Relationship between sociodemographic, anthropometric and biochemical characteristics and degree of peripheral arterial disease. Srp Arh Celok Lek. 2010;138:584-9.
- [CrossRef] [PubMed] [Google Scholar]
- Methods for the investigation of peripheral blood flow. Br Med Bull. 1963;19:101-9.
- [CrossRef] [PubMed] [Google Scholar]
- The utility of digital subtraction arteriography in peripheral vascular disease. Cardiovasc Intervent Radiol. 1983;6:241-9.
- [CrossRef] [PubMed] [Google Scholar]
- Lower limb colour flow imaging: A comparison with ankle: Brachial measurements and angiography. Clin Radiol. 1993;47:91-5.
- [CrossRef] [Google Scholar]
- The validity, reliability, reproducibility and extended utility of ankle to brachial pressure index in current vascular surgical practice. Eur J Vasc Endovasc Surg. 2005;29:443-51.
- [CrossRef] [PubMed] [Google Scholar]
- Ankle brachial pressure index (ABPI): An update for practitioners. Vasc Health Risk Manag. 2009;5:833-41.
- [CrossRef] [PubMed] [Google Scholar]
- Peripheral arterial disease in people with diabetes. Diabetes Care. 2003;26:3333-41.
- [CrossRef] [PubMed] [Google Scholar]
- Different methods of calculating ankle-brachial index in mid-elderly men and women: The Brazilian longitudinal study of adult health (ELSA-Brasil) Braz J Med Biol Res. 2016;49:e5734.
- [CrossRef] [PubMed] [Google Scholar]
- Adiposity indices and ankle brachial index as cardiovascular risk prediction tool in acute myocardial infarction. React Oxyg Species. 2017;4:351-61.
- [CrossRef] [Google Scholar]
- Abdominal obesity is associated with peripheral artery disease in hemodialysis patients. PLoS One. 2013;8:e67555.
- [CrossRef] [PubMed] [Google Scholar]
- Anthropometric measures and nutritional status in a healthy elderly population. BMC Public Health. 2007;7:2.
- [CrossRef] [PubMed] [Google Scholar]
- Body mass index: Obesity, BMI, and health: A critical review. Nutr Today. 2015;50:117-28.
- [CrossRef] [PubMed] [Google Scholar]
- Measurement of waist circumference: Midabdominal or iliac crest? Diabetes Care. 2013;36:1660-6.
- [CrossRef] [PubMed] [Google Scholar]
- Comparison of body mass index (BMI), body adiposity index (BAI), waist circumference (WC), waist-to-hip ratio (WHR) and waist-to-height ratio (WHtR) as predictors of cardiovascular disease risk factors in an adult population in Singapore. PLoS One. 2015;10:e0122985.
- [CrossRef] [PubMed] [Google Scholar]
- Body fat assessed from total body density and its estimation from skinfold thickness: Measurements on 481 men and women aged from 16 to 72 years. Br J Nutr. 1974;32:77-97.
- [CrossRef] [PubMed] [Google Scholar]
- Hand-held Doppler assessment for peripheral arterial disease. J Wound Care. 1996;5:125-8.
- [CrossRef] [PubMed] [Google Scholar]
- Adipokines as a novel link between obesity and atherosclerosis. World J Diabetes. 2014;5:357-63.
- [CrossRef] [PubMed] [Google Scholar]
- C-reactive protein, interleukin-6, and soluble adhesion molecules as predictors of progressive peripheral atherosclerosis in the general population: Edinburgh artery study. Circulation. 2005;112:976-83.
- [CrossRef] [PubMed] [Google Scholar]
- Association between body mass index, waist-to-height ratio and adiposity in children: A systematic review and meta-analysis. Nutrients. 2016;8:512.
- [CrossRef] [PubMed] [Google Scholar]
- Obesity-related inflammation and cardiovascular disease: Efficacy of a yoga-based lifestyle intervention. Indian J Med Res. 2014;139:822-34.
- [Google Scholar]
- Association of obesity and metabolic syndrome with the severity and outcome of intermittent claudication. J Vasc Surg. 2007;45:40-6.
- [CrossRef] [PubMed] [Google Scholar]
- Analysis of ankle-brachial index, waist-hip ratio, ejection-fraction, obesity, smoking, alcohol habits, diabetes and hypertension as independent predictors of complexity and severity of coronary artery disease. Int J Clin Med. 2015;6:838-44.
- [CrossRef] [Google Scholar]
- Impact of weight loss on ankle-brachial index and interartery blood pressures. Obesity (Silver Spring). 2014;22:1032-41.
- [CrossRef] [PubMed] [Google Scholar]
- Obesity indices and peripheral artery disease measured by ankle brachial index in Nigerian out-patients. West Afr J Med. 2018;35:3-8.
- [Google Scholar]
- Body composition and ankle-brachial index in Ghanaians with asymptomatic peripheral arterial disease in a tertiary hospital. BMC Obes. 2016;3:27.
- [CrossRef] [PubMed] [Google Scholar]
- A high ankle-brachial index is associated with obesity and low serum 25-hydroxyvitamin D in patients with diabetes. J Clin Transl Endocrinol. 2018;11:7-10.
- [CrossRef] [PubMed] [Google Scholar]
- Ankle-brachial index and inter-artery blood pressure differences as predictors of cognitive function in overweight and obese older adults with diabetes: Results from the action for health in diabetes movement and memory study. HHS Public Access. 2017;30:39-46.
- [Google Scholar]
- The influence of hip circumference on the relationship between abdominal obesity and mortality. Int J Epidemiol. 2012;41:484-94.
- [CrossRef] [PubMed] [Google Scholar]
- Hip circumference and cardiovascular morbidity and mortality in men and women. Obes Res. 2004;12:482-7.
- [CrossRef] [PubMed] [Google Scholar]
- Hip circumference and incident metabolic risk factors in Chinese men and women: The people's republic of China study. Metab Syndr Relat Disord. 2011;9:55-62.
- [CrossRef] [PubMed] [Google Scholar]
- Hip circumference is an important predictor of plasma C-reactive protein levels in overweight and obese Taiwanese women. Taiwan J Obstet Gynecol. 2006;45:215-20.
- [CrossRef] [Google Scholar]
- A modified calculation of ankle-brachial pressure index is far more sensitive in the detection of peripheral arterial disease. J Vasc Surg. 2006;44:531-6.
- [CrossRef] [PubMed] [Google Scholar]
- Diagnostic utility of the two methods of ankle brachial index in the detection of peripheral arterial disease of lower extremities. Catheter Cardiovasc Interv. 2006;68:788-92.
- [CrossRef] [PubMed] [Google Scholar]
- Hide and seek: Does the toe-brachial index allow for earlier recognition of peripheral arterial disease in diabetic patients? Eur J Vasc Endovasc Surg. 2015;49:192-8.
- [CrossRef] [PubMed] [Google Scholar]


