
Translate this page into:
Blood pressure variability from intra-arterial pressure recordings in humans
 , Naveen Gangadharan2,#, Bowya Baskaran1, S. Baskaran3, Subramani Kandasamy3, Syrpailyne Wankhar4, Suresh Devasahayam2, Sathya Subramani1
*Corresponding author: Sathya Subramani, Department of Physiology, Christian Medical College Vellore, Vellore, Tamil Nadu, India. sathya@cmcvellore.ac.in
-
Received: ,
Accepted: ,
How to cite this article: Mukadam FA, Gangadharan N, Baskaran B, Baskaran S, Kandasamy S, Wankhar S, et al. Blood pressure variability from intra-arterial pressure recordings in humans. Indian J Physiol Pharmacol 2023;67:181-90.
Abstract
Objectives:
The study presents the magnitude of variation of systolic and diastolic pressures over a few minutes from intra-arterial pressure recordings in 51 hemodynamically stable patients in an intensive care unit.
Materials and Methods:
Conscious surgical ICU patients, with arterial pressure cannulae placed as the standard of care, were recruited after obtaining informed consent. A validated data acquisition system was used to record intra-arterial blood pressure for a period of 10 minutes following a Fast-Flush test. Only those recordings with acceptable dynamic characteristics as per Gardner’s criteria were included in the analysis.
Results:
Three categories of systolic and diastolic pressure variability namely “beat-to-beat” variability, “Respiratory” variability, and “Total magnitude of variation” during the duration of recording, were reported for each of the 51 patients. The mean (± SD) of the total magnitude of variation for systolic and diastolic pressures in the study sample were 21 ± 9 mmHg and 14 ± 5 mmHg respectively.
Conclusion:
Given the magnitude of systolic and diastolic pressure variations over a few minutes, the validity of reporting single- point values for these pressures and using single-point cut-offs for diagnosis and treatment of hypertension must be re-evaluated.
Keywords
Blood pressure variability
Fast-flush test
Natural frequency
Damping coefficient
Hypertension

INTRODUCTION
Blood pressure (BP) and its measurement are of vital importance in clinical evaluation of cardiovascular status. The two most popular non-invasive methods of estimation of BP are the manual method based on Korotkoff sounds and the automated method based on cuff pressure oscillations. Both these methods report single-point values for systolic and diastolic pressures.[1] However, it is common knowledge that systolic (SBP) and diastolic (DBP) BPs vary at multiple frequencies, a phenomenon termed as BP variability (BPV). The wavelengths of the variations are of the order of seconds to minutes (very short-term BPV), hours (24-h BPV and short-term BPV), weeks (mid-term BPV) or even seasons (long-term BPV).[2] In fact, no two consecutive pressure cycles have the same SBP and DBP and the concept of beat-to-beat variability is well established.[3-5] Such variations in SBP and DBP can be appreciated best in an intra-arterial recording using a fluid-filled catheter connected to a pressure transducer, which being a direct measurement of the pressure in the artery may be considered the gold standard for BP measurements,[6] provided that care is taken to avoid measurement errors due to air bubbles, blood clots and compliance of the tube in the catheter system.[7]
Intra-arterial BP is an invasive method, and it is not possible to perform measurements with invasive techniques in routine clinical practice. There are non-invasive methods which claim to provide real-time arterial pressure measurements. These methods are the volume-clamp method using a finger cuff and radial artery applanation tonometry. Some of these techniques and their decidedly limited usefulness have been documented.[8-10]
Given the variability of SBP and DBP, the usefulness and credibility of making single-point estimates of the two pressures with the non-invasive methods used in routine clinical practice need re-evaluation.[10-12]
Determining the variability of SBP and DBP is of crucial importance in understanding cardiovascular health. The role of BP variations in target organ damage has been documented extensively.[13-16] Short-term variability in both systolic and diastolic pressures is purported to be an independent risk factor for cardiovascular events or stroke.[17] A recent review[18] states that while the association of BPV with cardiovascular outcomes is widely acknowledged, such association is largely ignored and has limited applications in clinical practice. The review, while stating that the continuous variable BP is not adequately represented by snapshot measurements with the current methods (what we call single-point value for systolic and diastolic pressures), reiterates the success of such snapshot measurements in cardiovascular risk prediction. The review also suggests that cardiovascular risk prediction could be further improved if low-cost and accurate technologies to record BPs including their variability become available. It is also reported that antihypertensive drugs may either augment or reduce the variations in pressure. Atenolol is associated with a higher BPV, and does not reduce the incidence of stroke, even though it reduces mean SBP. The addition of diuretics and calcium channel blockers to atenolol helps in reducing the risk of stroke and such reduction in stroke incidence is associated with a reduction in BPV.[17,18] Anglo-Scandinavian Cardiac Outcomes Trial (ASCOT trial) reports amlodipine to be better at lowering BPV as compared to atenolol.[18]
This study reports the amplitude and nature of variations in SBP and DBP over a period of few minutes from intra-arterial recordings made in humans. Currently published information about the actual magnitude of BP variation is limited and several published reports show poorly controlled dynamic characteristics of the fluid-filled catheter pressure measurement system making their data of limited value. Most studies have considered only ambulatory BPV.[19,20] Unless the pressure measurement system has a sufficient frequency bandwidth and appropriate damping, the measured waveform can be significantly erroneous. The present study ensures the accuracy of the reported magnitude of variability in different pressure parameters.
It is desirable to have normative data for BPV for various categories of the population.[21-23] As a first step, we have recorded intra-arterial BP data from 51 patients in a surgical intensive care unit. The objective was to document the degree of variability, even though it is not a normal/control population, to illuminate the approximation in current noninvasive methods in routine clinical practice that report a single-point value for SBP and DBP, which is at best reported from the average of static BP readings, which themselves need not cover the whole range of variability.[18]
MATERIALS AND METHODS
The ethical and research aspects of this study were approved by the Institutional Review Board. The study group consisted of conscious post-operative patients in the surgical intensive care unit, aged between 18 and 92 years, who underwent elective or emergency surgical procedures. They were haemodynamically stable for a minimum of 2 h, off inotropes and vasopressors, and were ready to be discharged to the ward. They were not in pain, not agitated and not on any form of assisted ventilation or supplementary oxygen. All patients had arterial pressure cannulae placed as standard of care and the recordings were made after obtaining informed consent, just before removing the arterial cannulae, after which they were discharged to the ward.
The transducer by design is positioned between the intra-arterial catheter and a pressurised fluid reservoir containing sterile perfusion fluid at pressures of about 300–400 mmHg. The pressure at the transducer would be a value between the pressure in the artery and the pressure in the reservoir. The resistance between the reservoir and the transducer is much higher than the resistance between the intra-arterial catheter and the transducer. Therefore, the pressure at the transducer is closer to the intra-arterial pressure and exceeds it by a negligible amount. Nevertheless, the slight excess in pressure ensures that blood does not enter the transducer.
The pressure transducer output was connected to a data acquisition system (CMCdaq, a validated data recorder) and data were acquired at a sampling frequency of 1 KHz. The pressure transducer was positioned at the level of intersection of the 4th intercostal space with the mid-axillary line (phlebostatic axis) and the three-way valve was opened to air for zeroing with respect to atmospheric pressure. The three-way valve was then switched to connect the transducer to the intra-arterial catheter and recording was begun.
Gardner[24] recommends that the natural frequency and damping coefficient of the pressure recording system be reported in all cases where the accuracy of systolic pressure measurement is critical. These two parameters were assessed with a fast-flush test where a high-pressure pulse is applied to the transducer (with a pull of the fast-flush valve provided in the disposable pressure transducer, opening it to the high-pressure bag), followed by a quick release, allowing the catheter–transducer system to oscillate at its natural frequency on termination of the applied high-pressure plateau. The natural frequency (ωn) and the damping coefficient (ζ) of the system were calculated from the oscillating waves at the end of the pressure pulse [Figure 1].
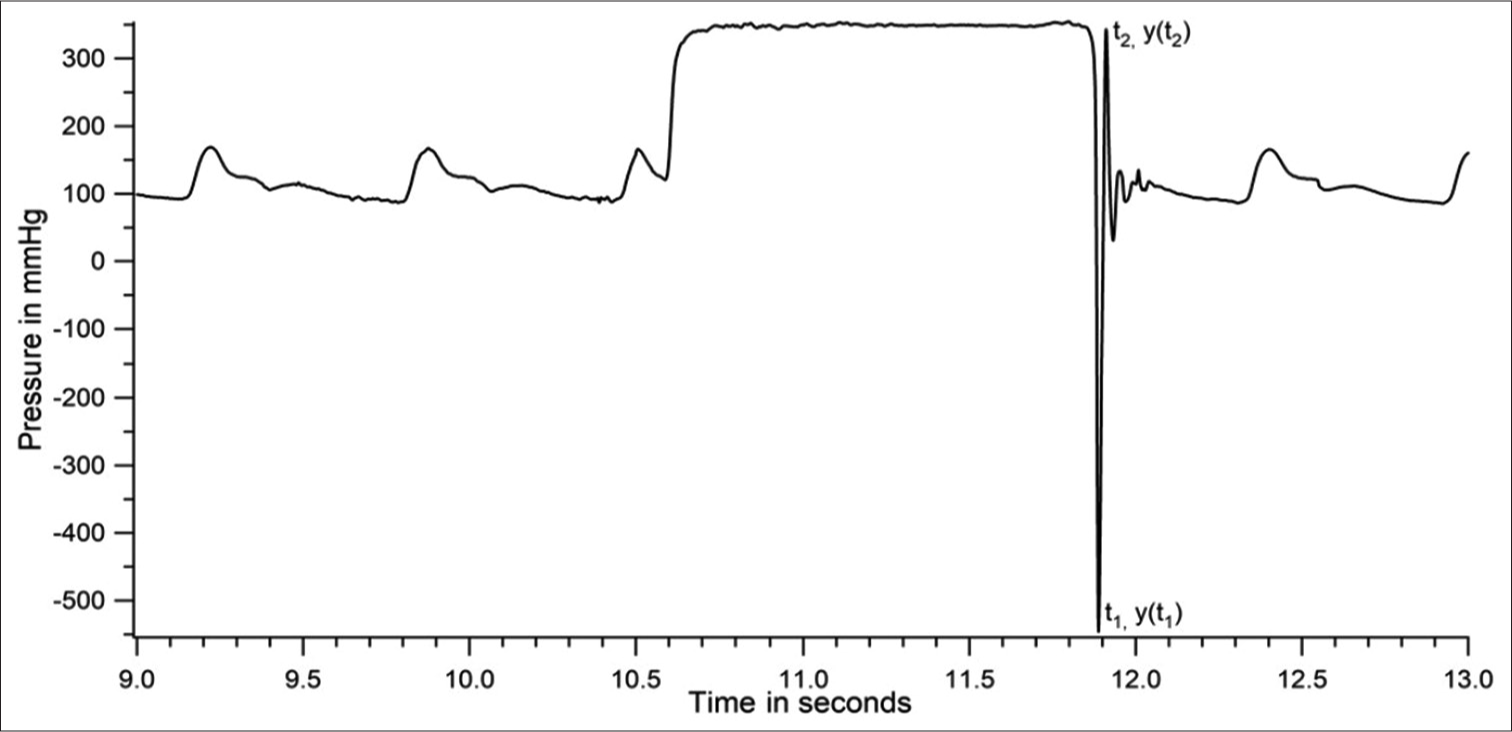
- Dynamic response of catheter–transducer system during a fast-flush test in a patient.
Gardner[24] reports combinations of the two parameters (ωn and ζ) which are adequate for accurate pressure recording in the form of a plot [Figure 2]. The inner shaded area in [Figure 2] defines the boundaries for heart rates of about 118 beats/min (bpm) and the outer envelope defines the boundaries for a heart rate of 95 bpm.
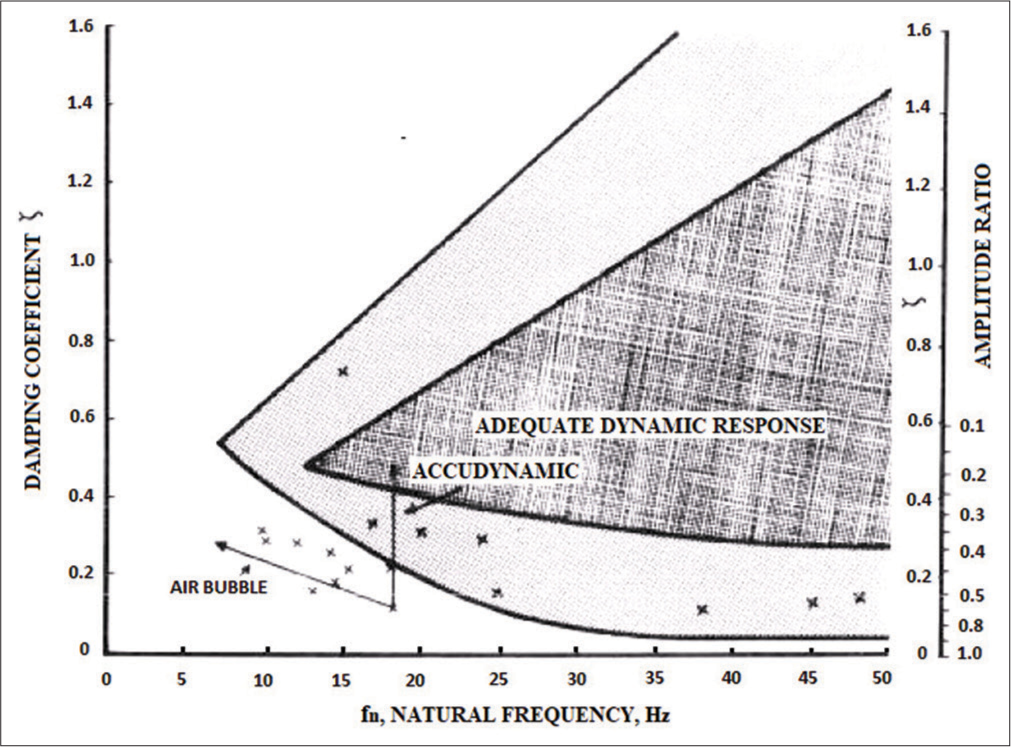
- Boundary conditions for determining the adequacy of the dynamic characteristics of the catheter–transducer system -reproduced with permission from Gardner, 1981.
From the above discussion, the higher the heart rate, the higher should be the natural frequency of the catheter– transducer system and narrower the range of acceptable damping coefficients. For want of better assessment of the adequacy of the dynamic response of the catheter system, we have obtained the two parameters for every patient recording, plotted them against each other and overlaid them on the Gardner’s plot which is the currently followed standard [Figure 3]. An improved method of using the two parameters for ensuring the accuracy of the catheter–transducer system was published by our team after this study was completed.[7]
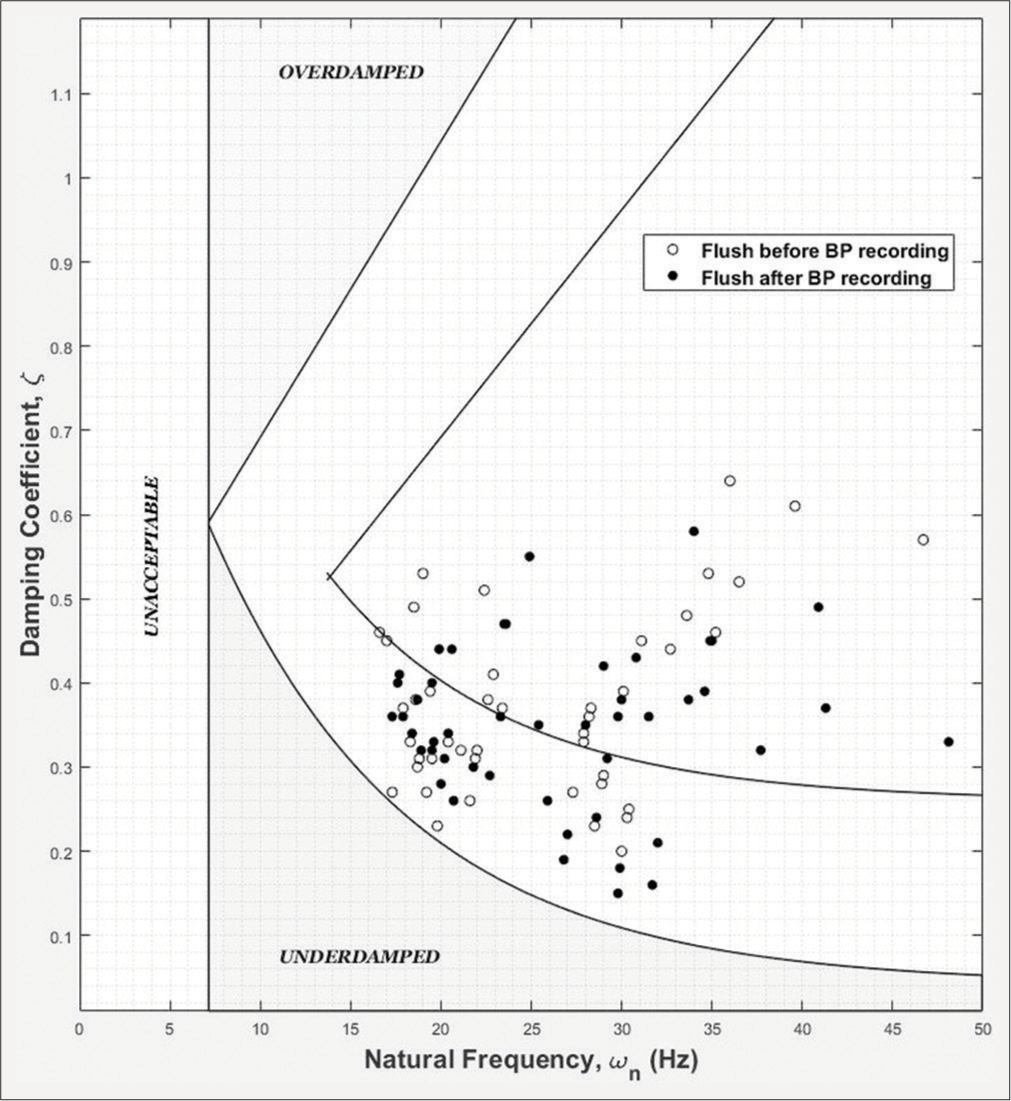
- Plot of natural frequency versus damping coefficient for flush test data from 51 patients superimposed over the reference Gardner’s plot.
The natural frequency of the recording system and the damping coefficient were calculated as described below.[25] The time and amplitude of at least two extrema (minimum and/or maximum) are measured. Assuming that the flush test, or step response, can be approximated by a simple second-order system response, the natural frequency and the damping coefficient were calculated using standard procedures. Briefly stated, the period of oscillation yields the damped frequency of the system, and the rate of decline of the amplitude swing yields the damping coefficient; the damped frequency corrected with the damping coefficient gives the natural frequency of the system. It is assumed in our calculations that the system oscillates around the mean arterial pressure of the pulses around the flush test.[25] The damping coefficient for flush test from each patient was plotted against the natural frequency [Figure 3]. If the point fell within the acceptable boundaries shown in [Figure 3], the patient data were included in the analysis. (The boundary lines of the Gardner’s plot were reproduced for [Figure 3] by superimposition on the original plot.)[24]
RESULTS
Intra-arterial pressure data from 51 recordings with acceptable flush test criteria were analysed. Systolic and diastolic pressures in all individuals varied considerably during the duration of recording. Comprehensive analysis of one dataset is first presented to demonstrate the methodology of analysis. [Figure 4] is the raw data obtained from a patient. [Figure 5] shows a section of [Figure 4], expanded for clarity.
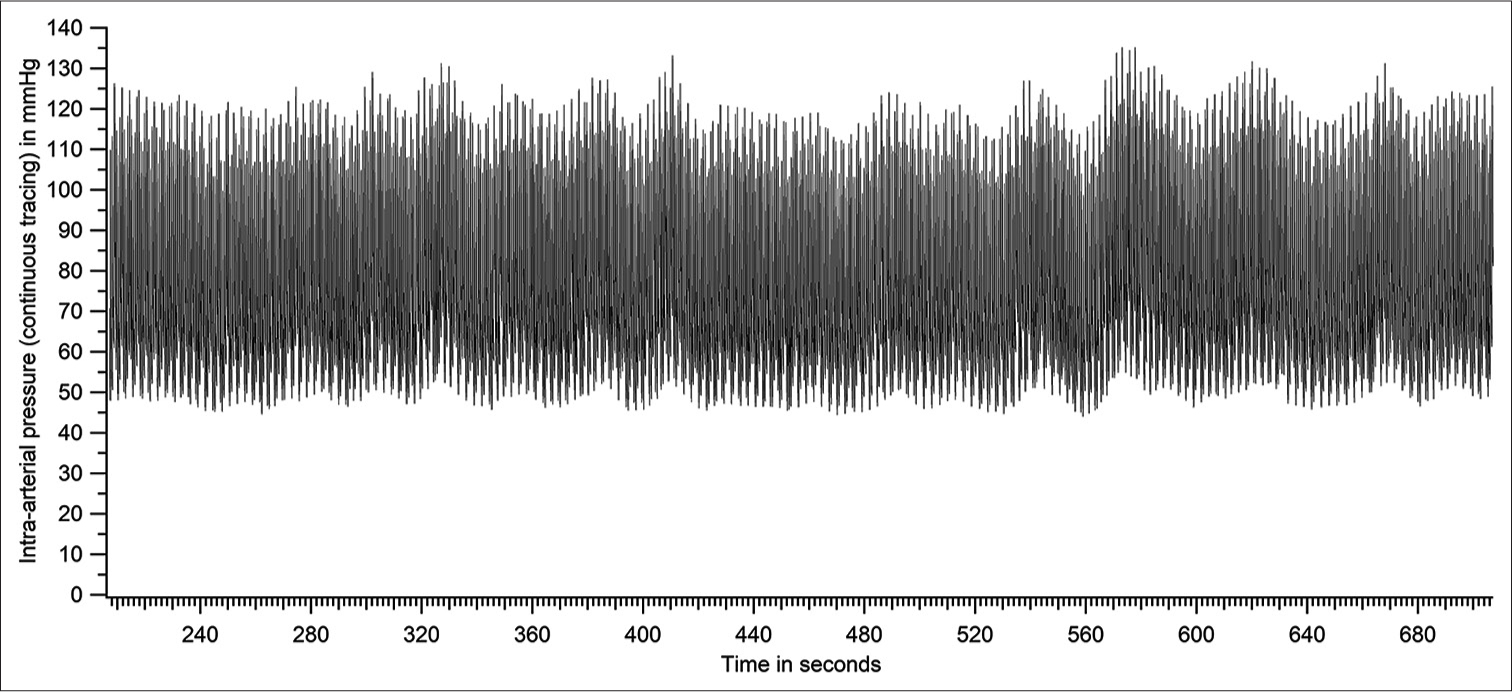
- Raw tracing of intra-arterial pressure - entire recording period (patient number 46 based on Figure 14).
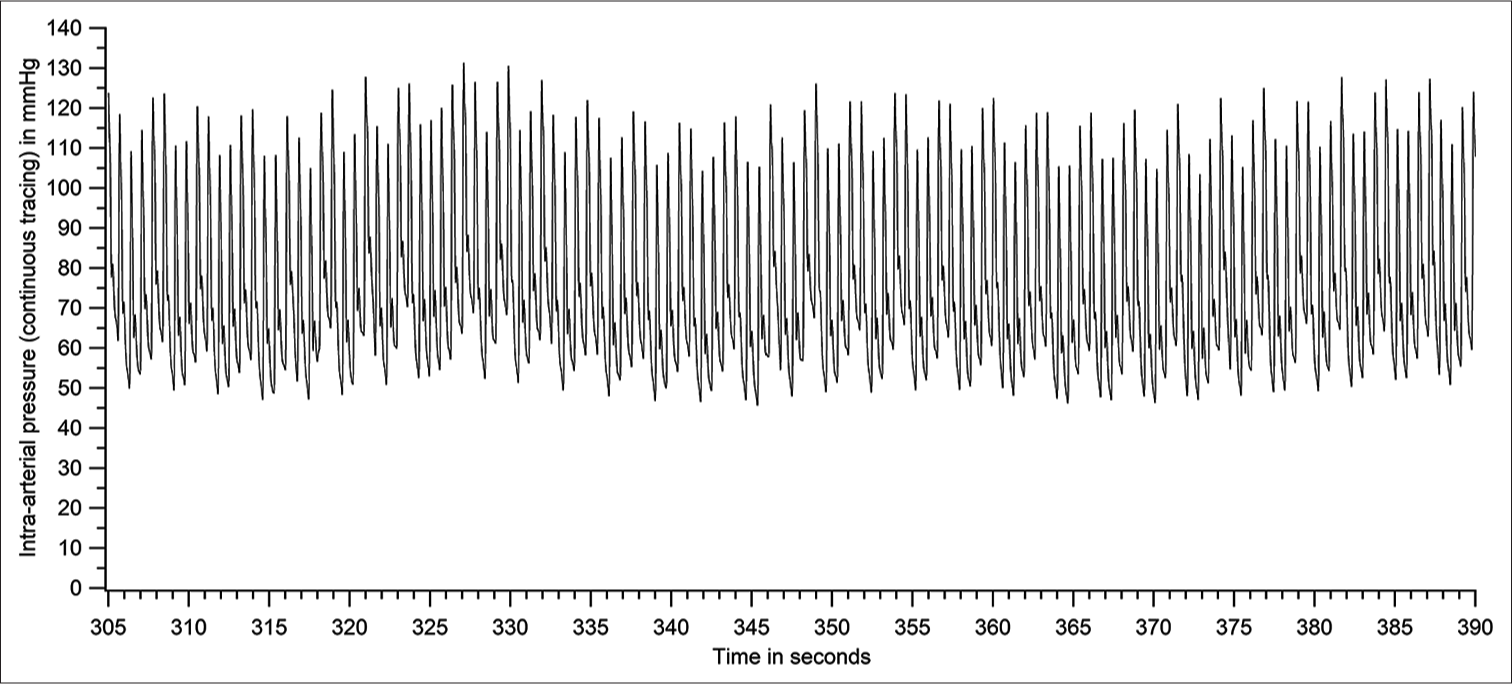
- Raw tracing of intra-arterial pressure - a section of Figure 4 expanded (patient number 46).
The systolic and diastolic pressures vary from beat to beat. The peak (SBP) and trough (DBP) of each pressure cycle were detected using a custom-written programme. [Figure 6] represents the plot of systolic and diastolic pressures of each pressure cycle. [Figure 6] is derived from the raw data of [Figure 4]. The first-order variation in arterial pressure occurs at the heart rate. Two other lower frequencies of variations are known to occur in arterial pressure. One variation close to the respiratory frequency is referred to as Traube waves (second-order variation), and another at a frequency much lower than respiratory frequency (third-order variation) is referred to as Mayer waves. The Traube and Mayer waves are clearly shown in [Figures 6-8].

- Plot of systolic and diastolic pressures of each pressure cycle of the raw tracing in Figure 4 (patient number 46).
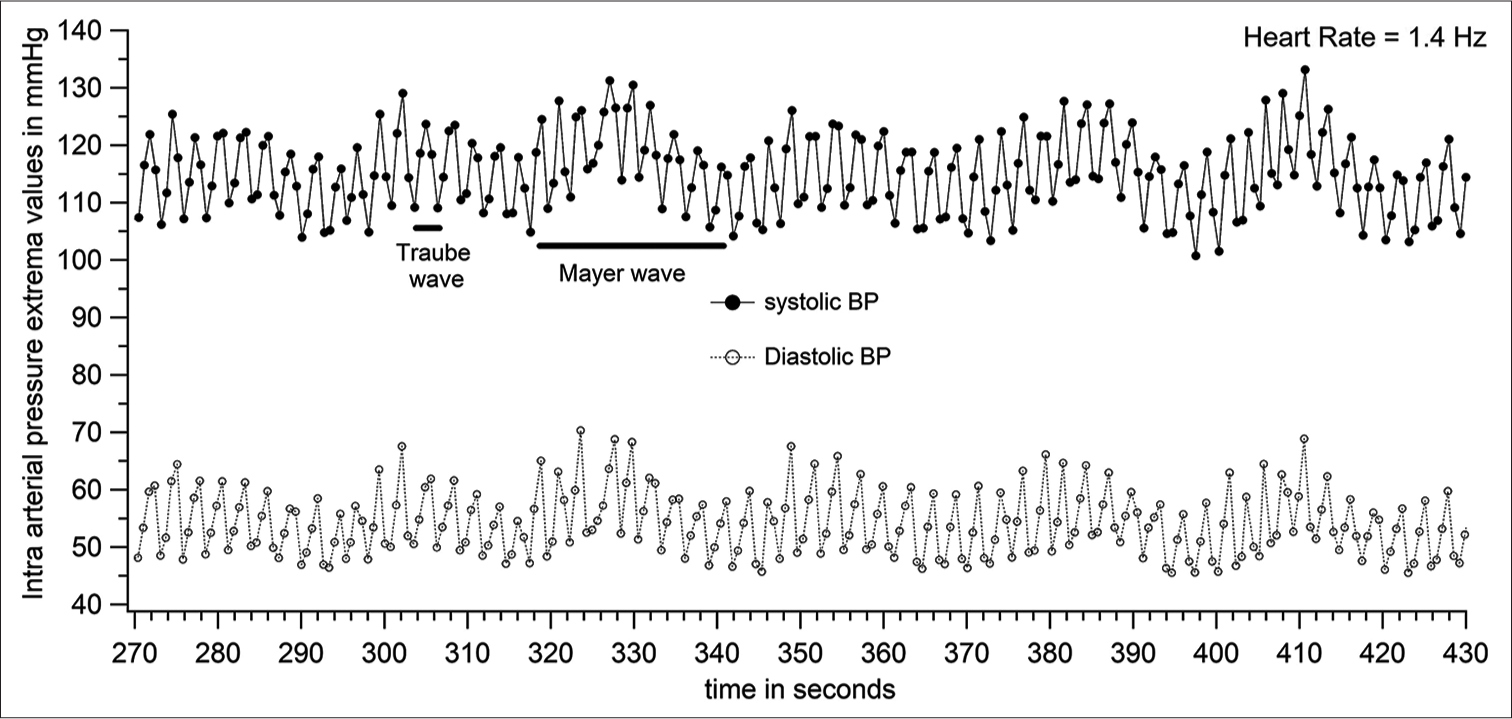
- Systolic and diastolic pressure variations (expanded section from Figure 6) with data points for each pressure cycle shown (patient number 46).
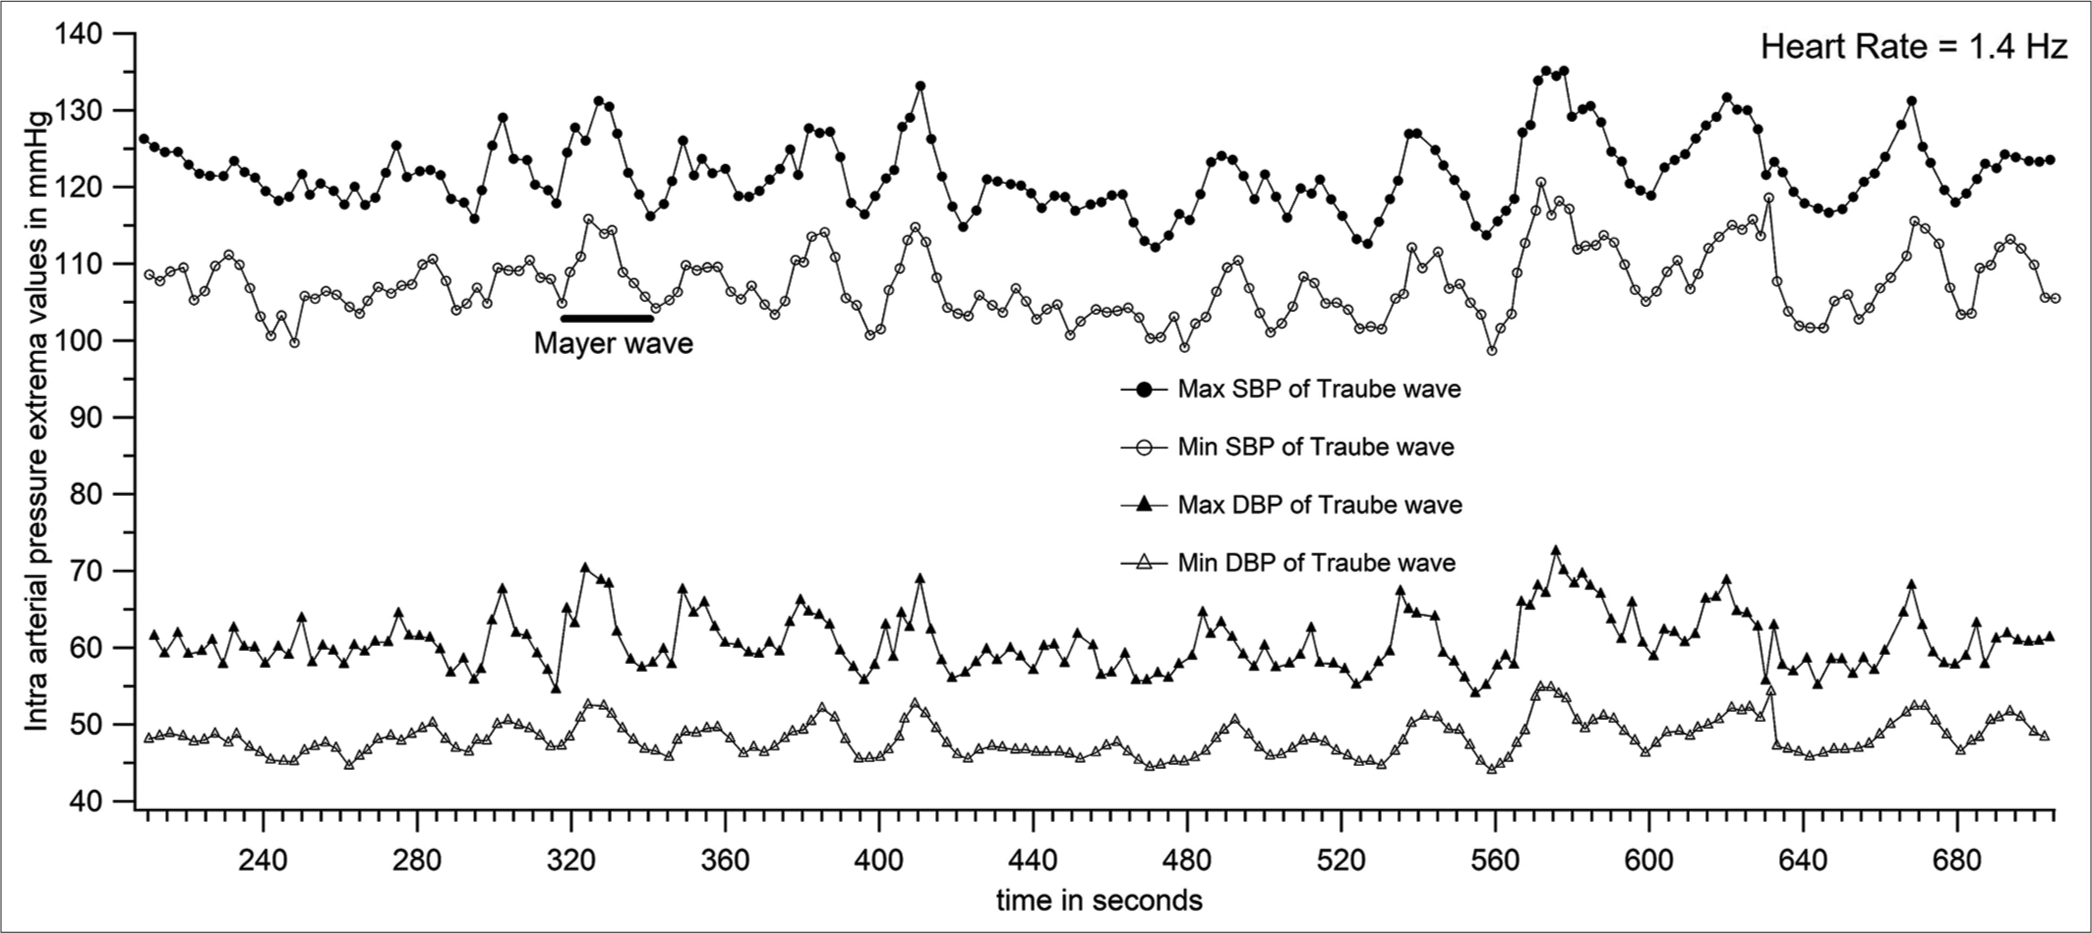
- Peaks and troughs of systolic and diastolic Traube waves (shown in Figures 6 and 7) plotted to get 4 Mayer wave components (patient number 46).
The power spectrum of data in [Figure 4] was calculated with the discrete Fourier transform (using an fast Fourier transform [FFT] algorithm) with a frequency resolution of 0.0076 Hz (about 700 s of data with a sampling rate of 1000 Hz, average of 100 overlapping FFT periodograms, each data block zero padded to 131072 points, Hamming windowed) and is shown in [Figure 9]. The most prominent peaks observed were the one at the heart rate, and higher harmonics of that frequency. Two well-separated peaks below the heart rate were observed in most patients. These are the frequencies corresponding to the Traube and Mayer waves.
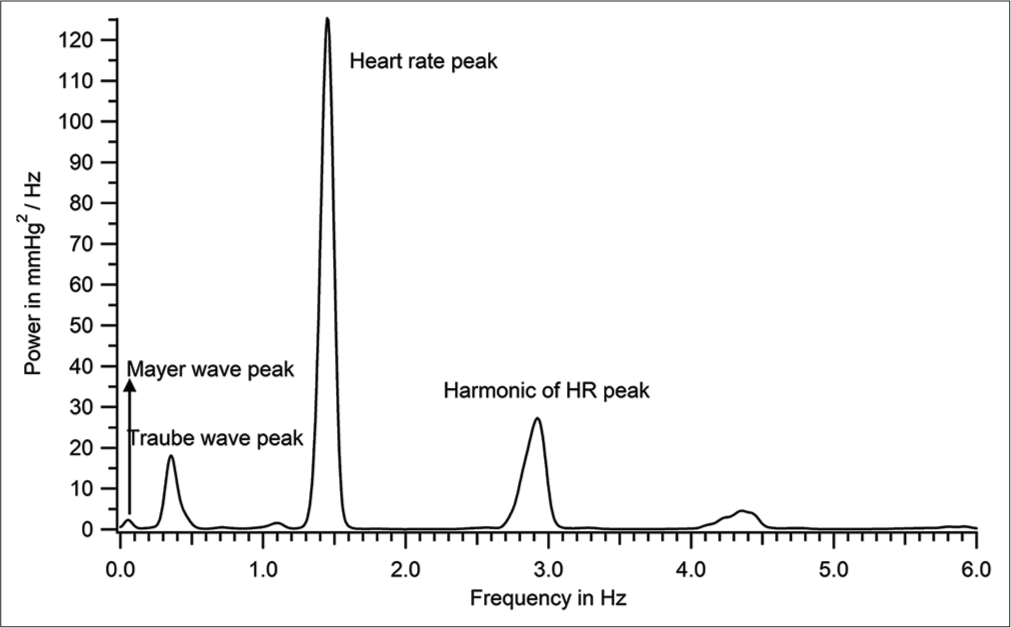
- Power spectrum of the intra-arterial recording shown in Figure 4 (patient number 46).
Criteria for identifying Mayer and Traube waves from discrete Fourier transform (DFT) spectrum: The lowest frequency peak in the DFT spectrum is identified as Mayer wave peak. When there were only two peaks to the left of the heart rate peak in the DFT, the higher one was taken as the Traube wave peak; when there were multiple peaks to the left of the heart rate peak, the one that was closest to the Traube wave frequency calculated by a second method (as inverse of wave period [row 6 of Table 1]) was taken as the Traube wave peak. [Figure 10] is an expansion of [Figure 9] to show clearly the dominant frequency of Traube (0.354 Hz) and Mayer waves (0.054 Hz) for the recording shown in [Figures 4-8].
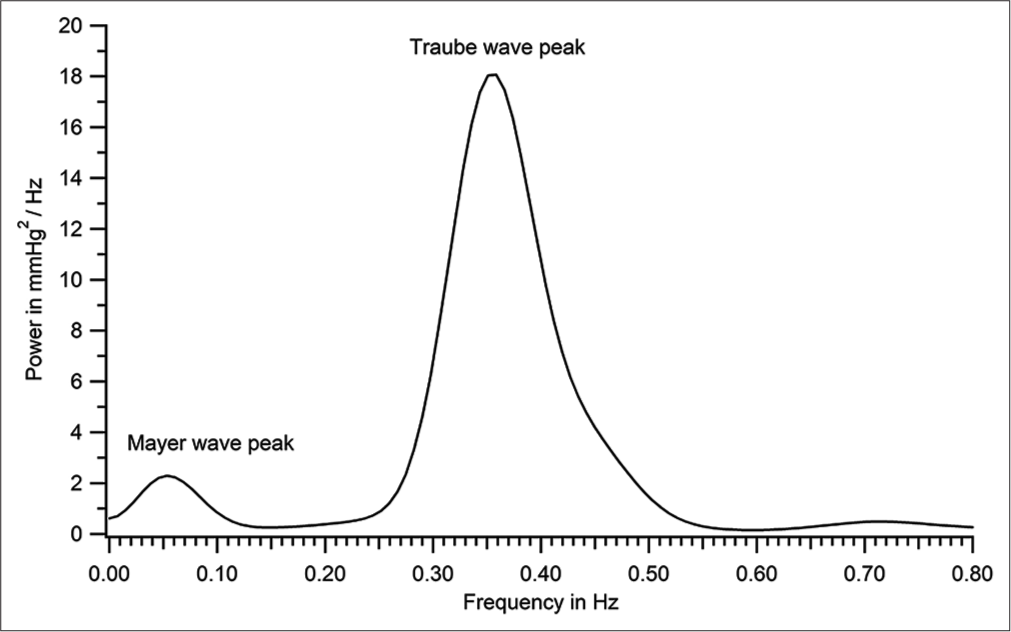
- Power spectrum shown in Figure 9 expanded to demonstrate Mayer wave peak (patient number 46).
| Systolic | Diastolic | |
|---|---|---|
| Mean pressure (mmHg) | 114±7 | 54±6 |
| Beat-to-beat variation (mmHg) | 7±4 | 6±4 |
| Traube wave amplitude (mmHg) | 14.5±2.5 | 13±3 |
| Range of pressure (mmHg) (minimum to maximum) | 100–133 | 45–69 |
| Total variation (mmHg) (difference between maximum and minimum pressures) | 33 | 24 |
| Traube wave frequency (Hz) computed as inverse of wave period | 0.37±0.07 | 0.37±0.07 |
All values given as mean±standard deviation
Average systolic and diastolic pressures
Systolic (or diastolic) pressure from every pressure cycle during the recording period [Figure 4] was averaged to get the mean systolic (or diastolic) pressure in the individual during that period. The standard deviation (SD) of systolic (/diastolic) pressure from the mean was also determined. These data are shown in row 1 of [Table 1].
Beat-to-Beat Variability (BTBV)
BTBV in systolic (or diastolic) pressure was calculated as the difference between two consecutive systolic (or diastolic) pressure values. The values for the whole recording were averaged, and the mean ± SD of BTBV is shown in row 2 of [Table 1].
Amplitude of systolic and diastolic Traube waves
The amplitude of systolic and diastolic Traube waves was computed for every wave shown in [Figure 6] as the difference between peak and trough of the Traube waves (for systolic and diastolic pressures). The amplitude of Traube waves is reported as mean ± SD for the duration of the recording in row 3 of [Table 1]. Traube waves represent the pressure variations entrained to a large extent to the respiratory frequency.[26]
Maximum and minimum systolic and diastolic pressures
Maximum systolic pressure during the recording was determined by averaging 10 highest values of maxima of the systolic Traube waves shown in [Figure 6]. Minimum systolic pressure was similarly determined by averaging 10 lowest values of minima of systolic Traube waves. This was done to avoid overestimations of variation due to a momentary large deflection of pressures. Data for maximum and minimum systolic pressures in the individual are shown in row 4 of [Table 1]. Maximum and minimum diastolic pressures in the individual were also calculated similarly.
Total magnitude of systolic and diastolic pressure variation
Total magnitude of systolic and diastolic pressure variation in the individual is calculated as the difference between maximum and minimum systolic pressures (or diastolic) obtained as just stated before. The total variation in systolic pressure (or diastolic) during the recording period is given in row 5 of [Table 1].
Data in rows 1 and 4 of [Table 1] are presented in [Figure 11]. Data for systolic pressure variability in rows 2, 3 and 5 are presented in [Figure 12] and that for diastolic pressure variability in [Figure 13].
![Mean (± standard deviation), maximum and minimum systolic and diastolic pressures for the tracing shown in Figure 4 (from Table 1 [patient number 46]).](/content/114/2023/67/3/img/IJPP-67-181-g011.png)
- Mean (± standard deviation), maximum and minimum systolic and diastolic pressures for the tracing shown in Figure 4 (from Table 1 [patient number 46]).

- Systolic pressure variability for the recording in Figure 4 (patient number 46).
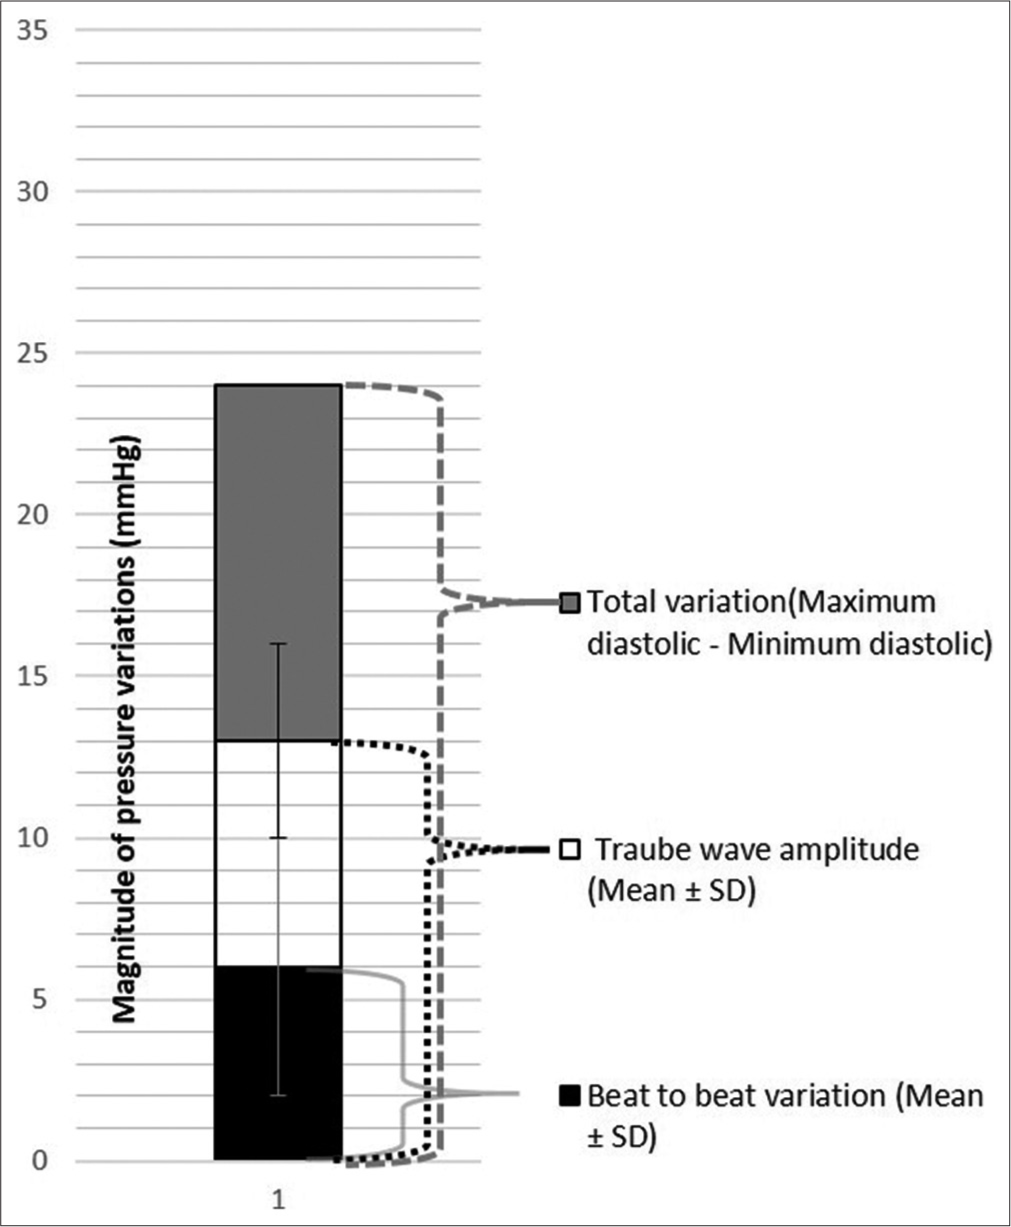
- Diastolic pressure variability for the recording in Figure 4 (patient number 46), SD is Standard Deviation.
Data for the whole sample
Data from all recordings were subjected to analyses as above and the data for all 51 patients are presented in the following sections. The parameters found in [Table 1] (for a single patient) were calculated for all 51 patients. The magnitude of variations in systolic and diastolic pressures [as represented for one patient in Figures 11-13] is shown in [Figure 14] for all 51 patients. Sample means were calculated for all parameters in [Table 1] and the values are given in [Table 2]. The mean value (± SD) for the magnitude of systolic pressure variation in the sample was determined to be 21 ± 9 mmHg and that of diastolic pressure variation as 14 ± 5 mmHg.
![Mean (±Standard Deviation [SD]), minimum and maximum systolic and diastolic pressures of the 51 patients.](/content/114/2023/67/3/img/IJPP-67-181-g014.png)
- Mean (±Standard Deviation [SD]), minimum and maximum systolic and diastolic pressures of the 51 patients.
| Systolic | Diastolic | |
|---|---|---|
| Mean of mean pressure (mmHg) | 130 (23) | 67 (11) |
| Mean beat-to-beat variation (mmHg) | 3 (2) | 2 (1) |
| Mean Traube wave amplitude (mmHg) | 7 (4) | 5 (3) |
| Mean range of pressure (mmHg), i.e. mean minimum pressure to mean maximum pressure | 119 (22)–130 (25) | 60 (11)–74 (12) |
| Mean total variation (mmHg) (mean difference between maximum and minimum pressures) | 21 (9) | 14 (5) |
| Mean Traube wave frequency (Hz) (computed as inverse of wave period) | 0.35 (0.1) | 0.35 (0.1) |
Values for pressures rounded to the nearest whole number. SD: Standard deviation
DISCUSSION
Dynamic characterisation of the catheter–transducer system
The dynamic response of the fluid-filled catheter–transducer system must be sufficiently good to reproduce the pressure waveform with high fidelity and minimal distortion. If the natural frequency of the catheter system overlaps the frequency band of the signal, there will be resonance and undue amplification of the signal at the resonant frequency. Therefore, the catheter system must have a natural frequency much higher than the highest frequency component of the recorded signal.[7]
The other parameter that determines the fidelity of the recorded signal is the damping coefficient. Underdamping can lead to falsely high systolic pressures and resonant ringing of the pressure pulse,[6] while overdamping will conversely lead to diminution of the amplitude, loss of details like the dicrotic notch and to falsely low systolic pressures.
Natural frequency and damping coefficient are not quantified in current clinical practice. Their assessment is qualitative or at best semi-quantitative based on display of the fast-flush test on the monitor. Small changes in natural frequency and damping coefficient can significantly alter waveform, resulting not only in errors in systolic and diastolic pressures but also in timing of systolic peak and dicrotic notch, and these errors will propagate in calculation of other parameters, e.g. pulse transit time. For accuracy of pressure measurement, quantitation of the natural frequency and damping coefficient must become part of routine clinical practice. In this study, we have quantified the said parameters for every patient and have ensured that they are within acceptable limits by plotting on the Gardner’s plot.
Variability of systolic and diastolic pressures
The mean (± SD) for the magnitude of systolic pressure variation in the sample was 21 ± 9 mmHg and that of diastolic pressure variation was 14 ± 5 mmHg. These values are not from a normal population and may not represent normal variability. What we intend to convey is that while the systolic pressure in an individual can vary by as much as 21 mmHg or more during a few minutes, getting a point value for systolic pressure as provided by either the manual method or oscillometric method can lead to misinterpretations about the cardiovascular status of the individual. For instance, in patient 51 of [Figure 14], systolic pressure varies between 145 and 189 mmHg. The current non-invasive methods, if otherwise accurate, will report a single-point value anywhere along this range of 145 mmHg–189 mmHg for this patient.
The latest American and European guidelines for the diagnosis and treatment of hypertension depend on single-point cut-offs for systolic and diastolic pressures.[23,27-29] However, as documented by others and as shown here, systolic and diastolic pressures vary considerably even over a few seconds and a BP report should ideally contain the range of systolic and diastolic pressures in the individual during the recording period. In the study sample, there are 14 patients whose systolic pressure range includes 140 mmHg which is the cut-off for diagnosing hypertension. Single-point estimates of systolic pressure in these individuals will yield values anywhere in the range, i.e. higher than or lower than 140 mmHg (if there are no measurement errors), and probabilistically, the values will differ with every measurement making it difficult to decide whether to treat or not.[19] (It is to be noted that while brachial pressures are used for diagnosis and treatment of hypertension, the values reported here are for the radial artery.)
CONCLUSION
The magnitude of systolic and diastolic pressure variations in a period as short as 10 min is sizeable and therefore it is imperative that methods of assessing the entire range of pressures in an individual are developed for meaningful assessment of cardiovascular status.
Acknowledgements
The authors thank the Department of Biotechnology (DBT), Government of India, for funding the study and the medical and technical personnel at the Institutional Surgical Intensive Care Unit for enabling the blood pressure recordings.
Declaration of patient consent
The authors certify that they have obtained all appropriate patient consent.
Conflicts of interest
There are no conflicts of interest.
Financial support and sponsorship
This study was financially supported by the Department of Biotechnology, Government of India.
References
- The Direct and Indirect Measurement of Blood Pressure United States: Year Book Medical Publishers, Inc.; 1970.
- [Google Scholar]
- Blood pressure variability: Clinical relevance and application. J Clin Hypertens (Greenwich). 2018;20:1133-7.
- [CrossRef] [PubMed] [Google Scholar]
- Beat-to-beat blood pressure variability: An early predictor of disease and cardiovascular risk. J Hypertens. 2021;39:830-45.
- [CrossRef] [PubMed] [Google Scholar]
- Home blood pressure variability and target organ damage. Hypertens Res. 2022;45:543-5.
- [CrossRef] [PubMed] [Google Scholar]
- Association of blood pressure patterns in young adulthood with cardiovascular disease and mortality in middle age. JAMA Cardiol. 2020;5:382-9.
- [CrossRef] [PubMed] [Google Scholar]
- Accuracy of invasive arterial pressure monitoring in cardiovascular patients: An observational study. Crit Care. 2014;18:644.
- [CrossRef] [PubMed] [Google Scholar]
- Intra-arterial blood pressure measurement: Sources of error and solutions. Med Biol Eng Comput. 2022;60:1123-38.
- [CrossRef] [PubMed] [Google Scholar]
- The accuracy of Finapres noninvasive mean arterial pressure measurements in anesthetized patients. Anesthesiology. 1991;74:647-52.
- [CrossRef] [PubMed] [Google Scholar]
- Evaluation of non-invasive blood pressure measurement by the Finapres method at rest and during dynamic exercise in subjects with cardiovascular insufficiency. Clin Auton Res. 1994;4:49-56.
- [CrossRef] [PubMed] [Google Scholar]
- Techniques for non-invasive monitoring of arterial blood pressure. Front Media (Lausanne). 2017;4:231.
- [CrossRef] [PubMed] [Google Scholar]
- Is the blood pressure variability the great forgotten parameter? Hypertens Res. 2021;447:877-8.
- [CrossRef] [PubMed] [Google Scholar]
- The role of blood pressure variability in misdiagnosed clinic hypertension. Hypertens Res. 2011;34:187-92.
- [CrossRef] [PubMed] [Google Scholar]
- Blood pressure variability, target organ damage and antihypertensive treatment. J Hypertens. 2003;21:1827-30.
- [CrossRef] [PubMed] [Google Scholar]
- Awake systolic blood pressure variability correlates with target-organ damage in hypertensive subjects. Hypertension. 2007;50:325-32.
- [CrossRef] [PubMed] [Google Scholar]
- Blood pressure variability and multiple organ damage in primary hypertension. J Hum Hypertens. 2013;27:663-70.
- [CrossRef] [PubMed] [Google Scholar]
- Blood pressure variability: Assessment, prognostic significance and management. J Assoc Physicians India. 2015;63:47-53.
- [Google Scholar]
- Does blood pressure variability modulate cardiovascular risk? Curr Hypertens Rep. 2011;13:177-86.
- [CrossRef] [PubMed] [Google Scholar]
- Blood pressure and its variability: Classic and novel measurement techniques. Nat Rev Cardiol. 2022;19:643-54.
- [CrossRef] [PubMed] [Google Scholar]
- Ambulatory blood pressure monitoring in clinical practice. Indian Heart J. 2019;71:91-7.
- [CrossRef] [PubMed] [Google Scholar]
- Ambulatory blood pressure monitoring in daily practice. Indian Heart J. 2017;69:788-9.
- [CrossRef] [PubMed] [Google Scholar]
- Treatment blood pressure targets for hypertension. Cochrane Database of Syst Rev. 2009;3:CD004349.
- [CrossRef] [PubMed] [Google Scholar]
- 2019 ACC/AHA guideline on the primary prevention of cardiovascular disease: A report of the American college of cardiology/American heart association task force on clinical practice guidelines. Circulation. 2019;140:596-646.
- [CrossRef] [PubMed] [Google Scholar]
- Direct blood pressure measurement--dynamic response requirements. Anesthesiology. 1981;54:227-36.
- [CrossRef] [PubMed] [Google Scholar]
- Signals and Systems in Biomedical Engineering: Physiological Systems Modeling and Signal Processing. In: 3rd ed. Germany: Springer Science and Business Media; 2019. p. :1-468.
- [CrossRef] [Google Scholar]
- Mechanisms contributing to the generation of mayer waves. Front Neurosci. 2020;14:395.
- [CrossRef] [PubMed] [Google Scholar]
- New blood pressure guidelines pose difficult choices for australian physicians. Circ Res. 2019;124:975-7.
- [CrossRef] [PubMed] [Google Scholar]
- Blood pressure target in acute brain injury. Indian J Crit Care Med. 2019;23(Suppl 2):S136-9.
- [CrossRef] [PubMed] [Google Scholar]
- Reliability of emergency department diagnosis in identifying the etiology of nontraumatic undifferentiated hypotension. Indian J Crit Care Med. 2020;24:313-20.
- [CrossRef] [PubMed] [Google Scholar]


