
Translate this page into:
Curative intent chemotherapy-induced alterations in specific qEEG markers of cognition in patients with breast cancer
*Corresponding author: Rajalakshmi Rajasegaran, Department of Physiology, Jawaharlal Institute of Postgraduate Medical Education and Research (JIPMER), Puducherry, India. rajalakshmimd@yahoo.com
-
Received: ,
Accepted: ,
How to cite this article: Samantaray S, Natesan P, Rajasegaran R, Gaur GS, Dubashi B. Curative intent chemotherapy-induced alterations in specific qEEG markers of cognition in patients with breast cancer. Indian J Physiol Pharmacol. 2023;67:296-302. doi: 10.25259/IJPP_465_2022
Abstract
Objectives:
Chemotherapy-induced cognitive impairment is a gruesome outcome of chemotherapy among breast cancer survivors. Electroencephalogram (EEG) power measurement is a known sensitive neurophysiologic correlate of cancer treatment-related cognitive dysfunction. The objective of this study was to assess the changes in specific quantitative EEG markers of cognition among breast cancer patients before, immediately, and three months after chemotherapy.
Materials and Methods:
Twenty-three women planning to undergo adjuvant chemotherapy for breast cancer underwent EEG assessment before, immediately, and three months after chemotherapy. Repeated measures analysis of variance was used to analyse the data. Post hoc pairwise comparison was done with Bonferroni correction to determine the pair in which the difference existed.
Results:
A significant increase in resting state EEG total power was observed (P = 0.012) after chemotherapy in the frontal area. The relative alpha power (RAP) significantly decreased with chemotherapy (P = 0.039), with post hoc pairwise comparison with Bonferroni correction revealing the significant decline to be present immediately after chemotherapy (P = 0.036) only over the posterior channels. Furthermore, the alpha-to-theta ratio (ATR) over posterior areas decreased (P = 0.012) both after completion of chemotherapy (P = 0.039) as well as three months after chemotherapy (P = 0.048). However, similar changes were not observed over frontal areas.
Conclusion:
Chemotherapy induces enhanced frontal power with a coincidental decline in RAP and ATR in the posterior areas.
Keywords
Electroencephalogram
Chemotherapy
Cognition
Relative alpha power
Alpha-to-theta ratio

INTRODUCTION
Post-chemotherapy cognitive impairment (PCCI) is defined as a significant impairment of cognitive faculties among patients and survivors of non-central nervous system (CNS) malignancies (breast cancer, lymphoma, head and neck, colorectal, cervical, and prostatic malignancies) after undergoing chemotherapy, thereby sufficiently impairing their activities of daily living and overall quality of life. Cognitive decline in the form of increased forgetfulness, trouble concentrating and remembering details, and difficulty with multitasking has been reported in these individuals.[1] It has been estimated that around 21–34% of patients undergoing chemotherapy for non-CNS malignancies develop some cognitive impairment.[2] Perturbation in the CNS, rather than peripheral nervous system signalling, has been demonstrated to be pathognomonic of cancer-related fatigue.[3] Moreover, Moore et al. have demonstrated electroencephalogram (EEG) power changes as a marker of cancer-related fatigue and cognitive impairment among breast cancer survivors, further providing supportive evidence for the central origin of the condition.[4]
The cognitive impairment in PCCI is subtle, not amounting to mild cognitive impairment; hence, it often remains undetected in cognitive tasks due to compensatory activation of other neural resources.[5] Multiple structural and functional neuroimaging studies have demonstrated white matter changes and hippocampal volume reduction. However, to date, there is no affordable objective marker of cognitive assessment that could be used to diagnose PCCI patients. All the hormone receptor-positive breast cancer patients additionally receive either tamoxifen or aromatase inhibitor alone or sequentially for 5–10 years. The adverse effect of these medications on cognition has been demonstrated for tamoxifen.[6] However, large-scale randomised controlled trials adequately powered to detect moderate effect size between cognition and aromatase inhibitors have failed to establish any adverse relationship.[7]
Previous studies have reported an increase in resting-state alpha power and a decline in delta and theta power with age-related maturity of the brain.[8] Alpha frequency is significantly correlated with the speed of information processing, as measured by reaction times. The alpha frequency of good memory performers is about 1 Hz higher than age-matched samples of bad memory performers.[9] Similarly, Trammell et al. examined the relationship between cognitive performance and the theta-alpha power ratio (TAR) in healthy young and old adults.[10] The same study found that among older people, with ageing, there is a decrease in alpha power and an increase in theta power. The study suggested that the TAR may reflect the efficiency of neural processing and cognitive reserve. This reflects higher alpha and lower theta, thus a higher alpha-to-theta ratio (ATR) and, intuitively, the RAF as a marker of brain maturity and better cognition. In addition, the EEG of demented subjects with poor cognition is characterised by an increase in power in delta and theta and a decrease in alpha power, which reflects a decrease in ATR and a redistribution of EEG power.[11] The individual alpha peak frequency (IAF): Another EEG marker of cognition,[10] refers to the frequency at which the alpha brain waves peak during an EEG measurement, which can be determined by estimating the discrete frequency value of the alpha band at which the alpha power is maximum.
In this study, EEG was recorded from women with breast cancer undergoing curative intent chemotherapy at 3-time points – once before chemotherapy, after chemotherapy, and three months after chemotherapy. At each time point, resting state EEG was recorded from the patients and analysed for various quantitative EEG (qEEG) parameters – total power, individual alpha peak frequency, relative alpha power (RAP), and ATR – evaluating neural signalling. We proposed these parameters as surrogate resting state EEG markers of cognition and evaluated them prospectively among the above-mentioned study participants. We hypothesise that the objective resting state EEG markers of cognition deteriorate after curative chemotherapy for non-CNS malignancies and improve during recovery.
MATERIALS AND METHODS
This cross-sectional study was conducted between December 2018 and March 2020 in the Department of Physiology at a tertiary medical school in Puducherry, South India. The study was prior reviewed and approved by the Postgraduate Research Monitoring Committee and the Institute Ethics Committee (JIP/IEC/2018/260).
Inclusion criteria
Newly diagnosed women in the age group of 30–60 years with early-stage breast cancer in stage I-III who had undergone mastectomy surgery and planning to receive adjuvant chemotherapy (3 cycles of epirubicin, cyclophosphamide, and 5-florouracil over nine weeks and four cycles of docetaxel over a period of 3 weeks-total duration of 12 weeks) were enrolled for the study [Figure 1].
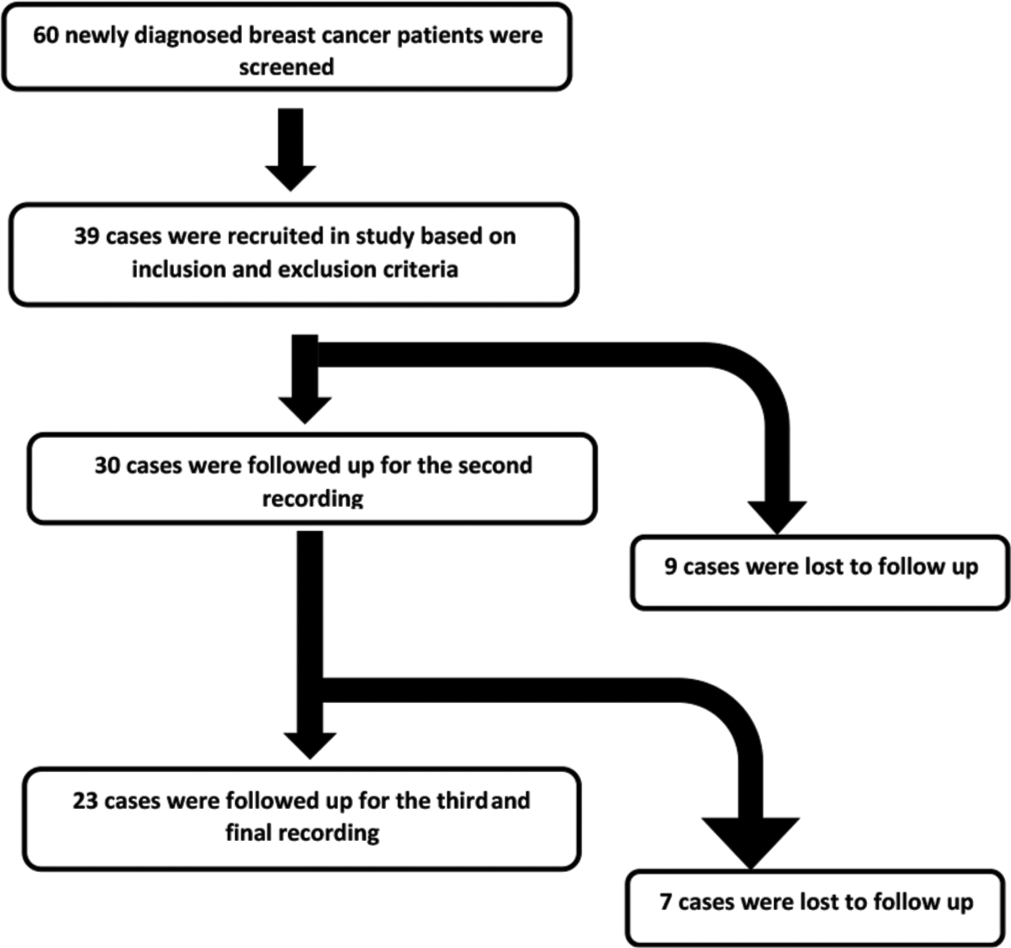
- Workflow of the study depicting the cases screened, recruited and completed the final recording.
Exclusion criteria
Patients with a history of psychiatric disorders (clinical depression, schizophrenia, mania, bipolar disorder, and substance abuse), peripheral neuropathy, stroke, recent brain surgery, brain metastasis, stage-four disease with metastasis elsewhere, pre-existing dementia of any form and motor system disorders involving involuntary movements were excluded from the study.
Sample size
The sample size was calculated to be 35 patients using ‘G power software version 3.1.9.2,’ assuming alpha level = 0.05, power 80%, medium effect size (f) = 0.3 for the variable change in EEG power. The sample size was calculated based on the study by Moore et al., which evaluated change in EEG total power after cognitive tasks in breast cancer chemotherapy patients.[4]
Procedure
Patients were assessed thrice – initial baseline assessment, one week after successful completion of chemotherapy, and three months after the second assessment. Patients were evaluated for any new symptoms mandating their exclusion from the study during each time point. After that, 10 min of resting state, eyes closed. The 19-channel EEG was recorded with the EEG device (Galileo-NT EB Light EEG machine, Italy) using Ag-AgCl electrodes, placed according to the 10– 20 international system. Patients were instructed to remain in an alert, wakefulness state without sleeping. Electrode impedance was kept below five kΩ. The digitised EEG was recorded at a sampling frequency of 512 Hz.
EEG analysis
Preprocessing
The EEG data of each patient were extracted in European data format, the standard data format for storing and sharing the EEG data. The data were imported into EEGLAB. Bad channels were rejected after visual inspection. The data were interpolated using the spherical spline interpolation method built in EEGLAB. The EEG data were filtered to extract 1–40 Hz frequency using a bandpass digital filter. A separate notch digital filter was used to remove 50 Hz line noise along with most of the low-frequency slow drifts in the EEG signal.
Segmentation
The preprocessed data were imported into Brainstorm software, version 2.0, an open-source EEG analysis software that runs on the cross-platform MATLAB environment (The Mathworks, Inc.).
A total of 20 epochs, each of 2-s duration, spanning a total length of 40 s, was selected from the 10 min of eyes closed filtered EEG data for the final analysis. For the sake of uniform sampling, two epochs were selected from every minute of data. Artefact-free segments were selected by visual inspection to select only the data epochs of neural activity. Similarly, segments containing blinks and EEG data involving deglutition, body/head movement, and artefacts were rejected. If at all any selected epoch was detected to contain any artefact, the same epoch was rejected and replaced with another artefact-free one within the same minute window.
Analysis
The average power spectral density was estimated using the Welch method for all the epochs and exported into an Excel file to generate values for each subject. The secondary variables, such as ATR and RAP were calculated in an Excel sheet and exported into SPSS for statistical analysis.
The frequency with the maximum estimate of spectral power in the alpha band was marked as IAF. 4 Hz below and 2 Hz above IAF were demarcated as the alpha band. The lowest frequency of the alpha band was marked as transition frequency (TF). 2 Hz below the TF was defined as the lowest limit of the theta band. The frequency domain data were exported into Excel format, where power distributed in each of the 19 channels at each frequency from 1 Hz to 40 Hz was represented. Each channel’s 1–40 Hz summated power represented its total power. The summated total power of seven electrodes spanning frontal and frontopolar regions – Fp1, Fp2, F7, F3, Fz, F4 and F8 – was named as total power frontal (TPF). Similarly, the summated total power of seven electrodes – P3, Pz, P4, O1, O2, T5, and T6 – spanning across the posterior region was named total power posterior (TPP). Absolute alpha power (AAP) and absolute theta power (ATP) were computed by summating power data in each alpha and theta frequency range, respectively. RAP was calculated for each channel by taking the ratio of AAP to TP. The ATR was computed by calculating the ratio between AAP and ATP. Finally, the values were summated for frontal and posterior areas over the same channels to calculate variables – frontal RAP (FRAP), frontal ATR (FATR), posterior RAP (PRAP), and posterior ATR (PATR). The unit of the parameters expressing absolute power – TPP, TPF, AAP, and ATP – was expressed in microvolts squared per hertz (μV2/Hz). The relative parameters such as FATR, PRAP, and PATR are ratios without units. Since we have visually rejected the artefact-contaminated segments and selected only the data epochs with clear EEG traces, the results of the EEG analysis in the frontopolar region reflect only the neural activity.
It is known that patients of chemobrain experience impaired cognitive faculties such as executive dysfunction, working memory, and fluency, mostly frontal in origin. Therefore, we have selected the electrode clusters arbitrarily based on frontal and posterior topography to capture the distinct functions of the frontal and non-frontal areas. Moreover, the alpha rhythm is a posterior dominant rhythm among healthy adults.[12] Therefore, the RAF and ATR are expected to be more prominent in the posterior regions. We have selected the posterior cluster to selectively study the alpha band in the region of its dominance.
Statistical analysis
Statistics analysis was done using IBM SPSS Statistics Version 20.0. Continuous variables like body mass index and other anthropometric indices are expressed as mean with standard deviation or median with inter-quartile range according to the normality assumptions of the variables. Non-normally distributed datasets were log-transformed to generate normally distributed data. The parametric repeated measures of Analysis of Variance were applied over 3-time points for normally distributed data and log-transformed data for non-normally distributed data. P < 0.05 was considered statistically significant. Post hoc pairwise comparison was done with Bonferroni correction to determine the pair in which the difference existed.
RESULTS
The mean age of the study participants was 46 ± 10 years. Out of 60 screened patients, 39 fulfilled the inclusion and exclusion criteria. However, only 23 subjects could complete the scheduled two-follow-ups after chemotherapy.
All the patients received three cycles of 5-flourouracil, epirubicin, and cyclophosphamide over nine weeks, followed by four cycles of docetaxel over three weeks – a total duration of 12 weeks. All the patients received tamoxifen or aromatase inhibitor at the end of 3 months after chemotherapy completion.
Total power in frontal and posterior areas
The present study observed a significant increase in resting state EEG total power (P = 0.012) after chemotherapy and three months after chemotherapy in the frontal area. The data (TPF) represents the total power of seven electrodes spread across frontal areas – Fp1, Fp2, F7, F3, Fz, F4, and F8 – placed according to the International 10–20 system. Post hoc pairwise comparison with Bonferroni correction revealed that the increase was significant after chemotherapy (P = 0.027) and three months after chemotherapy (P = 0.039) compared to prechemotherapy (PC) level [Figure 2 and Table 1]. However, a similar increase in EEG total power was not observed in the posterior areas (TPP), represented by the summated data from the channels – P3, Pz, P4, O1, O2, T5, and T6 – spread across posterior areas [Figure 3 and Table 1].
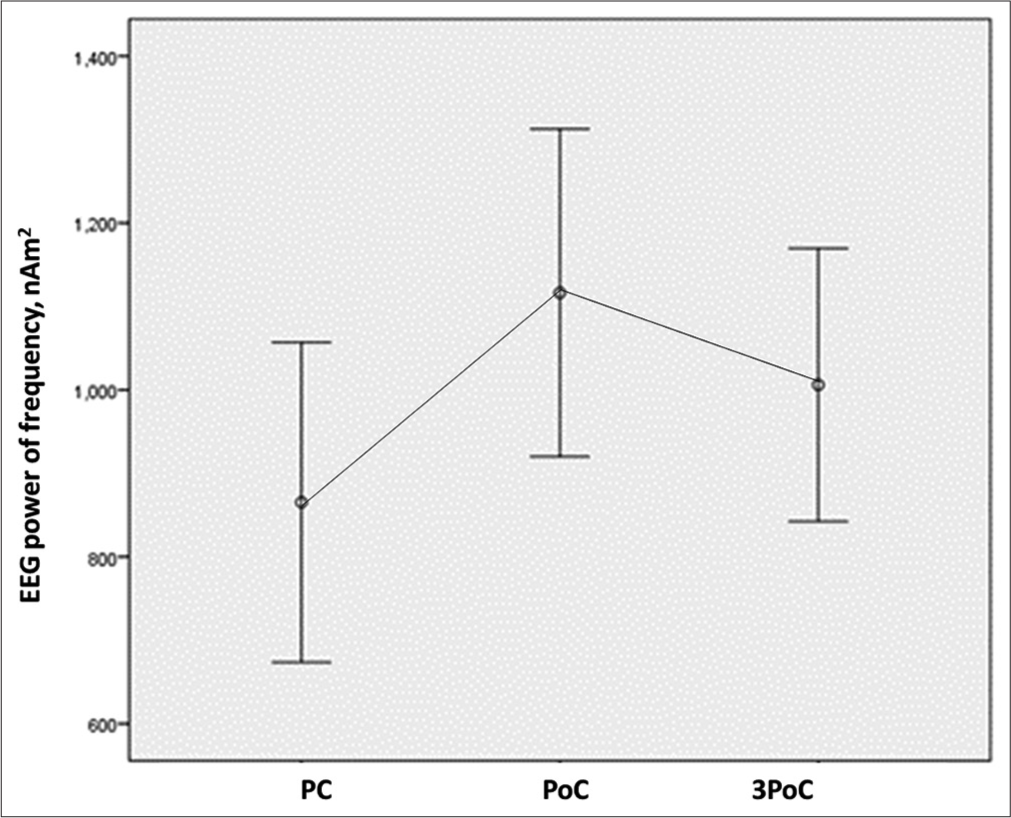
- EEG total frontal power at rest has significantly increased in frontal areas compared to pre-chemotherapy level at all-time points. EEG: Electroencephalogram, PC: Pre-chemotherapy, PoC: Post-chemotherapy.
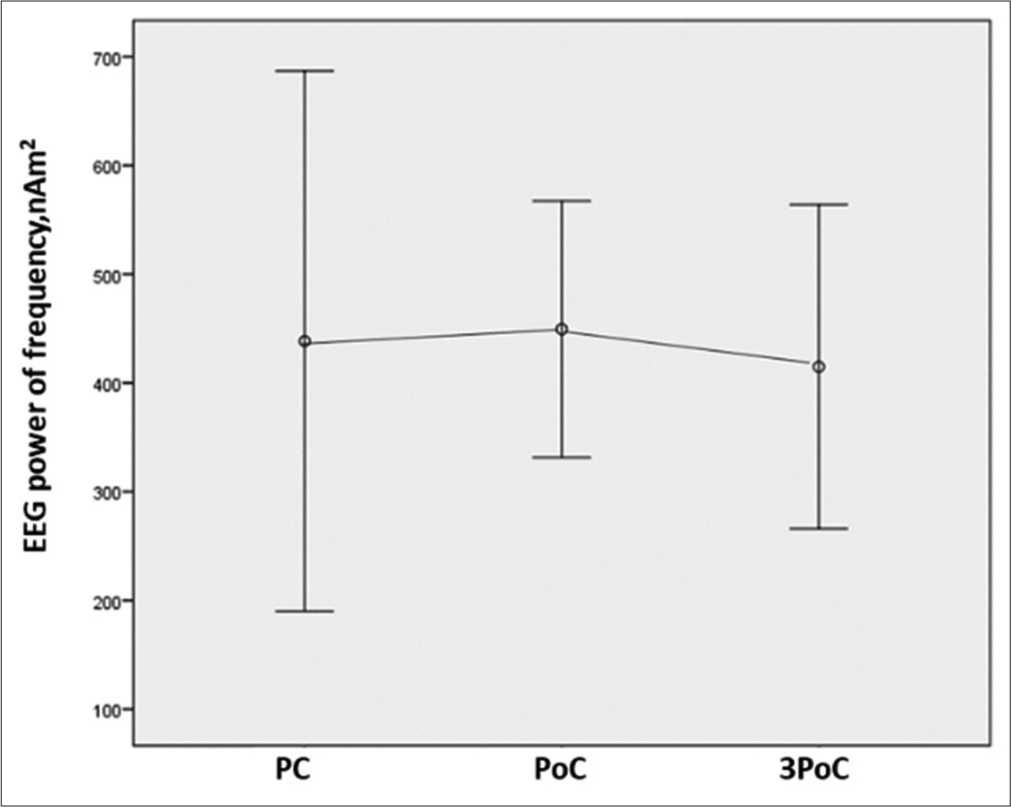
- EEG total power posterior at rest is similar at all time points compared to pre-chemotherapy level. EEG: Electroencephalogram, PC: Pre-chemotherapy, PoC: Post-chemotherapy.
| PC mean (SD) | PoC mean (SD) | 3 months PoC mean (SD) | P-value | PC vs. PoC | PC vs. 3PoC | PoC vs. 3PoC | |
|---|---|---|---|---|---|---|---|
| TPF (µV2/Hz) | 865 (92) | 1116 (95) | 1006 (79) | 0.012 | 0.027 | 0.039 | 0.537 |
| TPP (µV2/Hz) | 438 (574) | 449 (273) | 266 (345) | 0.846 | 1 | 1 | 1 |
| FRAP | 3.44 (1.29) | 3.41 (1.31) | 3.29 (1.12) | 0.644 | 1 | 1 | 1 |
| FATR | 67 (52) | 67 (54) | 57 (35) | 0.263 | 1 | 0.678 | 0.339 |
| PRAP | 3.92 (1.04) | 3.56 (1.09) | 3.50 (1.17) | 0.039 | 0.036 | 0.125 | 1 |
| PATR | 89 (71) | 71 (58) | 66 (47) | 0.012 | 0.039 | 0.048 | 1 |
The values are mean with SD of qEEG parameters with correspondingp -values of repeated measures of ANOVA and pairwise comparison data with Bonferroni correction. The logarithmic transformation has been done to TPP data to apply parametric tests. PC: Pre-chemotherapy, PoC: Post-chemotherapy, TPF: Total power frontal, TPP: Total power posterior, FRAP: Frontal relative alpha power, FATR: Frontal alpha-to-theta ratio, PRAP: Posterior relative alpha power, PATR: Posterior alpha-to-theta ratio, SD: Standard deviation, qEEG: Quantitative electroencephalogram
RAP and ATR in frontal and posterior areas
The RAP and ATR were calculated for the same frontal and posterior channel data. The RAP was significantly decreased with chemotherapy (P = 0.039), with post hoc pairwise comparison with Bonferroni correction revealing the significant decline to be present after chemotherapy (P = 0.036) only over the posterior channels represented as variable PRAP in Table 1 and Figure 4. Furthermore, ATR over posterior areas, represented as variable PATR in Table 1 and Figure 5, was detected to have decreased (P = 0.012) both after completion of chemotherapy (P = 0.039) as well as three months after chemotherapy (P = 0.048). However, similar changes were not observed for FRAP (P = 0.644) and FATR (P = 0.263) over frontal areas [Figures 6 and 7] and [Table 1].
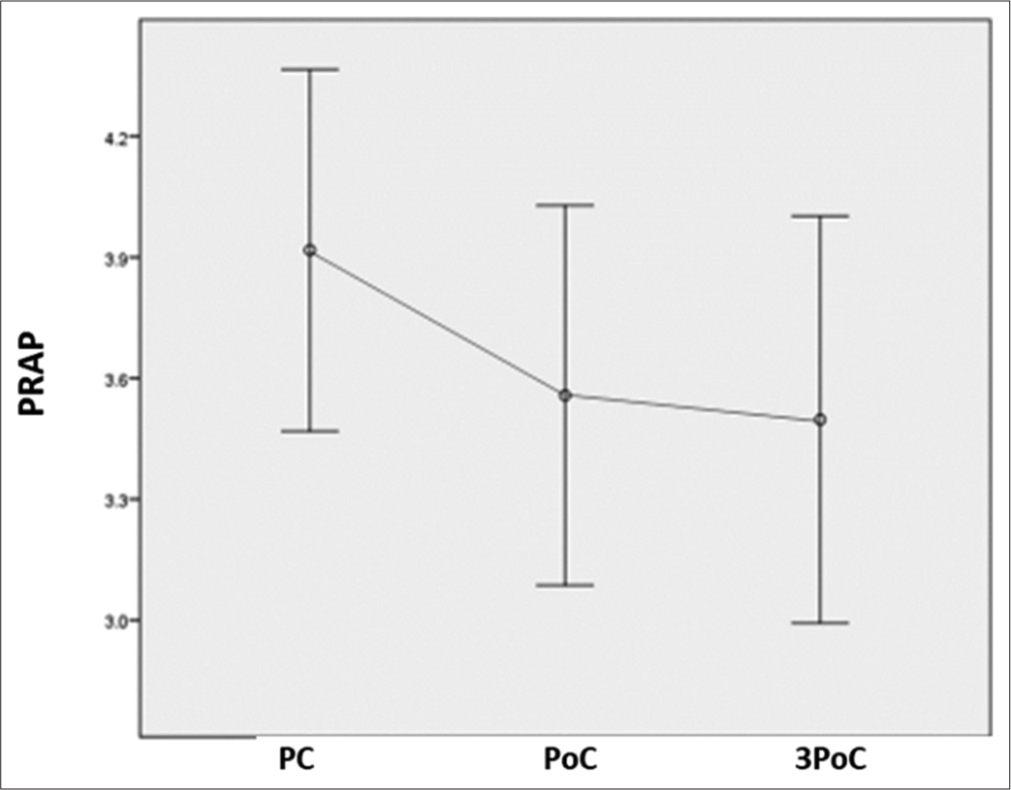
- PRAP power has significantly decreased in posterior areas compared to the pre-chemotherapy level at all-time points. PRAP: Posterior relative alpha power, PC: Pre-chemotherapy, PoC: Post-chemotherapy.
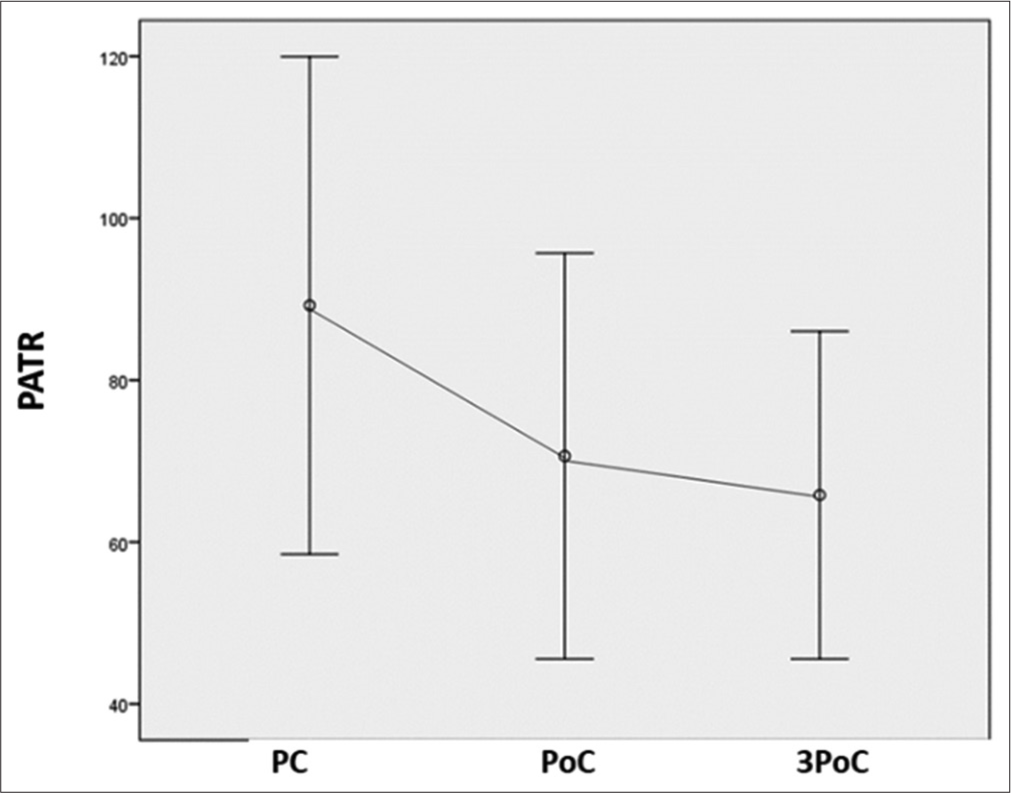
- PATR has significantly decreased in posterior areas compared to the pre-chemotherapy level at all-time points. PATR: Posterior alpha-to-theta ratio, PC: Pre-chemotherapy, PoC: Post-chemotherapy.
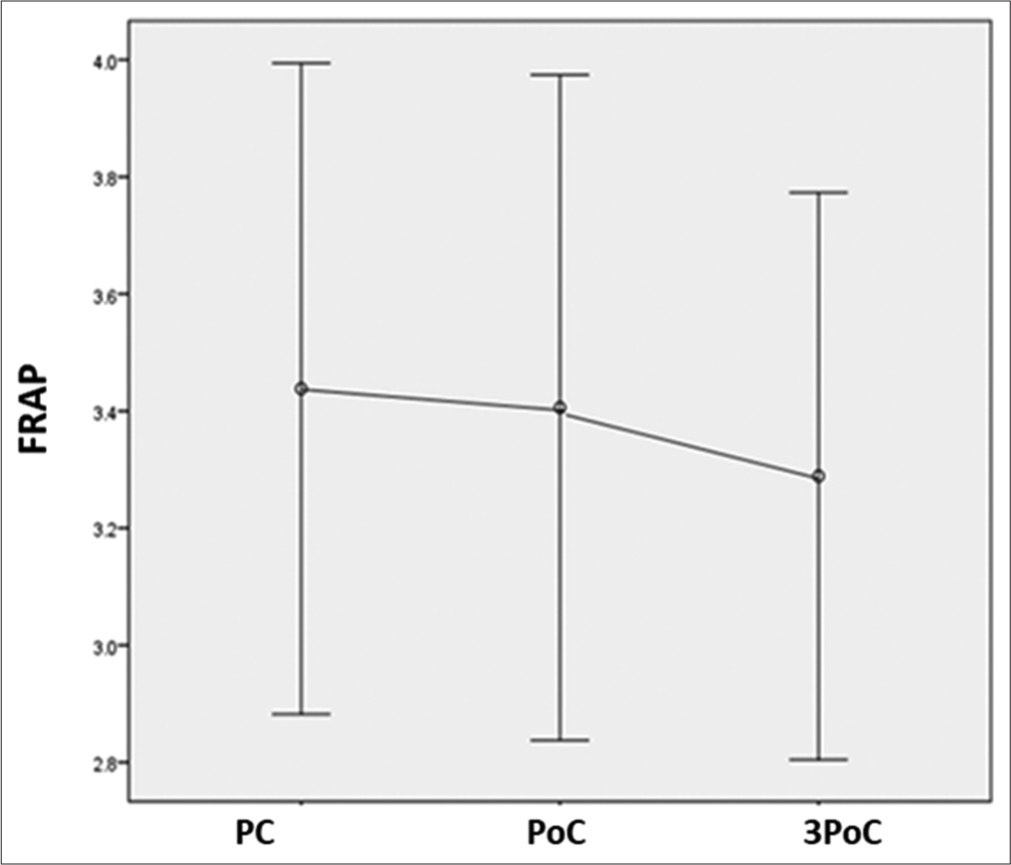
- FRAP is similar in the frontal area at all-time points compared to the pre-chemotherapy level. FRAP: Frontal relative alpha power, PC: Pre-chemotherapy, PoC: Post-chemotherapy.
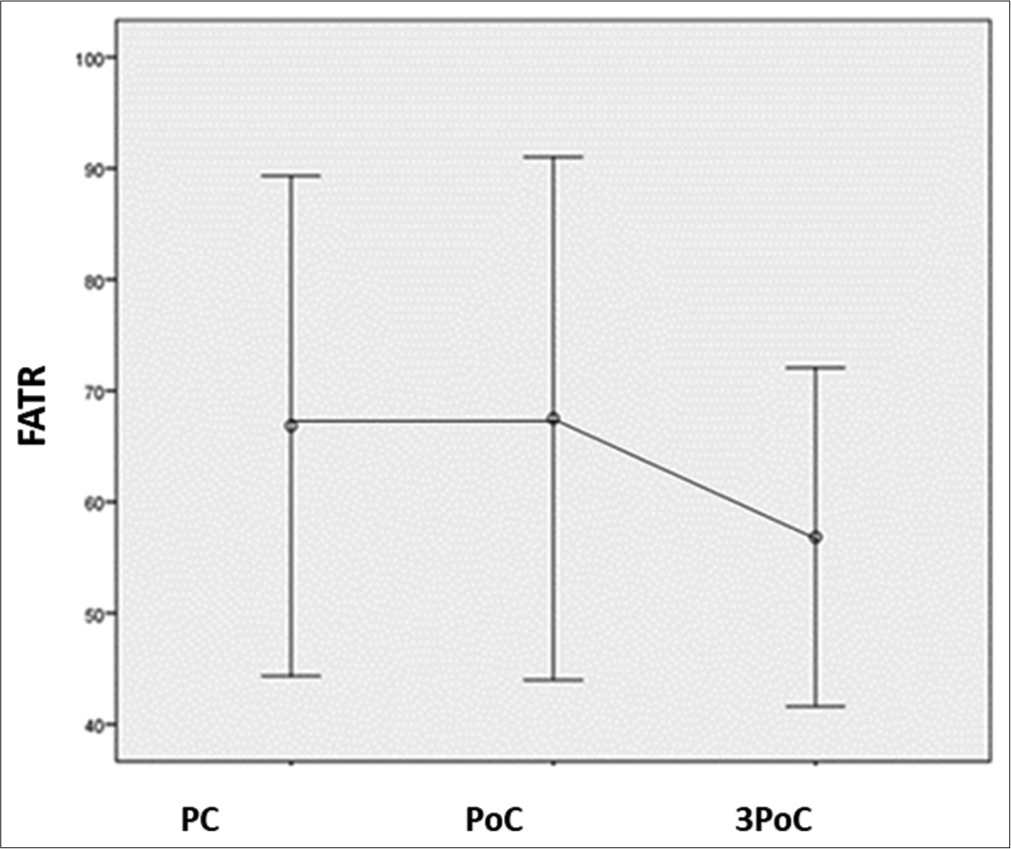
- FATR is similar in frontal area at all-time points compared to pre-chemotherapy level. FATR: Frontal alpha-to-theta ratio, PC: Pre-chemotherapy, PoC: Post-chemotherapy.
DISCUSSION
This study has evaluated the impact of 5-florouracil, epirubicin, and cyclophosphamide (FEC)-based chemotherapy in causing perturbation in neuronal signalling in the brains of early-stage female breast cancer patients undergoing chemotherapy with curative intent for three months. The present study has systematically evaluated the resting state qEEG markers of cognition – the RAP and ATR – of the resting state eyes closed EEG traces. To the best of our knowledge, this is the first-ever study to report the perturbation of these resting-state qEEG markers of cognition among PCCI individuals in a prospective study design.
The chemobrain could be due to peripheral nervous system pathology or insult to the other body systems, resulting in physical and mental fatigue. The cognitive faculties, which are the core functionality of the CNS, might be influenced by the deficit due to peripheral system affliction. However, multiple studies have demonstrated the malfunctioning of the CNS, alluding to the belief that chemotherapy might directly influence the neural substrates of the CNS. Various neuroimaging studies have revealed that patients treated with cancer chemotherapy have various types of white matter changes within the CNS as a hallmark of chemobrain.[13] Other structural magnetic resonance imaging scans have revealed smaller grey matter and white matter volume in the prefrontal, parahippocampal gyrus, precuneus, and cingulate gyrus at the end of 1 year[14] among patients exposed to chemotherapy compared to healthy controls, which significantly correlated with the indices of attention/concentration and/or visual memory. These can be considered supportive evidence to claim a central origin of the chemobrain.
In a pilot study, Moore et al. reported EEG power enhancement among PCCI individuals in resting state and after physical and cognitive activity, compared to baseline and healthy controls.[4] In the same vein, in the present study, a significant increase in EEG power was observed in the frontal area after completion of chemotherapy, which persisted till the end of 3 months after completion of chemotherapy, compared to the PC level. This is suggestive of an overt activation and synchronisation of the underlying frontal neural substrates resulting from the chemotherapy-induced alteration in neural signalling. This is no surprise because previous studies have provided evidence of higher metabolism and glucose uptake during working memory tasks in the inferior frontal gyrus in a PET scan-based study among breast cancer survivors treated with adjuvant chemotherapy.[15]
The RAP and ATR are robust markers of cognition, which not only represents age-related maturity of the brain but also reflects the deterioration of cognitive abilities with ageing, neurodevelopmental anomaly, neurodegeneration, and with sedatives. Interestingly, this study showed a significant decline in RAP and ATR in posterior areas compared to the baseline values. The decline in ATR was apparent even after three months after the completion of chemotherapy. However, they remained unaffected in frontal areas. This suggests redistribution of power to the low-frequency theta band with a reduction in the alpha band because no change in total power was observed in the posterior areas.
These findings suggest clear neurophysiological evidence of an altered pattern of resting-state neural signalling in the brain of breast cancer survivors treated with an FEC-based chemotherapy regimen with objective and sensitive evidence of probable cognitive impairment. This also demonstrates a characteristic pattern of EEG changes with enhanced frontal power with a coincidental decline in RAP and ATR in the posterior areas due to chemotherapy-induced changes.
Koppelmans et al. have reported that cognitive impairment resulting from cancer chemotherapy persists even beyond 20 years after chemotherapy for cyclophosphamide, 5-flourouracil and methotrexate-based chemotherapy.[16] The long-term persistence of PCCI has been reported only among a subset of patients. Thus, given the modest sample size of our study, completely denying the long-term persistence might be an over-interpretation. Nevertheless, this is definitely in agreement with the altered neural signalling immediately after chemotherapy which persisted in the form of raised TP in Fp2, F7, F3, Fz, F4, F8, and T3 channels until three months post-chemotherapy. Again, this perturbed neural signalling is significant in many frontal channels such as F7, F3, Fz, F4, and F8, signifying deranged neural signalling and more intense neural activation.
CONCLUSION
Chemotherapy results in the derangement of neural signalling in the form of altered activity of underlying neural sources in the frontal and posterior scalp areas in a resting state.
Limitations
The sample size of the study is modest. A study with a higher sample size might cast a better understanding of the altered EEG parameters and would have enabled the generalisation of the results. Second, the dosage of chemotherapy, which might affect cognition, should have been considered. Third, including healthy controls to compare study parameters would have made the study more robust. Finally, a long-term follow-up study would have helped understand the long-term persistence of the problem, especially the RAP and ATR in posterior areas, which is lower than the baseline at a three-month follow-up duration.
Ethical approval
Approved by the Institutional Ethics Committee at Jawaharlal Institute of Postgraduate Medical Education and Research, number JIP/IEC/2018/260. Date of ethics approval: 30/08/2018.
Declaration of patient consent
The authors certify that they have obtained all appropriate patient consent.
Conflicts of interest
There are no conflicts of interest.
Use of artificial intelligence (AI)-assisted technology for manuscript preparation
The authors confirm that there was no use of artificial intelligence (AI)-assisted technology for assisting in the writing or editing of the manuscript and no images were manipulated using AI.
Financial support and sponsorship
Intramural Research Funding (JIP/IEC/2018/260), Jawaharlal Institute of Postgraduate Medical Education and Research (JIPMER), Puducherry.
References
- Cognitive impairment in gynecologic cancers: A systematic review of current approaches to diagnosis and treatment. Support Care Cancer. 2014;22:279-87.
- [CrossRef] [PubMed] [Google Scholar]
- Prevalence of cognitive impairment following chemotherapy treatment for breast cancer: A systematic review and meta-analysis. Sci Rep. 2022;12:2135.
- [CrossRef] [PubMed] [Google Scholar]
- Cancer-related fatigue: Central or peripheral? J Pain Symptom Manage. 2009;38:587-96.
- [CrossRef] [PubMed] [Google Scholar]
- Electroencephalogram power changes as a correlate of chemotherapy-associated fatigue and cognitive dysfunction. Support Care Cancer. 2014;22:2127-31.
- [CrossRef] [PubMed] [Google Scholar]
- Alterations in brain activation during working memory processing associated with breast cancer and treatment: A prospective functional magnetic resonance imaging study. J Clin Oncol. 2012;30:2500-8.
- [CrossRef] [PubMed] [Google Scholar]
- Effects of tamoxifen and exemestane on cognitive function in postmenopausal patients with breast cancer. JNCI Cancer Spectr. 2023;7:pkad022.
- [CrossRef] [PubMed] [Google Scholar]
- Do aromatase inhibitors have adverse effects on cognitive function? Breast Cancer Res. 2011;13:203.
- [CrossRef] [PubMed] [Google Scholar]
- Longitudinal quantitative EEG study of children with different performances on a reading-writing test. Electroencephalogr Clin Neurophysiol. 1995;95:426-33.
- [CrossRef] [PubMed] [Google Scholar]
- Alpha frequency, cognitive load and memory performance. Brain Topogr. 1993;5:241-51.
- [CrossRef] [PubMed] [Google Scholar]
- The relationship of cognitive performance and the theta-alpha power ratio is age-dependent: An EEG study of short term memory and reasoning during task and resting-state in healthy young and old adults. Front Aging Neurosci. 2017;9:364.
- [CrossRef] [PubMed] [Google Scholar]
- Correlations of topographical EEG features with clinical severity in mild and moderate dementia of Alzheimer type. Neuropsychobiology. 1997;36:153-8.
- [CrossRef] [PubMed] [Google Scholar]
- The posterior dominant rhythm: An electroencephalographic biomarker for cognitive recovery after general anaesthesia. Br J Anaesth. 2023;130:e233-42.
- [CrossRef] [PubMed] [Google Scholar]
- White matter disease induced by high-dose chemotherapy: Longitudinal study with MR imaging and proton spectroscopy. AJNR Am J Neuroradiol. 1998;19:217-21.
- [Google Scholar]
- Smaller regional volumes of brain gray and white matter demonstrated in breast cancer survivors exposed to adjuvant chemotherapy. Cancer. 2007;109:146-56.
- [CrossRef] [PubMed] [Google Scholar]
- Chemobrain: Imaging shows changes in metabolism. Lancet Oncol. 2006;7:890.
- [CrossRef] [PubMed] [Google Scholar]
- Neuropsychological performance in survivors of breast cancer more than 20 years after adjuvant chemotherapy. J Clin Oncol. 2012;30:1080-6.
- [CrossRef] [PubMed] [Google Scholar]


