
Translate this page into:
The relationship between body mass index and blood pressure: A study among school going children of Rajasthan, India
*Corresponding author: Dr. Shivani Chandel Assistant Professor, Department of Anthropology, University of Delhi, Delhi-110007, India vs.shivani@gmail.com
-
Received: ,
Accepted: ,
How to cite this article: Kaur S, Chandel S, Chandel S. The relationship between body mass index and blood pressure: A study among school going children of Rajasthan, India. Indian J Physiol Pharmacol 2020;64(3):236-41.
Abstract
Objectives:
Hypertension has become common in children and generally remains undiagnosed and untreated. The present study aims to find the prevalence of high blood pressure (BP) and examines the relationship between body mass index (BMI) and BP among school going children.
Materials and Methods:
A cross-sectional study was conducted among 240 school going children aged between 10 years and 17 years of Udaipur district of Rajasthan. Data were collected using interview schedules and somatometric measurements were taken based on standardized protocols established by the International Society for the Advancement of Kinanthropometry. Data were analyzed using Statistical Package for the Social Sciences software version 20. Hypertension is considered when BP (systolic BP [SBP] and/or diastolic BP [DBP]) level is ≥95th percentile for height, age, and sex according to the Fourth Report on the Diagnosis, Evaluation, and Treatment of High BP in Children and Adolescents (2004).
Results:
It was found that 49% children were underweight, 3% were overweight, and 2% were obese. Hypertension was seen in 39 (16.2%) children (5.4% systolic hypertension, 5.8% diastolic hypertension, and 5% both systolic and diastolic hypertension). Children who were overweight/obese were more likely to have hypertension than those who were normal or underweight.
Conclusion:
The findings of the present study indicate that BMI is a crucial factor affecting BP levels. Simple measurements of body weight and height to determine BMI as a routine assessment in schools would help in controlling BP levels in children that might cause adulthood morbidity and mortality due to hypertension.
Keywords
Blood pressure
Body mass index
Hypertension
Prevalence
Children

INTRODUCTION
Elevated blood pressure (BP) in children is considered as an important predecessor of adult hypertension.[1] In a country like India, where double burden of malnutrition like under- and over-nutrition coexists, an emerging public health challenge is that of hypertension. The prevalence of hypertension among children ranges from around 5.4% to 19.4%.[2] Existing literature suggests that hypertension could have its origin in childhood and a slight elevation in BP during childhood increases the risk of hypertension in adults several folds.[3-5] During adolescence, there is an intense change in the life of every individual. This intense change can be of both psychological and physical nature. Psychological changes include intensification of emotional experiences, interest in and practice of adult social, economic, and sexual activities.
On the other hand, physical changes include growth spurt in height and weight, permanent tooth eruption, and development of secondary sexual characteristics.[6] Moreover, it was found that BP varies with age and is closely related to height and weight of a child.[7] Similarly, growth patterns and sex of an individual strongly influence BP levels among children and adolescents.[8] There are some studies which have shown positive correlation between body mass index (BMI) and BP.[9-11] In addition to this, various cross-sectional studies have reported that obese children have significantly high BP than those who are normal weight or underweight.[12,13]
High BP either systolic or diastolic at any age is one of the risk factors for cardiovascular diseases.[14] The previous studies have stated that systolic BP (SBP) elevation in childhood predicts arterial stiffness in young adults.[15,16] On the other hand, diastolic BP (DBP) is important in monitoring BP in younger individuals.[17] Earlier studies done among children and adolescents have shown high burden of hypertension in younger age groups as well.[11,18] Moreover, significant increases in BP occur during adolescence period, and many temporary variations in BP level also occur before attaining more stable levels of adult life.[7] However, such studies on adolescent obesity and hypertension in the rural Indian population are scarce. Thus, considering the importance of identifying the risk of elevated BP at an early stage of life, the present study aims to find out the prevalence of high BP among school going children belonging to the age group of 10–17 years. The study also examines the relationship between BMI and BP.
MATERIALS AND METHODS
A cross-sectional study was carried out among 240 boys belonging to Dangi community of Udaipur, Rajasthan. The sample size was calculated based on the prevalence of hypertension in children of Western India as 6.48%.[19] The following formula given by Daniel, 1999, was used to calculate sample size.[20]
Where, n = sample size, Z = Z statistic for a level of confidence (for the level of confidence of 95%, which is conventional, Z value is 1.96), P = expected prevalence or proportion (in proportion of one; if 6.48%, P = 0.06), and d = precision (in proportion of one; if 5%, d = 0.05).
n = (1.96)2 × 0.06 (1–0.06)/(0.05)2 = 87 (After substituting all the values).
To get more accurate and significant results, a sample size, that is, n = 240 was considered in the present study. An informed consent was obtained from the parents or the guardians of the participants. Children who were apparently healthy belonging to the age group of 10–17 years were included in the study. Children with any chronic or acute illness and those who were on long-term medications were excluded from the study.
General information such as educational level, occupation and income of the parents, family size, and dietary preference was collected using an interview schedule. Height was measured in centimeters (cm) using an anthropometric rod (Galaxy, India) and body weight was measured in kilograms (kg) using weighing scale (Krups, India). Both of these measurements were taken according to standardized protocols established by the International Society for the Advancement of Kinanthropometry.[21] BMI was calculated as weight in kg divided by height in square meters (m2). The reference data used to identify the cutoff points were taken from the Centers for Disease Control and Prevention (CDC) 2000 dataset for BMI as per the guidelines of the Fourth Report on the Diagnosis, Evaluation, and Treatment of High BP in Children and Adolescents.[3,22] Children who had BMI for age percentile <5th were regarded as underweight, 5–<85th percentile as of normal healthy weight, 85th–<95th as of overweight, and ≥95th percentile as obese.[22]
BP was measured in a sitting posture with the hands resting on the examining table with the cubital fossa supported at the level of the heart after providing a rest of 5–10 min.[3] For each participant, it was measured thrice at an interval of 5 min each and mean of these three readings was used for statistical analysis. It was assured that each participant has not taken coffee, tea, water, or any kind of food item in last half an hour before measuring BP. Omron HEM-7080 digital BP monitor validated by Association for the Advancement of Medical Instrumentation and British Hypertension Society after calibration was used to measure BP using an appropriate size cuff.[23] This study was approved by the Ethical Committee of the Department of Anthropology, University of Delhi, Delhi, India (Ref. No./2016/15).
Classification of BP
Polynomial regression models were considered to estimate BP percentiles for arbitrary sex, age, and height as per guidelines given by the Fourth Report on the Diagnosis, Evaluation, and Treatment of High BP in Children and Adolescents (2004).[3] The model used was a fourth degree polynomial model to predict adjusted BP as a function of age and height Z-score. First, observed height was converted into height Z-score using CDC growth charts.[22] After obtaining height Z-score values, regression coefficients were obtained using regression equations. These obtained coefficients values were then used in the formulae provided by the guidelines to calculate expected SBP or DBP.[3] From expected SBP or DBP, SBP or DBP Z-scores were calculated. These obtained SBP or DBP Z-scores were then converted to corresponding SBP or DBP percentiles. Further, individuals were classified into the following categories:
Normal (SBP and DBP < 90th percentile),
Pre hypertension (SBP or DBP ≥ 90th percentile to –<95th percentile),
Hypertension (≥95thpercentile)
Statistical analysis
All the statistical analyses were carried out using MS-Excel 2010 and Statistical Package for the Social Sciences software version 20. Kolmogorov–Smirnov normality test was performed for all the variables and they were found to be normally distributed. Basic descriptive statistics (mean and standard deviation) were calculated for weight, height, BMI, SBP and DBP for all age groups. Odds ratios (ORs) with 95% confidence intervals (CI) were calculated. P < 0.05 was considered to be statistically significant.
RESULTS
The distribution of somatometric variables (weight, height, and BMI) showed a steady increase with age from 10 years onward to 17 years [Table 1]. The distribution of individuals into different categories of BMI revealed that 46% of the children had normal weight, 49% were underweight, 3% were overweight, and 2% were obese [Figure 1].
| Age (years) | n | Weight (kg) Mean±SD |
Height (cm) Mean±SD |
BMI (kg/m2) Mean±SD |
|---|---|---|---|---|
| 10+ | 30 | 27.87±6.27 | 136.40±6.90 | 14.82±2.53 |
| 11+ | 30 | 35.17±8.78 | 146.23±8.13 | 16.34±3.36 |
| 12+ | 30 | 35.63±8.14 | 148.03±6.49 | 16.10±2.60 |
| 13+ | 30 | 38.50±7.24 | 153.57±8.50 | 16.22±2.30 |
| 14+ | 30 | 41.33±8.02 | 158.10±7.32 | 16.45±2.43 |
| 15+ | 30 | 44.83±9.88 | 161.83±8.40 | 16.95±2.73 |
| 16+ | 30 | 48.03±7.98 | 168.00±8.14 | 16.93±1.99 |
| 17+ | 30 | 49.47±6.60 | 169.30±5.75 | 17.22±1.96 |
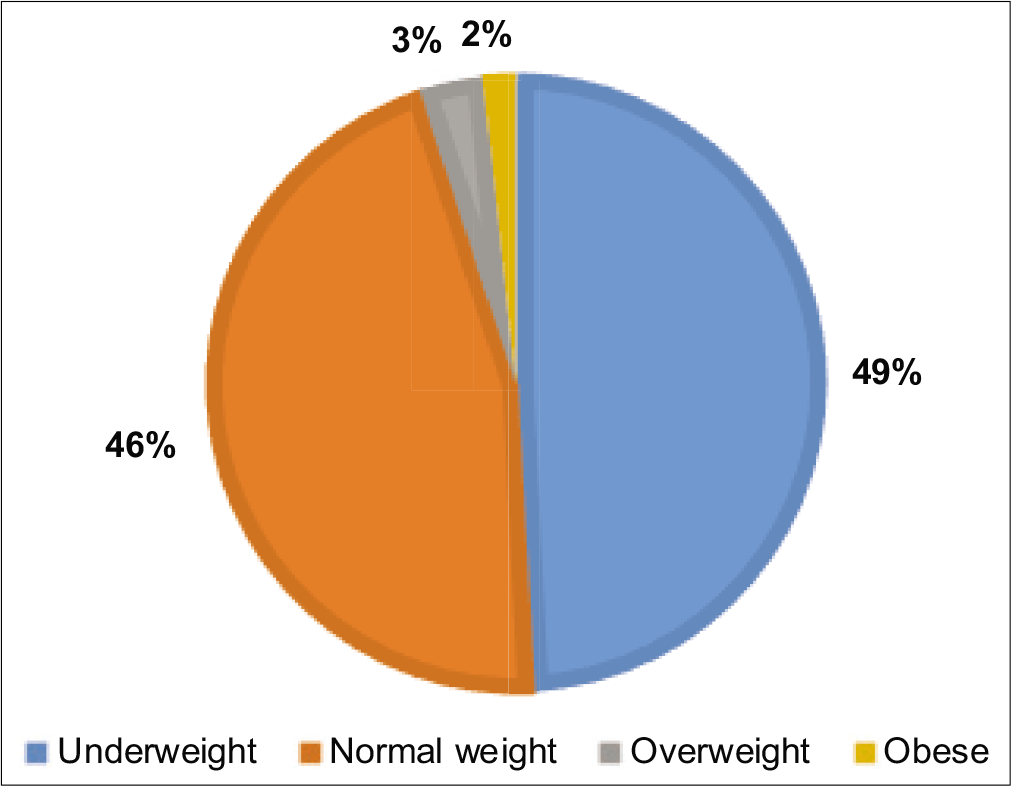
- Distribution of body mass index categories among the studied population.
The age-wise mean SBP, DBP, and percentile values were calculated from 50th percentile to 95th percentile [Table 2]. The mean values of SBP and DBP showed an overall increasing trend across age groups. Regression coefficients using polynomial regression models were obtained [Table 3].
| Age (years) | SBP (mmHg) (mean±SD) | SBP, percentile | DBP (mmHg) (mean±SD) | DBP, percentile | ||||
|---|---|---|---|---|---|---|---|---|
| 50th | 90th | 95th | 50th | 90th | 95th | |||
| 10+ | 101.1±10.7 | 100 | 113 | 127 | 67.9±9.0 | 66 | 83 | 90 |
| 11+ | 106.1±11.9 | 103 | 122 | 132 | 70.7±8.4 | 72 | 83 | 86 |
| 12+ | 102.5±9.3 | 103 | 115 | 120 | 68.6±9.3 | 67 | 82 | 90 |
| 13+ | 108.6±13.0 | 109 | 125 | 135 | 71.1±10.6 | 70 | 81 | 98 |
| 14+ | 113.3±11.0 | 114 | 128 | 131 | 73.5±8.0 | 75 | 85 | 89 |
| 15+ | 109.8±13.2 | 109 | 131 | 138 | 70.7±10.0 | 70 | 85 | 92 |
| 16+ | 117.3±14.3 | 117 | 137 | 142 | 75.5±9.6 | 75 | 88 | 97 |
| 17+ | 114.5±9.9 | 113 | 127 | 136 | 71.7±8.4 | 70 | 86 | 87 |
SBP: Systolic blood pressure, DBP: Diastolic blood pressure
| Variable name | Symbol | Systolic BP (mmHg) | Diastolic BP (mmHg) |
|---|---|---|---|
| Intercept | α | 113.166 | 72.895 |
| Age | |||
| Age-14 | β1 | 3.788 | 1.864 |
| (Age-14)2 | β2 | −0.365 | 0.016 |
| (Age-14)3 | β3 | −0.156 | −0.140 |
| (Age-14)4 | β4 | 0.002 | −0.024 |
| Normalized height* | |||
| Zht | γ1 | 2.093 | 0.504 |
| Zht2 | γ2 | −0.235 | −0.197 |
| Zht3 | γ3 | 0.357 | 0.242 |
| Zht4 | γ4 | 0.054 | 0.037 |
| SD | δ | 11.343 | 9.152 |
The overall prevalence of hypertension (BP ≥95th percentile) was found to be 16.2% among the studied population. It was found that 13 (5.4%) children had systolic hypertension, 14 (5.8%) diastolic hypertension, and 12 (5%) both systolic and diastolic hypertension [Table 4].
| Hypertension | Number of cases (n) | % |
|---|---|---|
| Systolic | 13 | 5.4 |
| Diastolic | 14 | 5.8 |
| Both systolic and diastolic | 12 | 5.0 |
The distribution of individuals with different types of hypertension (systolic, diastolic, and both systolic and diastolic) was seen with respect to their BMI statuses [Table 5]. It was found that BMI was a significant determinant of hypertension. OR analysis revealed that children who were overweight/obese were more likely to have hypertension, whether systolic hypertension (OR - 2.39; CI - 0.43–13.0), diastolic hypertension (OR - 1.54; CI - 0.16–14.0), or both systolic and diastolic hypertension (OR - 1.34; CI - 0.14–12.1); however, the finding was not statistically significant (P > 0.05).
| BMI | Normal blood pressure n(%) | Systolic HTN n(%) | Diastolic HTN n(%) | Both systolic and diastolic HTN n (%) | OR (C.I.), P-value |
|---|---|---|---|---|---|
| Normal | 86 (78.2) | 09 (8.2) | 07 (6.4) | 08 (7.2) | Referent |
| Underweight | 107 (90.7) | 02 (1.7) | 06 (5.1) | 03 (2.5) | OR1=0.20 (0.03–0.84), 0.03* OR2=0.69 (0.22–2.12), 0.51 OR3=0.30 (0.07–1.17), 0.08# |
| Overweight/Obese | 08 (66.7) | 02 (16.7) | 01 (8.3) | 01 (8.3) | OR1=2.39 (0.43–13.0), 0.31 OR2=1.54 (0.16–14.0), 0.7 OR3=1.34 (0.14–12.1), 0.7 |
OR and 95% CI were calculated after adjusting for age, HTN: Hypertension, OR: Odds ratios, CI: confidence intervals. †Referent versus OR1 – Systolic HTN, OR2 – Diastolic HTN, OR3 – Both systolic and diastolic HTN. *P-value significant level at ≤0.05; #suggestive P-value significant level at ≤0.09
Moreover, it was found that among the children with normal weight, 8.2% had systolic hypertension, followed by both systolic and diastolic hypertension (7.2%), and diastolic hypertension (6.4%). Similarly, in case of overweight or obese children, 16.7% had systolic hypertension, followed by diastolic hypertension (8.3%), and both systolic and diastolic hypertension (8.3%) [Table 5].
DISCUSSION
The results of the study revealed that the majority of the population that is 49.16% falls under the underweight category. The prevalence of overweight/obese individuals is 5%. However, in the studied population, the overall prevalence of hypertension is found to be 16.2% (5.4% systolic hypertension, 5.8% diastolic hypertension, and 5% both systolic and diastolic). The prevalence of hypertension in our study is similar to that reported previously by Thangjam et al. in 2017. It showed 15.3% high prevalence of hypertension among the school going children aged 5–15 years of Manipur.[18] Similar to this, another study from Imphal showed 15.7% prevalence of hypertension among students of higher secondary.[24] In contrast to this, many other studies done in different regions showed the prevalence of hypertension in the school going children to be in the range of 3–10%.[11,19,25-28] One of the study showed that the prevalence of hypertension among South Asian children was substantially greater than 5% predicted prevalence of high BP in children in the United States based on the same criteria despite of their lower BMI values.[29] It is interesting to note that hypertension which is generally observed among overweight and obese individuals was also found among normal and underweight individuals of the present study.
Moreover, in the present study, it is found that children who are overweight/obese were nearly 2 times more likely to have hypertension compared to children who are having normal weight or underweight. Studies done in India and also in various other countries had similar findings to the present study.[18,30-33] One of the studies done by Jena et al. proposed that greater BMI in adolescence is associated with elevated BP.[13] Another study by Sorof and Daniels found that obese children are at a three-fold higher risk for developing hypertension than non-obese children.[34] Similarly, Charan et al. found a significant rise of hypertension among obese participants whether boys or girls, thus, concluded that obesity plays an important role in development of hypertension during childhood.[19] The reason behind this could be supported with the fact that in obesity, abnormal renal tubular dysfunction occurs in which tubular reabsorption of sodium is increased which, in turn, increases the extracellular fluid volume, blood volume, and thus, the BP. Another mechanism responsible for causing high BP in overweight and obese children is the activation of the sympathetic nervous system and reninangiotensinaldosterone system.[35]
In review of the literature, there have been some studies that have shown that BP in children could be affected by various factors such as cultural, environmental, social, and genetic components, also the levels of BP varies with age, sex, and during growth and development period of an individual.[36,37] One of the studies done among adolescents of New Delhi found lifestyle associated risk factors such as low physical activity, alcohol consumption, smoking, and inappropriate dietary practices (such as more fast food consumption and low fruit consumption) to be associated with high prevalence of obesity and hypertension.[38]
Limitations of the study
The present study has some limitations. First, this was a cross-sectional study and only boys were included in the study. A larger group of children comprising both boys and girls is more appropriate for the evaluation of prevalence of hypertension. Second, there is a lack of information on factors such as dietary habits of the children, their physical activity status, genetics, and family history of hypertension, in the present study, which are risk factors associated with obesity and high BP. These can be taken up by future research studies. Nevertheless, our study is the first population based study done among children of Dangi community of Western India that has contributed towards the understanding of association between BMI and BP.
Practical application
Findings of the present study suggest that each and every child whether having normal weight, underweight, overweight or obesity should be screened clinically for his/her BP status. As, any rise in BP during this growing stage can increase the risk of hypertension in their adulthood. Health education in schools should be provided to look seriously into the growing burden of chronic diseases in our society so that preventive measures can be taken up at the grass root level by providing information related to lifestyle modifications.
CONCLUSION
The findings of the present study indicate that BMI is a crucial factor affecting BP levels. The study highlights the importance of screening children at younger age so that prevention of high BP can be done.
Acknowledgments
The authors are grateful to all the participating children and their parents for their cooperation in this study. The authors are also grateful and express their gratitude to the Department of Anthropology, University of Delhi for providing the necessary facilities to carry out this study.
Declaration of patient consent
Patient’s consent not required as there are no patients in this study.
Financial support and sponsorship
Nil.
Conflicts of interest
There are no conflicts of interest.
References
- Variations in the prevalence of point (pre) hypertension in a Nigerian school-going adolescent population living in a semi-urban and an urban area. BMC Pediatr. 2010;10:13.
- [CrossRef] [PubMed] [Google Scholar]
- High blood pressure in school children: Prevalence and risk factors. BMC Pediatr. 2006;6:32.
- [CrossRef] [PubMed] [Google Scholar]
- The fourth report on the diagnosis, evaluation, and treatment of high blood pressure in children and adolescents. Pediatrics. 2004;114:555-76.
- [CrossRef] [Google Scholar]
- Tracking of blood pressure among adolescents and young adults in an urban slum of Puducherry. Indian J Community Med. 2008;33:107-12.
- [CrossRef] [PubMed] [Google Scholar]
- Tracking of blood pressure from childhood to adulthood: A systematic review and meta-regression analysis. Circulation. 2008;117:3171-80.
- [CrossRef] [PubMed] [Google Scholar]
- Human growth and development In: Meuhlenbein MP, ed. Basics in Human Evolution. London: Academic Press; 2015. p. :285-93.
- [CrossRef] [Google Scholar]
- Influence of lean body-mass index versus that of fat mass index on blood pressure of Gujarati school going adolescents. Indian J Physiol Pharmacol. 2014;58:39-44.
- [Google Scholar]
- Blood pressure nomograms for children and adolescents, by height, sex, and age, in the United States. J Pediatr. 1993;123:871-86.
- [CrossRef] [Google Scholar]
- Obesity in Indian children: Time trends and relationship with hypertension. Natl Med J India. 2007;20:288-93.
- [Google Scholar]
- Distribution of blood pressure in school going children in rural area of Wardha district, Maharashatra, India. Ann Pediatr Cardiol. 2008;1:101-6.
- [CrossRef] [PubMed] [Google Scholar]
- Distribution of blood pressure and correlates of hypertension in school children aged 5-14 years from North East India. Indian J Med Res. 2015;142:293-300.
- [CrossRef] [PubMed] [Google Scholar]
- Risk of high blood pressure in undernourished and over nourished adolescents from urban population in India. Indian J Nutr Diet. 2014;51:358.
- [Google Scholar]
- Relationship between body mass index and blood pressure in school students. CHRISMED J Health Res. 2018;5:187-90.
- [Google Scholar]
- Special issues in the management of obesity in childhood and adolescence In: World Health Organization, editor, Obesity-Preventing and Managing the Global Epidemic. Geneva: World Health Organization; 1998. p. :231-47.
- [Google Scholar]
- Childhood blood pressure as a predictor of arterial stiffness in young adults: The Bogalusa heart study. Hypertension. 2004;43:541-6.
- [CrossRef] [PubMed] [Google Scholar]
- Cardiovascular risk factors in childhood and carotid artery intima-media thickness in adulthood: The cardiovascular risk in young Finns study. JAMA. 2003;290:2277-83.
- [CrossRef] [PubMed] [Google Scholar]
- Prediction of adult hypertension by K4 and K5 diastolic blood pressure in children: The Bogalusa heart study. J Pediatr. 1998;132:687-92.
- [CrossRef] [Google Scholar]
- The profile of Blood Pressure (BP) and the prevalence of hypertension in school going children aged 5-15 years of Manipur, a North-Eastern hilly Indian state. Int J Contemp Pediatr. 2017;4:2151-7.
- [CrossRef] [Google Scholar]
- Prevalence of hypertension in school going children of Surat city, Western India. J Cardiovasc Dis Res. 2011;2:228-32.
- [CrossRef] [PubMed] [Google Scholar]
- Biostatistics: A Foundation for Analysis in the Health Sciences New York: John Wiley & Sons; 1999.
- [Google Scholar]
- Centers for Disease Control and Prevention. 2018. USA, CDC Growth Charts for the United States (Database on the Internet). Available from: https://www.cdc.gov/growthcharts/zscore.htm [Last accessed on 2018 Dec 02]
- [Google Scholar]
- Blood pressure measuring devices: Recommendations of the European society of hypertension. BMJ. 2001;322:531-6.
- [CrossRef] [PubMed] [Google Scholar]
- KAP and prevalence of hypertension among higher secondary school students of greater Imphal area of Manipur. J Med Soc. 2007;21:74-7.
- [Google Scholar]
- Essential hypertension in early and mid-adolescence. Indian J Pediatr. 2007;74:1007-11.
- [CrossRef] [PubMed] [Google Scholar]
- Association of obesity with hypertension amongst school-age children belonging to lower income group and middle income group in national capital territory of Delhi. Indian J Community Med. 2013;38:175-9.
- [CrossRef] [PubMed] [Google Scholar]
- Prevalence of obesity and hypertension in adolescent school going children of Berhampur, Odisha, India. Int J Physiother Res. 2014;2:777-80.
- [CrossRef] [Google Scholar]
- Prevalence of hypertension among school children in a rural area of Tamil Nadu. Indian Pediatr. 2016;53:165-6.
- [CrossRef] [PubMed] [Google Scholar]
- Children in South Asia have higher body mass-adjusted blood pressure levels than white children in the United States: A comparative study. Circulation. 2005;111:1291-7.
- [CrossRef] [PubMed] [Google Scholar]
- Weight status in childhood as a predictor of becoming overweight or hypertensive in early adulthood. Obes Res. 2005;13:163-9.
- [CrossRef] [PubMed] [Google Scholar]
- Overweight, obesity and elevated blood pressure in children and adolescents. Eur J Med Res. 2006;11:97-101.
- [Google Scholar]
- Update: Ambulatory blood pressure monitoring in children and adolescents: A scientific statement from the American heart association. Hypertension. 2014;63:1116-35.
- [CrossRef] [PubMed] [Google Scholar]
- The relationship between blood pressure, anthropometric indices and metabolic profile in adolescents: A cross sectional study. Indian J Pediatr. 2015;82:445-9.
- [CrossRef] [PubMed] [Google Scholar]
- Obesity hypertension in children: A problem of epidemic proportions. Hypertension. 2002;40:441-7.
- [CrossRef] [PubMed] [Google Scholar]
- Study of correlation of body mass index (BMI) with blood pressure in school going children and adolescents. Int J Recent Trends Sci Technol. 2011;1:20-6.
- [Google Scholar]
- Blood pressure nomograms for children and adolescents in Turkey. Pediatr Nephrol. 1999;13:438-43.
- [CrossRef] [PubMed] [Google Scholar]
- Blood pressure nomograms for school children in Iran. Pediatr Nephrol. 2004;19:164-8.
- [CrossRef] [PubMed] [Google Scholar]
- Lifestyle associated risk factors in adolescents. Indian J Pediatr. 2006;73:901-6.
- [CrossRef] [PubMed] [Google Scholar]


