
Translate this page into:
Trop T, hand grip strength and waist circumference as markers of sarcopenic obesity in postmenopausal women: An analytical cross-sectional study
*Corresponding author: Arul Senghor K. A., Department of Biochemistry, SRM Medical College Hospital and Research Centre, SRM Institute of Science and Technology, Kattankulathur, Chengalpattu, Tamil Nadu, India. arulsenk@srmist.edu.in
-
Received: ,
Accepted: ,
How to cite this article: Sarangi S, Arul Senghor KA, Vinodhini VM. Trop T, hand grip strength and waist circumference as markers of sarcopenic obesity in postmenopausal women: An analytical cross-sectional study. Indian J Physiol Pharmacol. 2024;68:57-63. doi: 10.25259/IJPP_510_2023
Abstract
Objectives:
Sarcopenic obesity is defined as age-associated histological changes and adiposity in muscles that impair muscle function. Asian Working Group for Sarcopenia suggested hand grip strength (HGS) and gait speed for screening sarcopenia. Troponin is a putative biomarker of muscle health. The study aims to evaluate Trop T, HGS, and waist circumference (WC) as markers of sarcopenic obesity in postmenopausal women.
Materials and Methods:
An analytical cross-sectional study was conducted in healthy postmenopausal women. Anthropometric measurements, HGS, and gait speed were documented. Postmenopausal women were identified as sarcopenic obesity with the following criteria: (a) The cut-points for weak handgrip strength (kg) for women as <18 in Asians (b) WC ≥85 cm in women. Total cholesterol, triglycerides, high-density lipoprotein (HDLc), low-density lipoprotein (LDLc), and high sensitive troponin T levels were estimated in the automated biochemistry analyser.
Results:
About 33% sarcopenic obesity was observed in postmenopausal women aged 56 to 60 years. WC (93 cm) and body mass index (29.64) were increased in sarcopenic obese. Decreased HGS (9.44 kg) and increased gait speed (13.62 s) were observed in sarcopenic obese as compared to non-sarcopenic obese women. Increased troponin T (0.068 ng/mL), small dense LDLc (mmol/L), LDLc, non-HDLc, and decreased HDLc were observed in sarcopenic obese postmenopausal women. Receiver’s operating characteristic curve: sensitivity of waist circumference, HGS, gait, and troponin T were 97% (area under the curve [AUC] 0.76), 83% (AUC 0.84), 82% (AUC 0.76) and 67% (AUC 0.77), respectively.
Conclusion:
Measurement of waist circumference, hand grip strength, and gait are diagnostic tools of sarcopenic obesity that divulges the quality of postmenopausal life.
Keywords
Hand grip strength
Sarcopenic obesity
Troponin T
Waist circumference

INTRODUCTION
Living in the current lifestyle pattern, age-related body composition in menopausal women results in an increased prevalence of obesity which drives a condition called ‘Sarcopenic obesity’ characterised by a mismatch between muscle mass and fat mass. The prevalence of sarcopenic obesity ranges from 5.4% to 6.3% using indigenous Asian-Indian cutoffs.[1] It is defined as age-associated histological changes and adiposity in muscles that impair muscle function.
Asian working group for sarcopenia suggested hand grip strength (HGS) and gait speed for screening sarcopenia. It has been recommended HGS <22.5 kg in males and <14.5 kg in females.[2] Evidence suggests that sarcopenic obesity is associated with a higher risk of physical inactivity. Age-related changes in body composition render elderly individuals more prone to metabolic challenges such as increased insulin resistance and glucose intolerance, which increases their likelihood of developing cardiovascular disease (CVD).[3] With increasing age, body fat accumulates, and muscle mass reduces, as reflected by the concept of sarcopenic obesity.[4,5]
The basal metabolic rate decreases as a result of the age-related loss of lean muscle mass. Less physical activity, decreased mitochondrial volume, and decreased oxidative capacity all contribute to the lower basal metabolic rate. Age-related inactivity reduces energy expenditure, which leads to weight gain, a steady increase in body fat, and a positive energy balance. Individuals with low muscle mass tend to develop accumulation of adipose depot that instantaneously reduces peripheral insulin sensitivity.[6] As advancing age, muscle quality decreases as well as muscle strength, regardless of muscle mass, as a result of a fall in muscle fibre size and quantity as well as a decrease in the synthesis of muscle protein.
Progressive loss of skeletal muscles is considered an independent risk factor for mortality in patients with CVD. Researchers have defined the emerging health problem as a condition characterised by the simultaneous occurrence of increased body fat and low muscle mass, the strength that uplifts obesity with declining age.[7]
Usually, bone mass peaks at the age of 30 years and then progressively declines with age. Thus, age-related decline in muscle mass and bone mass are associated with increased risk of disability, falls, and decreased bone mineral density, which, in turn, affects health outcomes affecting the women’s quality of life during the phase of menopause.[8,9]
As age advances, there is an increase in visceral fat adiposity with loss of muscle mass. BMI (body mass index) is not an accurate measure of obesity in ageing population since does not take into account muscle mass, bone density, overall body composition. Our major concern is the age-associated loss of skeletal muscle and intra-muscular fat deposition, which is associated with metabolic dysregulation and the risk of CVD. Troponin is a putative biomarker of muscle health, which acts as an indicator of early diagnostic and prognostic markers that can support intervention decisions.[10]
It is high time that we understand the importance of identifying individuals with sarcopenic obesity and cardiovascular risk in postmenopausal women. Thereby, efforts can be put forth to promote healthy ageing that focuses on preventing obesity with the importance of maintaining muscle mass.
Thus, the primary objective of this study is to evaluate Trop T, HGS, and waist circumference (WC) as markers of sarcopenic obesity in postmenopausal women and to determine the diagnostic performance of troponin, handgrip strength, and WC to diagnose sarcopenic obesity in post-menopausal women.
MATERIALS AND METHODS
This analytical cross-sectional was conducted at SRM Medical College Hospital and Research Centre, Master Health Checkup, from August to September 2022. By selective sampling technique, postmenopausal women in the age group between 51 and 65 years were recruited.
Postmenopausal women attending the Master Health checkup are the participants. The sample size was calculated based on the prevalence of sarcopenic obesity in postmenopausal women at 6.3%.[1]
Sample size
(N) = Z2(pq)2/d2
Z (level of confidence according to the standard normal distribution) = 1.96
p (estimated proportion of the population) = p = 6.3 % = 0.063; q = 1-p = 1-0.063 = 0.93
d = 5%, n = (1.96)2 × 0.063 × 0.93/(0.0025) = 90 participants.
Inclusion criteria
The study was conducted among healthy participants, women aged 51–65 years who had attained menopause.
Exclusion criteria
Individuals with medical history of chronic renal failure, liver disease, rheumatoid arthritis, and inadequate nutrition were excluded from the study.
The study was conducted in accordance with the Declaration of Helsinki. Protocols were followed as per the guidelines of biomedical research in human participants. The research study protocol was maintained as per the Institutional Ethics Committee [IEC/8445/2022]. This research work is an ICMR-STS project Ref ID: 2022-04188.
The study participants were explained in detail regarding the study purpose and procedure. The patient information sheet was explained, and with the written consent of the participants, the study commenced.
After a physical examination by the Medical Officer, the purpose of the study was explained, and a consent form was filled out. Anthropometric measurements such as weight (kg), height (Ht) (mts), WC, and hip circumference (HC) (cm) were measured. HGS was measured with a hand dynamometer. Measurement was taken thrice, and an average of it was documented.[11] Gait speed was recorded when the participants were made to walk a distance of 8 feet at their usual walking pace, turning around and walking back to the standing point. Two walks were recorded, and the mean was documented. A gait speed of 0.8 m/s is the recommended cut-point for identifying sarcopenia based on an association with increased mortality and disability.[5]
Postmenopausal women were identified as sarcopenic obesity with the following criteria: (i) The cut-points for weak handgrip strength (kg) for men and women are <26 and <18 in Asians (EWGSOP definition).[12] (ii) WC ≥90 cm in men and ≥85 cm in women. (iii) Self-reported physical activity on frequencies of resistance exercise, flexibility exercise, and walking time per day.
Data collection
Baseline details of all the participants, such as age, body mass index, age of menopause, history of diabetes and hypertension, and use of any medications, were noted in the documentation sheet.
Biochemical investigations
All the participants were subjected to detailed history as per the prepared pro forma and relevant investigations after obtaining informed and written consent. 4 mL of venous blood sample was collected from all the participants under strict aseptic precautions in appropriate vacutainer tubes, and samples were centrifuged and the serum separated. Lipid parameters such as total cholesterol, triglycerides, high-density lipoprotein (HDLc), and low-density lipoprotein (LDLc) were analysed using the Beckman Coulter AU480 autoanalyser using dedicated reagents. The serum is high sensitive troponin T levels were estimated by electrochemiluminescence immunoassay using dedicated reagents in the automated biochemistry analyser. The normal reference interval of troponin T is <0.01 ng/mL. Small dense LDL was calculated using the formula: 0.580 (non–HDL-C) + 0.407 (dLDL-C)−0.719 (cLDL-C)−0.312)
Statistics
Data were analysed using a statistical package for the social sciences (SPSS 22.0) to compare the quantitative variables (SPSS Inc., Chicago, IL, USA). Kolmogorov–Smirnov test was employed to assess the normality of continuous variables, and data were reported as the mean ± standard deviation (SD). One sample t-test was applied with a defined cutoff value. Student’s t-test was utilised to analyse the difference between the mean levels of various parameters between the two groups. P < 0.05 was considered as statistically significant. The receiver’s operative characteristic curve was utilised to determine the diagnostic performance of the analyte.
RESULTS
This analytical cross-sectional study was conducted in 90 postmenopausal women as per the criteria of sarcopenic obesity. Table 1 represents the baseline, and Table 2 represents the anthropometric details of the post-menopausal women recruited for the study. About 33% sarcopenic obesity was observed in postmenopausal women in the age group between 56 and 60 years.
| Particulars | Number of participants (%) |
|---|---|
| Post-menopausal women | 90 nos. |
| Post-menopausal women with sarcopenia | 45 nos. |
| Post-menopausal women without sarcopenia | 45 nos. |
| Age | |
| 51–55 years | 28 nos. (31.1) |
| 56–60 years | 30 nos. (33.33) |
| 61–65 years | 32 nos. (35.55) |
| Anthropometric variables | Quantitative values mean (SD) | SEM | t-value | P-value |
|---|---|---|---|---|
| Weight (cm) | 59.91±7.2 | 0.758 | 13.05 | 0.0001** |
| Height (mt) | 150.54±5.1 | 0.53 | 1.004 | 0.3179* |
| BMI (kg/mt2) | 26.57±4.07 | 0.429 | 8.55 | 0.0001** |
| WC (cm) | 89.78±7.05 | 0.74 | 6.43 | 0.0001*** |
| HC (cm) | 104.08±8.22 | 0.866 | 10.47 | 0.0001*** |
| WHR | 0.86±0.038 | 0.004 | 2.49 | 0.014** |
| WC/Ht ratio | 0.597±0.05 | 0.005 | 20.3 | 0.0001*** |
| Hand grip strength (kg) | 13.21±8.3 | 0.875 | 5.47 | 0.0001*** |
| Gait (sec) | 9.41±1.95 | 0.21 | 11.72 | 0.0001*** |
One sample t-test. Expressed in mean (standard deviation [SD]), SEM: Standard error of the mean, WC: Waist circumference, BMI: Body mass index, HC: Hip circumference, WHR: Waist hip ratio, WC/Ht: Waist circumference height ratio. Numerical data are expressed as mean±SD. *P<0.05: Significant, **Significant, ***Extremely significant
Table 3 represent the comparison of anthropometric and biochemical analytes between non-obese and sarcopenic obese post-menopausal women. In comparison with non-obese, the Sarcopenic obese post-menopausal women had increased waist circumference and BMI. HGS was lowered, and gait speed was elevated in sarcopenic obese as compared to non-sarcopenic obese women.
| Particulars | Non-sarcopenic obesity (n=45) | Sarcopenic obesity (n=45) | t-value | P-value |
|---|---|---|---|---|
| Age (years) | 58.3±5.31 | 61±5.34 | –0.6059 | 0.54 (NS) |
| Weight (cm) | 54.48±4.135 | 65.206±5.54 | –10.09 | 0.0001*** |
| Height (mt) | 1.52±0.04 | 1.48±0.05 | –4.609 | 0.0001*** |
| BMI | 23.43±1.92 | 29.64±3.17 | –10.89 | 0.0001*** |
| WC (cm) | 86.47±4.46 | 93.02±7.64 | –4.81 | 0.0001*** |
| HC (cm) | 100.81±5.75 | 107.28±9.04 | –1.37 | 0.0002*** |
| WHR | 0.85±0.034 | 0.868±0.04 | –2.23 | 0.028* |
| WC/Ht ratio | 0.567±0.034 | 0.627±0.063 | –5.65 | 0.0001*** |
| Hand grip strength (kg) | 19.029±1.17 | 9.44±1.67 | 11.45 | 0.0001*** |
| Gait (sec) | 8.21±1.16 | 13.62±1.84 | –7.174 | 0.0001*** |
Student’s t-test: Numerical data are expressed as mean±standard deviation. *P<0.05: Significant, NS: Not significant, ***Extremely significant. WC: Waist circumference, HC: Hip circumference, WHR: Waist hip ratio, WC/Ht: Waist circumference/height ratio, BMI: Body mass index
Biochemical lipid analytes as given in Table 4, revealed elevated LDLc, non-HDLc, and lowered HDLc in sarcopenic obese women as compared to non-obese post-menopausal women. Troponin T and small dense LDLc levels were high and statistical significance was observed in sarcopenic obese postmenopausal women.
| Particulars | Non-sarcopenic obesity (n=45) | Sarcopenic obesity (n=45) | t-value | P-value |
|---|---|---|---|---|
| TC (mg/dL) | 114.19±23.6 | 147.74±37.24 | –4.947 | 0.0001*** |
| Triglycerides (mg/dL) | 65.45±9.74 | 87.34±14.65 | –6.48 | 0.0001*** |
| HDLc (mg/dL) | 48.85±3.02 | 44.18±2.63 | 7.613 | 0.0001*** |
| Non-HDLc (mg/dL) | 65.33±24.63 | 103.56±38.66 | –5.42 | 0.0001*** |
| Direct LDLc (mg/dL) | 91.73±16.78 | 118.56±19.4 | –6.812 | 0.0001*** |
| Small dense LDLc (mmol/L) | 0.659±0.175 | 0.885±0.15 | –6.397 | 0.0001*** |
| Troponin T (ng/mL) | 0.0059±0.01 | 0.06757±0.1 | –3.856 | 0.0002*** |
Student’s t-test: Numerical data are expressed as mean±standard deviation, ***Extremely significant. TC: Total cholesterol, LDLc: Low-density lipoprotein, HDLc: High-density lipoprotein
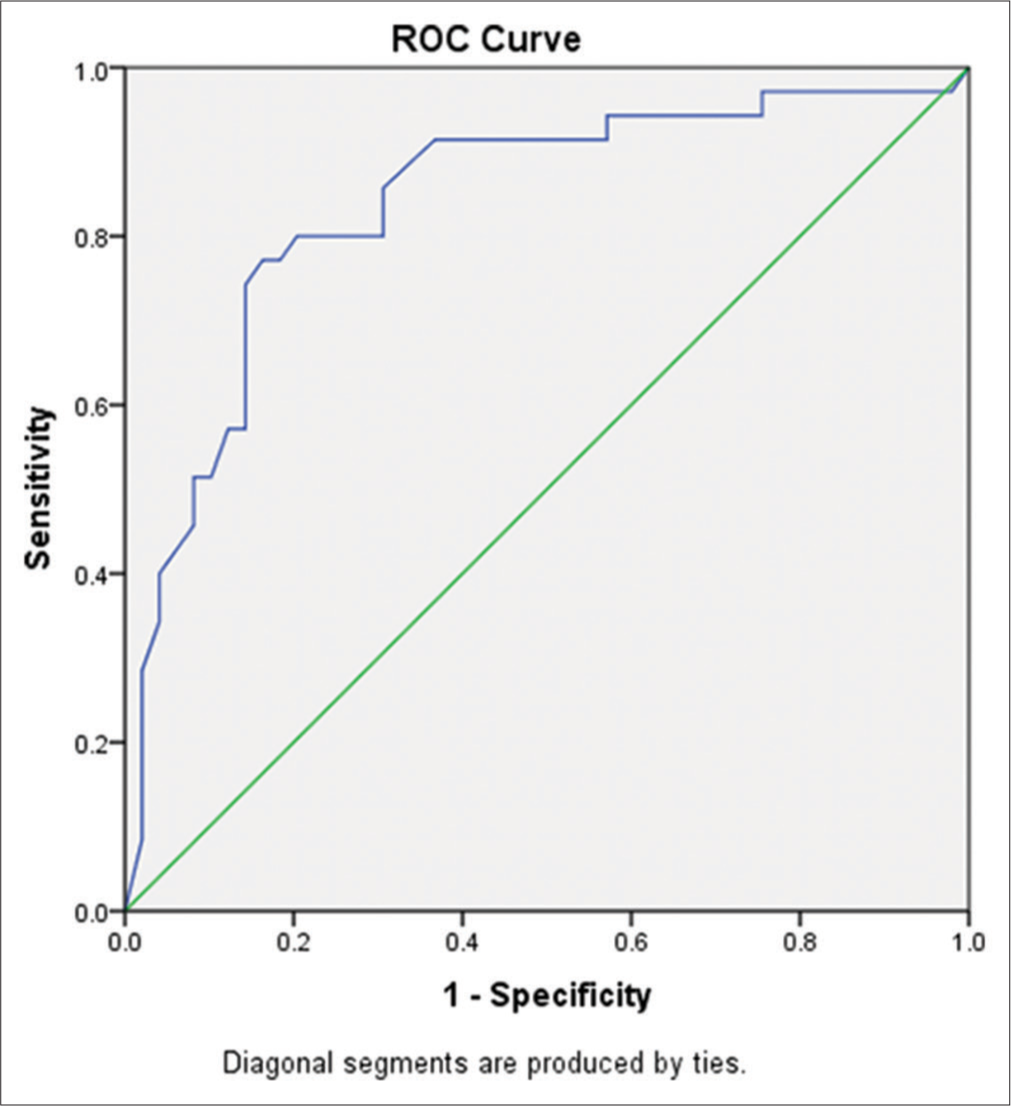
As in Table 5, the correlation of troponin T, HGS, gait, and WC with the anthropometric measurements and biochemical analytes were significant. The diagnostic performance was assessed with a comparison of the receiver’s operating characteristic curve of the markers of sarcopenic obesity. Table 6 represent the Receiver’s operating characteristic [ROC] diagnostic sensitivity and specificity with cut-off values and area under the curve of Troponin T, gait, hand grip strength, gait [Figure 1] and waist circumference [Figure 2].
| Parameters | r-value | P-value | r-value | P-value | r-value | P-value | r-value | P-value |
|---|---|---|---|---|---|---|---|---|
| Troponin T | Hand grip strength | Gait | WC | |||||
| Weight (cm) | 0.573 | 0.000*** | –0.872c | 0.000*** | 0.750 | 0.000*** | 0.68c | 0.000*** |
| Height (mt) | –0.96 | 0.000*** | 0.533c | 0.000*** | –0.451b | 0.000*** | -0.364b | 0.001** |
| BMI | –0.482b | 0.000*** | –0.944c | 0.000*** | 0.822c | 0.000*** | 0.719c | 0.000*** |
| WC (cm) | 0.574 | 0.000*** | –0.644c | 0.000*** | 0.606c | 0.000*** | 1.00c | 0.000*** |
| HC (cm) | 0.53 | 0.000*** | –0.592c | 0.000*** | 0.553c | 0.000*** | 0.834c | 0.000*** |
| WHR | –0.91 | 0.000*** | –0.1a | 0.37 (NS) | 0.085a | 0.44 (NS) | 0.29a | 0.011* |
| WC/Ht ratio | –0.81 | 0.000*** | 0.309b | 0.021* | 0.288a | 0.011* | 0.248a | 0.023* |
| PAI | –0.401b | 0.002** | 0.746c | 0.000*** | –0.611c | 0.000*** | –0.625c | 0.000*** |
| TC (mg/dL) | 0.688 | 0.000** | –0.639c | 0.000*** | 0.418b | 0.000*** | 0.502c | 0.000*** |
| TGL (mg/dL) | 0.806 | 0.000*** | –0.802c | 0.000*** | 0.617c | 0.000*** | 0.596 c | 0.000*** |
| HDLc (mg/dL) | –0.574 | 0.000*** | 0.828c | 0.000*** | –0.77c | 0.000*** | –0.545 c | 0.000*** |
| Non-HDLc (mg/dL) | –0.131a | 0.23 (NS) | –0.682c | 0.000*** | 0.472b | 0.000*** | 0.525c | 0.000*** |
| dLDLc (mg/dL) | 0.586 | 0.000*** | –0.721c | 0.000*** | 0.525c | 0.000*** | 0.564c | 0.000*** |
| sdLDLc (mmol/L) | 0.476b | 0.000*** | –0.683c | 0.000*** | 0.473b | 0.000*** | 0.526c | 0.000*** |
Pearson correlation: aSmall (0.1–0.3), bMedium (0.3–0.5), cStrong (0.5–1.0) correlation. *P<0.05 is statistically significant. NS stands for ‘not significant’. **Significant, ***Extremely significant. WC: Waist circumference, HC: Hip circumference, WHR: Waist hip ratio, WC/Ht: Waist circumference/height ratio, PAI: Physical activity index, TGL: Triglycerides, HDL: High-density lipoprotein, dLDL: Direct low-density lipoprotein, sd LDLc: Small dense low-density lipoprotein, HDLc: High-density lipoprotein, BMI: Body mass index, TC: Total cholesterol
| Markers | Cut-off value | Sensitivity (%) | Specificity (%) | AUC | Significance |
|---|---|---|---|---|---|
| Troponin T (ng/mL) | 0.0046 | 67% | 37% | 0.772 | 0.0001*** |
| Gait (sec) | 8.66 | 82% | 37% | 0.761 | 0.0001*** |
| Hand grip strength | 11.2 | 83% | 51% | 0.839 | 0.0001*** |
| Waist circumference (cm) | 80.5 | 97% | 91% | 0.76 | 0.0001*** |
Area under curve (AUC): At 95% confidence interval, ***0.8–0.9: Considered excellent, s>0.9: outstanding

- Receiver’s operating characteristic (ROC) curve of troponin T, gait, and hand grip strength in participants with sarcopenic and non-sarcopenic obesity.
- Receiver’s operating characteristic (ROC) curve of waist circumference in participants with sarcopenic and non-sarcopenic obesity.
DISCUSSION
In normal individuals, muscle mass, strength, and function peak between 30 and 40 years of age and then gradually decline.
This condition is called sarcopenia. In elderly individuals, there is a subgroup that exhibits an imbalance between muscle mass and fat mass, a condition called sarcopenic obesity.
Ageing and sarcopenic obesity
Age-related changes in body composition make elderly individuals more prone to metabolic issues such as increased insulin resistance and glucose intolerance, which increases their risk of developing CVD. The mean age of women with sarcopenic obesity was 61 years. However, inter-individual variability is to be noted with decreased components of total energy expenditure such as resting metabolic rates, reduced thermic effect of food, and physical activity drives to fat buildup.[13]
Age causes body fat to rise and muscle mass to decline; therefore, weight gain is primarily made up of fat rather than lean muscle mass. Recently the term Dynapenic abdominal obesity has been coined to address the low muscle strength and obesity. Individuals with sarcopenic obesity have high risks of developing physical disability, associated health impairment, and hospitalisation.[14]
Sex and sarcopenic obesity
In menopausal women, there is increased body weight and fat mass, especially visceral adiposity. In this study, body weight and WC were found to be elevated in sarcopenic obese women it’s due to a shift in fat deposition to the centre of the body. Normally, oestrogen can attenuate fat deposition by modulating inflammation in skeletal muscle through satellite cell activation.[15]
WC and sarcopenic obesity
Increased WC represents the accumulated visceral fat, which highlights the deleterious effects of visceral fat related inflammation. Our study suggests that postmenopausal women with increased WC, HC, and WC/Ht ratio indicate a proinflammatory state with the release of adipose tissue adipokines, which augment obesity-induced inflammation and insulin resistance, which, in turn, promotes sarcopenia through muscle degradation.[16] Age-related progressive increases in visceral adiposity with a decline in skeletal muscle mass, muscle strength, and function support sarcopenic obesity.[17] In this study, a strong correlation of WC with total cholesterol, LDLc, and small dense LDLc reveals the unfavourable lipidaemic status in sarcopenic obese women.
HGS and sarcopenia
Sarcopenia is a myopathy caused by unfavourable changes with loss of muscle mass and function. Circulatory factors such as irisin, myonectin, and myostatin are regulated by excess contraction. Menopause is associated with various changes in body composition that include increased adipose tissue mass. The predominant change is a reduction in the fat-free mass index, which translates into decreased muscle 5contraction strength.[18] This concept is well documented in this study, as revealed by decreased HGS in postmenopausal with sarcopenic obesity. Physical activity index was observed to be decreased in sarcopenic obese postmenopausal. It substantiates the cross-talk between adipose tissue and skeletal muscle, which drives the proinflammatory environment in skeletal muscle which, in turn, is the contributor to the development of insulin resistance.[19]
Troponin T and sarcopenia
In this present study, troponin T levels were found to be high normal in sarcopenic obesity compared to non-sarcopenic postmenopausal women. Research studies have identified myokines that established skeletal muscle as an endocrine organ and the technical imbalance between intramuscular adipose tissue and muscle mass.[20] Myostatin is a negative regulator of muscle mass, which has been associated with muscle sarcopenia, where increased levels of myostatin were found. There is evidence that myostatin inhibition has been explained as therapeutic potential to combat muscle atrophy.[21]
Lipid status and sarcopenia
Growing evidence implicates adipocytes as the root cause of the negative health effects. It has been revealed in this study the proinflammatory milieu backups the environment with dyslipidaemia characterised by elevation of small dense LDLc (sdLDLc) levels in sarcopenic obese postmenopausal women. Furthermore, a significant correlation was documented with visceral adiposity and sdLDLc. Circulating sdLDLc has greater atherogenic potential, which undergoes modification to increase atherogenicity. This modified sdLDLc is a potent indicator of the inflammatory process leading to CVD. This study established the need for sdLDLc evaluation and correction in clinical practice.[22]
The diagnostic performance of the analyte of interest was identified to have better diagnostic sensitivity with waist circumference, HGS, and gait compared to troponin T; 97% (area under the curve [AUC] 0.76), 83% (AUC 0.839), 82% (AUC 0.76) and 67% (AUC 0.772), respectively. Thus, the study derived the measurement of waist circumference, HGS, and gait as diagnostic tools of sarcopenic obesity in clinical settings, which are cost-effective.
Limitations of the study include the challenge of not performing body composition analysis in post-menopausal women. Furthermore, skeletal fat mass as per the body compartment was not done. This can be considered as a future scope of research work to stratify sarcopenic obesity with and without complications.
CONCLUSION
Sarcopenic obesity appears to increase the risk of CVD. The growing challenge is to define and identify postmenopausal women with sarcopenic obesity. This study aids in designing the potential strategies to address women with sarcopenic obesity and facilitate improvement of quality of life. Nonpharmacologic interventions can assist in lowering the likelihood of sarcopenic obesity. Interventions are useful in reducing the risk of sarcopenic obesity. Further studies are needed for novel specific treatment strategies which are lacking in clinical settings.
Ethical approval
The research study protocol was maintained as per the Institutional Ethics Committee [IEC/8445/2022]. This research work is an ICMR-STS project Ref ID: 2022-04188.
Declaration of patient consent
The authors certify that they have obtained all appropriate patient consent.
Conflicts of interest
There are no conflicts of interest.
Use of artificial intelligence (AI)-assisted technology for manuscript preparation
The authors confirm that there was no use of artificial intelligence (AI)-assisted technology for assisting in the writing or editing of the manuscript and no images were manipulated using AI.
Financial support and sponsorship
Nil
References
- The prevalence of sarcopenic obesity in community-dwelling healthy Indian adults-the Sarcopenic Obesity-Chandigarh Urban Bone Epidemiological Study (SO-CUBES) Osteoporos Sarcopenia. 2021;7:24-9.
- [CrossRef] [PubMed] [Google Scholar]
- Sarcopenia in Asia: Consensus report of the Asian Working Group for Sarcopenia. J Am Med Dir Assoc. 2014;15:95-101.
- [CrossRef] [PubMed] [Google Scholar]
- Skeletal muscle troponin as a novel biomarker to enhance assessment of the impact of strength training on fall prevention in the older adults. Nurs Res. 2014;63:75-82.
- [CrossRef] [PubMed] [Google Scholar]
- Grip and Pinch strength in relation to anthropometric data in adults. J Orthop Res Physiother. 2018;4:39.
- [CrossRef] [Google Scholar]
- Sarcopenia: A contemporary health problem among older adult populations. Nutrients. 2020;12:1293.
- [CrossRef] [PubMed] [Google Scholar]
- Role of skeletal muscle in insulin resistance and glucose uptake. Compr Physiol. 2020;10:785-809.
- [CrossRef] [PubMed] [Google Scholar]
- High body fat and low muscle mass are associated with increased arterial stiffness in Asian Indians in North India. J Diabetes Complications. 2015;29:38-43.
- [CrossRef] [PubMed] [Google Scholar]
- The FNIH sarcopenia project: rationale, study description, conference recommendations, and final estimates. J Gerontol Ser A Biol Sci Med Sci. 2014;69:547-58.
- [CrossRef] [PubMed] [Google Scholar]
- Association between sarcopenic obesity and falls in a multiethnic cohort of postmenopausal women. J Am Geriatr Soc. 2018;66:2314-20.
- [CrossRef] [PubMed] [Google Scholar]
- Correlation of sarcopenic obesity on various cardiometabolic risk factors and fracture risk in mid-aged Korean women. J Menopausal Med. 2023;29:58-65.
- [CrossRef] [PubMed] [Google Scholar]
- Prevalence of hand osteoarthritis and its relationship to hand pain and grip strength in Japan: The third survey of the ROAD study. Mod Rheumatol. 2016;26:767-73.
- [CrossRef] [PubMed] [Google Scholar]
- Performance of the EWGSOP2 cut-points of low grip strength for identifying sarcopenia and frailty phenotype: A cross-sectional study in older inpatients. Int J Environ Res Public Health. 2021;18:3498.
- [CrossRef] [PubMed] [Google Scholar]
- Physical activity energy expenditure and sarcopenia in black South African urban women. J Phys Act Health. 2016;13:296-302.
- [CrossRef] [PubMed] [Google Scholar]
- Dynapenic abdominal obesity is associated with mild cognitive impairment in patients with cardiometabolic disease: A cross-sectional study. BMC Geriatr. 2022;22:255.
- [CrossRef] [PubMed] [Google Scholar]
- Sarcopenia and muscle aging: A brief overview. Endocrinol Metab. 2020;35:716-32.
- [CrossRef] [PubMed] [Google Scholar]
- Fat mass changes during menopause: A meta-analysis. Am J Obstet Gynecol. 2019;221:393-409.
- [CrossRef] [PubMed] [Google Scholar]
- Dynapenic abdominal obesity and the effect on long-term gait speed and falls in older adults. Clin Nutr. 2022;41:91-6.
- [CrossRef] [PubMed] [Google Scholar]
- Health risks associated with high waist circumference: A systematic review. J Public Health Res. 2020;9:1811.
- [CrossRef] [PubMed] [Google Scholar]
- The age-related loss of skeletal muscle mass and function: Measurement and physiology of muscle fibre atrophy and muscle fibre loss in humans. Ageing Res Rev. 2018;47:123-32.
- [CrossRef] [PubMed] [Google Scholar]
- Myostatin as a mediator of sarcopenia versus homeostatic regulator of muscle mass: Insights using a new mass spectrometry-based assay. Skelet Muscle. 2015;5:21.
- [CrossRef] [PubMed] [Google Scholar]
- Exercise mimetics: Impact on health and performance. Cell Metab. 2017;25:242-7.
- [CrossRef] [PubMed] [Google Scholar]
- Small dense low-density lipoprotein as biomarker for atherosclerotic diseases. Oxid Med Cell Longev. 2017;2017:1273042.
- [CrossRef] [PubMed] [Google Scholar]


