
Translate this page into:
Short-term feeding of high-fat diet induces neuroinflammation and oxidative stress in arcuate nucleus in rats
*Corresponding author: Ritesh Kumar Netam, Department of Physiology, All India Institute of Medical Sciences, New Delhi, Delhi, India. ritesh.n.1912@gmail.com
-
Received: ,
Accepted: ,
How to cite this article: Netam RK. Short-term feeding of high-fat diet induces neuroinflammation and oxidative stress in arcuate nucleus in rats. Indian J Physiol Pharmacol. 2024;68:126-34. doi: 10.25259/IJPP_627_2023
Abstract
Objectives:
This study aimed to compare the effects of high-fat diet-induced neuroinflammation and oxidative stress in the arcuate nucleus (ARC) of obese-prone and obese-resistant rats.
Materials and Methods:
Rats were divided into obese-prone and obese-resistant groups based on their initial body weight. They were then fed either a 5% or 60% fat-containing diet. In the ARC, the expression of inflammatory markers [Interleukin (IL-6); Nuclear Factor Kappa-B Inhibitor Alpha (NFKBIA); Cluster of Differentiation (CD)-66; and mucin-like hormone receptor-like 1 (EMR-1)], as well as levels of reactive oxygen species (ROS) and antioxidant enzymes (glutathione and glutathione peroxidase and superoxide dismutase), was assessed along with body weight, blood glucose, Homeostatic Model Assessment for Insulin Resistance, plasma insulin and plasma leptin levels after ten days of intervention.
Results:
The results showed a significantly higher expression of inflammatory markers in the ARC of high-fat diet-induced obese rats after ten days. Body weight, plasma insulin, plasma leptin and hydrogen peroxide production were also significantly higher in obese-prone rats fed a high-fat diet.
Conclusion:
In conclusion, this study demonstrates that short-term consumption of a high-fat diet can lead to hypothalamic inflammation and ROS production in the ARC of rats. Obese-prone rats exhibited hyperinsulinaemia and hyperleptinaemia after short-term high-fat diet consumption.
Keywords
Hypothalamic inflammation
Insulin resistance
Leptin
Microglia
Obesity
Oxidative stress

INTRODUCTION
Obesity has emerged as a significant public health concern globally, characterised by a dramatic rise in prevalence over the past few decades. This increase is attributed to the widespread availability of energy-dense foods and a sedentary lifestyle, leading to a tripling of obesity rates since 1975. The rise in obesity is not limited to developed countries but is also observed in both rural and urban areas of developing nations.[1] The pathogenesis of obesity is complex, influenced largely by genetic and environmental factors. While human studies have contributed significantly to our understanding of obesity, the limitations of such studies have led to the extensive use of rodent models, particularly rats and mice, in obesity research.[2] These animal models have provided valuable insights into the role of genetic factors in body weight regulation, mirroring observations seen in humans where individuals exhibit varying rates of weight gain.
Weight gain is associated with an increase in inflammatory macrophages in adipose tissue, leading to elevated levels of inflammatory cytokines and chemokines in the blood, a condition known as chronic peripheral inflammation in obesity. These inflammatory mediators, including interleukin-1 beta (IL-1b), interleukin-6 (IL-6) and tumour necrosis factor-alpha (TNF-alpha), disrupt insulin action in tissues, contributing to insulin resistance. This phenomenon is particularly pronounced in obese-prone rats, impacting the action of leptin in the hypothalamus.[3,4] Leptin, a hormone produced by adipose tissue, plays a crucial role in regulating food intake by acting on the hypothalamus via the ObRb receptor. Activation of this receptor stimulates both orexigenic and anorexigenic neuronal circuits, thereby regulating food intake. Amongst the various nuclei of the hypothalamus, the arcuate nucleus (ARC) is of particular importance in food intake regulation. It contains neurons producing pro-opiomelanocortin (POMC) and agouti-related protein (AgRP), as well as neuropeptide Y, which senses peripheral signals such as glucose, insulin, leptin and PYY.[5]
In adipose tissue, the accumulation of excess fatty acids can lead to hypoxia and increased lipid accumulation in macrophages.[6] Recent studies suggest that similar to peripheral inflammation, increased levels of inflammatory cytokines such as IL-1b, IL-6 and TNF-a are found in the hypothalamus.[7] However, the mechanism of hypothalamic inflammation is not yet fully understood. The balance between reactive oxygen species (ROS) and antioxidants is crucial, as ROS can react with lipids, proteins and nucleic acids, leading to their accumulation in macrophages’ mitochondria and cytoplasm. This accumulation can convert anti-inflammatory macrophages to inflammatory ones.[8] High-fat diet-induced obese mice have shown significant oxidative damage, while oestrogen has demonstrated protective effects against this damage due to its antioxidant properties in female mice.[9,10] Consequently, oxidative stress has been implicated in hypothalamic inflammation and neuronal apoptosis in high-fat diet-induced obese rat models. Most studies related to high-fat diet-induced obesity (DIO) have administered the diet for more than one month, and it is not yet known whether short-term feeding of a high-fat diet can lead to hypothalamic inflammation.[11,12]
In our study, we aimed to investigate the effects of short-term high-fat diet consumption on neuroinflammation and oxidative damage in the ARC of rats, particularly focusing on the role of genetic predisposition to obesity. While existing studies, such as those,[13-15] have explored inflammation and synaptic reorganisation in rodents with a genetic predisposition to DIO, there remains a need for a more comprehensive biochemical method for confirming this predisposition.
Many studies have traditionally classified rodents as either vulnerable or resistant to obesity based solely on differential rates of weight gain. However, this approach lacks a detailed understanding of the underlying mechanisms that contribute to these phenotypes. Our study sought to address this gap by proposing the use of the oral glucose tolerance test (OGTT) and the Homeostatic Model Assessment for Insulin Resistance (HOMA-IR) score as a potential indicator of vulnerability or resistance to obesity progression in rodents, regardless of the diet given.
Therefore, this study aimed to assess and compare the levels of inflammatory cytokines and oxidative stress markers in the ARC using a comprehensive biochemical method to confirm this predisposition after ten days of high-fat diet feeding in rats. Our findings demonstrate that short-term feeding of a high-fat diet can indeed lead to neuroinflammation and oxidative damage in the ARC within a relatively short time frame of 10 days.
MATERIALS AND METHODS
Experimental model and feeding protocol
The study was conducted on male Wistar rats to investigate neuroinflammation and oxidative stress following exposure to a high-fat diet for ten days. The experimental protocol was approved by the Institutional Animal Ethics Committee (IAEC) of the All India Institute of Medical Sciences, New Delhi (15/IAEC-1/2017), and all experiments were conducted in accordance with guidelines set by the Committee for the Purpose of Control and Supervision of Experiments on Animals, Govt. of India, and the National Institute of Health (NIH) Guidelines for the Care and Use of Laboratory Animals (NIH Publication no. 85723, revised 1996). Efforts were made to minimise the number of animals used and their suffering.
Thirty male Wistar rats weighing 230–240 g were procured from the Central Animal Facility of the All India Institute of Medical Sciences (AIIMS), New Delhi. To induce obesity, the rats were initially fed a normal chow diet for four weeks. Subsequently, based on their body weight (mean body weight ± 1.96), the rats were divided into four groups: normal diet obese resistant (NDOR), normal diet obese (NDO), high-fat diet obese (HFDO) and high-fat diet obese resistant (HFDOR). In addition, six rats were used as controls. Rats in the high-fat diet groups were fed a high-fat diet (purchased from Research Diet, USA, containing 20% carbohydrate, 20% protein and 60% fat) for ten days, while the other groups and the control group were given a normal chow diet (Ashirwad Pvt. Ltd., India, containing protein: 24%, fat: 5%, fibre: 4%, carbohydrates: 55%, calcium: 0.6% and phosphorus: 0.3%) for the same duration. Food and water were provided ad libitum.
All animals were acclimatised for at least one week after arrival at the animal house of the Department of Physiology, AIIMS, New Delhi, India. The rats were housed in a temperature-controlled environment (21–22°C) with a 12-h light/dark cycle (lights on 0700–1900). Body weight and food intake were monitored for ten days. For glucose, insulin and leptin estimation, blood samples were collected after 12 h of fasting from the retro-orbital veins into ethylenediaminetetraacetic acid tubes for leptin estimation. Plasma glucose was assayed from tail blood using a glucometer (Accuchek AVIVA, Roche Diabetes Care). Plasma insulin and leptin levels were estimated using a rat enzyme-linked immunosorbent assay kit from Bio BioAssay Technology Laboratory, Shanghai, China. The Homeostatic Model Assessment (HOMA) score was calculated using the formula: fasting insulin (microU/L) × fasting glucose (nmol/L)/22.5.
OGTT
After a 12-h fast, glucose tolerance testing was performed by administering a bolus of oral glucose (5 g/kg body weight, 50% dextrose solution and 1 mL solution). Blood glucose levels were measured from the tail tip at 0, 30, 60 and 120-min intervals using a glucometer (Accucheck AVIVA, Roche Diabetes Care). OGTT data were compared using the area under the curve derived by the trapezoid method.
Real-time polymerase chain reaction (PCR)
After ten days, the rats were anaesthetised with ether and perfused transcardially with cold 0.9% saline. Then, brains were immediately removed, and the diencephalon was dissected out in three coronal sections. The first coronal section is anterior to the optic chiasma; the second coronal section is posterior to the posterior border of the mammillary bodies, and the third coronal section is made in the middle of the optic tract, just rostral to the infundibulum. Then, the remaining part is divided into two parts, in which the posterior part is identified as the ARC nucleus and isolated and immersed in liquid nitrogen immediately[16] and stored in phosphate-buffered saline at −80°C for RNA extraction. For mRNA expression analysis, RNA was extracted from the ARC using TRIzol reagent (INVITROGEN Thermo Fisher Scientific) according to the manufacturer’s instructions. RNA purity was assessed by spectrophotometry at 260/280 nm (Nanodrop, Thermo Scientific), and reverse transcription was performed using a semi-quantitative real-time PCR system (CFX96 Touch Real-Time PCR Detection System, Life Science Research BioRad). The purity of RNA was considered valid if the ratio of A234.9/A280 was in the range of 1.8 to 2.0. GAPDH was used as an internal control to normalise the gene expression of IL-6, Nfkbia, CD-68 and EMR-1. The primer sequences were as follows: Nfkbia forward, TGCCTGGCCAGTGTAGCAGTCTT, reverse, CAAAGTCACCAAGTGCTCCACGAT; rat Il-6 forward, CAGAGGATACCACCCACAACAGA, reverse, CAGTGCATCATCGCTGTTCATACA; rat Emr-1 forward, AATCGCTGCTGGCTGAATACGG, reverse, CCAGGCAAGGAGGGCAGAGTT; Cd68 forward, CTTCCCACAAGCAGCACAG, reverse, AATGATGAGAGGCAGCAAGAGA; GAPDH forward, AACGACCCCTTCATTGAC, reverse, TCCACGACATACTCAGCAC. The PCR percentage efficiency calculation yielded a value of 92.7%, indicating the robustness of our experimental approach. The regression equation for the calibration curve was y = −3.5229x + 40.413, where y represents the Ct value and x represents the log complementary DNA (cDNA) copies per mL. The regression coefficient (R2) for the curve was 0.9968, indicating a strong correlation between the log cDNA copies per mL and the Ct values.
Quantification of Oxidative stress markers
Immediately after exposing the brain, tissue pieces were immersed in liquid nitrogen and stored at −80°C. Tissue homogenates were prepared by mixing with 5% metaphosphoric acid, followed by centrifugation (1,500 g, 10 min, 4°C). Glutathione (GSH) and glutathione peroxidase (GPx) levels were estimated using a colorimetric method described.[17-19]
Superoxide dismutase (SOD) activity was measured indirectly using the SOD assay kit from Sigma Aldrich (Cat no.19160) with the WST formazan reagent. Hydrogen peroxide (H2O2), a ROS, was estimated using the peroxide assay kit from Sigma Aldrich (Cat no. MAK311) following the manufacturer’s instructions.
Statistical analysis
The data were expressed as mean ± standard deviation (SD) or median (interquartile range) based on the normality of the distribution. Group comparisons were conducted using GraphPad Prism 9 software. The normality of distribution was assessed using the Shapiro–Wilk test. For normally distributed data, comparisons were made using ordinary one-way analysis of variance (ANOVA) with multiple comparisons by parametric Tukey’s multiple comparisons test. For non-normally distributed data, the Kruskal– Wallis test was used. A two-way ANOVA was employed to detect interactions between genotype and diet intervention for the glucose tolerance test. Significance levels were set at *P < 0.05, **P < 0.01, ***P < 0.001 and ****P < 0.0001.
RESULTS
Effect of high-fat diet on body weight and biochemical parameter
The body weight of all groups of rats was compared at the end of ten days, revealing a significantly higher body weight (P < 0.001) in the HFDO group (296.3 ± 2.6 g) compared to other groups. The HFDO group also showed significant weight gain compared to the NDO rats (263.8 ± 4.1 g) and NDOR rats (255 ± 5 g) [Figure 1a]. Plasma blood glucose levels showed a trend towards increase in the HFDO group compared to other groups, but this difference was not statistically significant (NDOR: 76.75 ± 9, NDO: 91.33 ± 3.79, HFDOR: 95.50 ± 26.51 and HFDO: 103 ± 9.2) [Figure 1b]. In the OGTT, no significant increase in plasma glucose was observed in the HFDO group compared to other groups at 30, 60 and 120 minutes after glucose solution feeding. Similarly, the area under the curve of OGTT did not show any significant difference in the HFDO group compared to other groups (control: 269.92 ± 25.01, NDOR: 266.12 ± 34.95, NDO: 275 ± 10.9, HFDOR: 294 ± 13.03 and HFDO: 299.56 ± 34.67) [Figures 1c and d].
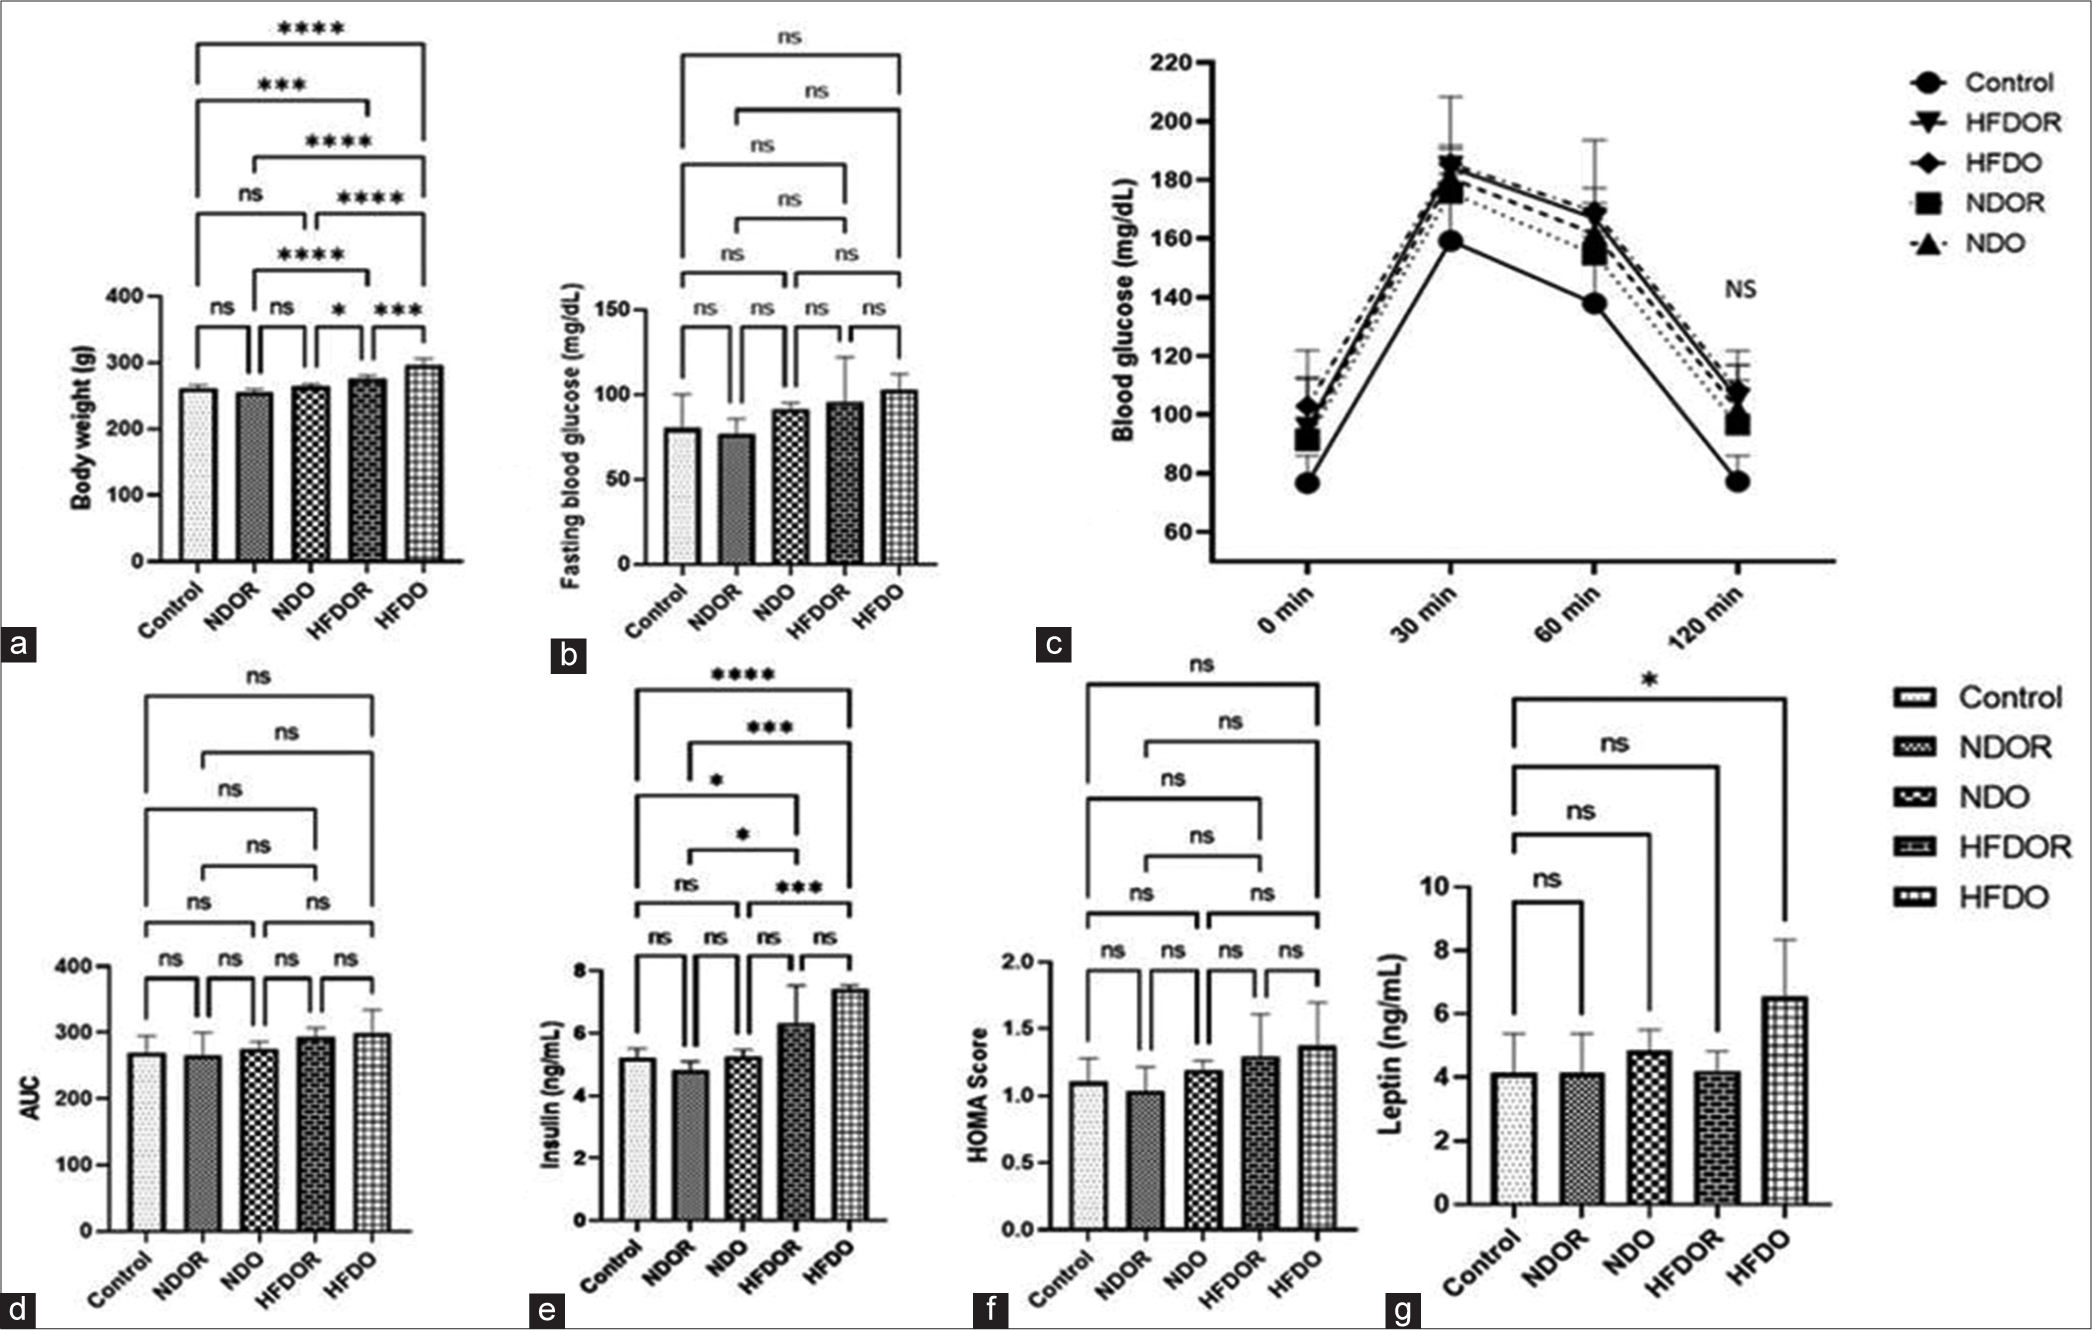
- Effect of high-fat diet on body weight and biochemical parameter: (a) Body weight (b) fasting blood glucose (c) OGTT (d) AUC of OGTT (e) fasting plasma insulin (f) HOMA-IR (g) Plasma Leptin Data expressed in Mean ± SD or Median (range); n = 4–7/group, analysed by Linear Mixed Effects Model (LME), unpaired t-test in R. (*P < 0.05, ***P < 0.001, ****P < 0.0001). OGTT: Oral glucose tolerance test, AUC: Area under the curve fasting, HOMA-IR: Homeostatic Model Assessment for Insulin Resistance, SD: Standard deviation, NDOR: Normal diet obese resistant, NDO: Normal diet obese, HFDOR: High-fat diet obese resistant, HFDO: High-fat diet obese, ns: not significant.
Overall, these results suggest that short-term consumption of a high-fat diet leads to increased body weight and trends towards alterations in plasma glucose levels, insulin levels and glucose tolerance, although these changes did not reach statistical significance within the 10-day period of observation.
Plasma insulin level did not show any significant difference amongst the groups (control: 5.2 ± 0.32, NDOR: 2.68 ± 0.85 NDO: 1.75 ± 0.72, HFDOR: 3.88 ± 1.82 and HFDO: 0.69 ± 0.48). from plasma glucose and insulin [Figure 1e], HOMA score were derived for all the groups which did not showed any significant difference amongst the groups (Plasma insulin, Control: 5.1 ± 0.31, NDOR: 4.8 ± 0.27, NDO:5.2 ± 2.22, HFDOR: 6.3 ± 1.2, HFDO: 7.4 ± 0.09) (HOMA, Control: 1.11 ± 0.18, NDOR: 1.04 ± 0.18, NDO:1.19 ± 0.07, HFDOR: 1.29 ± 0.32, HFDO: 1.37 ± 0.33) [Figure 1f]. We found a significantly higher level of plasma leptin level in the high fat obese prone group as compared to control rats. (Control: 0.45± 0.097, NDOR: 041 ± 0.12, NDO: 0.48± 0.06, HFDOR: 0.42 ± 0.06 and HFDO: 0.65 ± 0.17) [Figure 1g].
Effect of high-fat diet on ROS and antioxidant production in ARC
Hyperlipidaemia can lead to the activation of microglia and other inflammatory cells in the brain, resulting in the production of inflammatory cytokines and oxidative stress. To assess this effect, we measured the levels of ROS (H2O2) and antioxidants (GPx, catalase and SOD) in the ARC. We observed a significant increase (P < 0.01) in H2O2 production in HFDO rats compared to NDOR, NDO and HFDOR rats (control: 61.01 ± 8.91, NDOR: 57.23 ± 7.4, NDO: 62.2 ± 9.02, HFDOR: 61.93 ± 20.48 and HFDO: 90.88 ± 10.08). We did not find any significant change in antioxidant levels amongst the groups for SOD and GSH. However, we did observe a significant decrease in GPx production in the ARC of HFDO rats compared to NDOR rats (for GPx, control: 2.71 ± 1.79, NDOR: 2.68 ± 0.85, NDO: 1.75 ± 0.72, HFDOR: 3.88 ± 1.82 and HFDO: 0.69 ± 0.48), (for SOD, control: 8.75 ± 2.2, NDOR: 10.30 ± 2.78, NDO: 7.56 ± 0.90, HFDOR: 6.48 ± 0.70, HFDO: 6.48 ± 1.92) and (for GSH, control: 26.17 ± 6.19, NDOR: 24.39 ± 8.76, NDO: 27.96 ± 2.09, HFDOR: 30.48 ± 13.55 and HFDO: 36.31 ± 15.81) [Figure 2a-d].
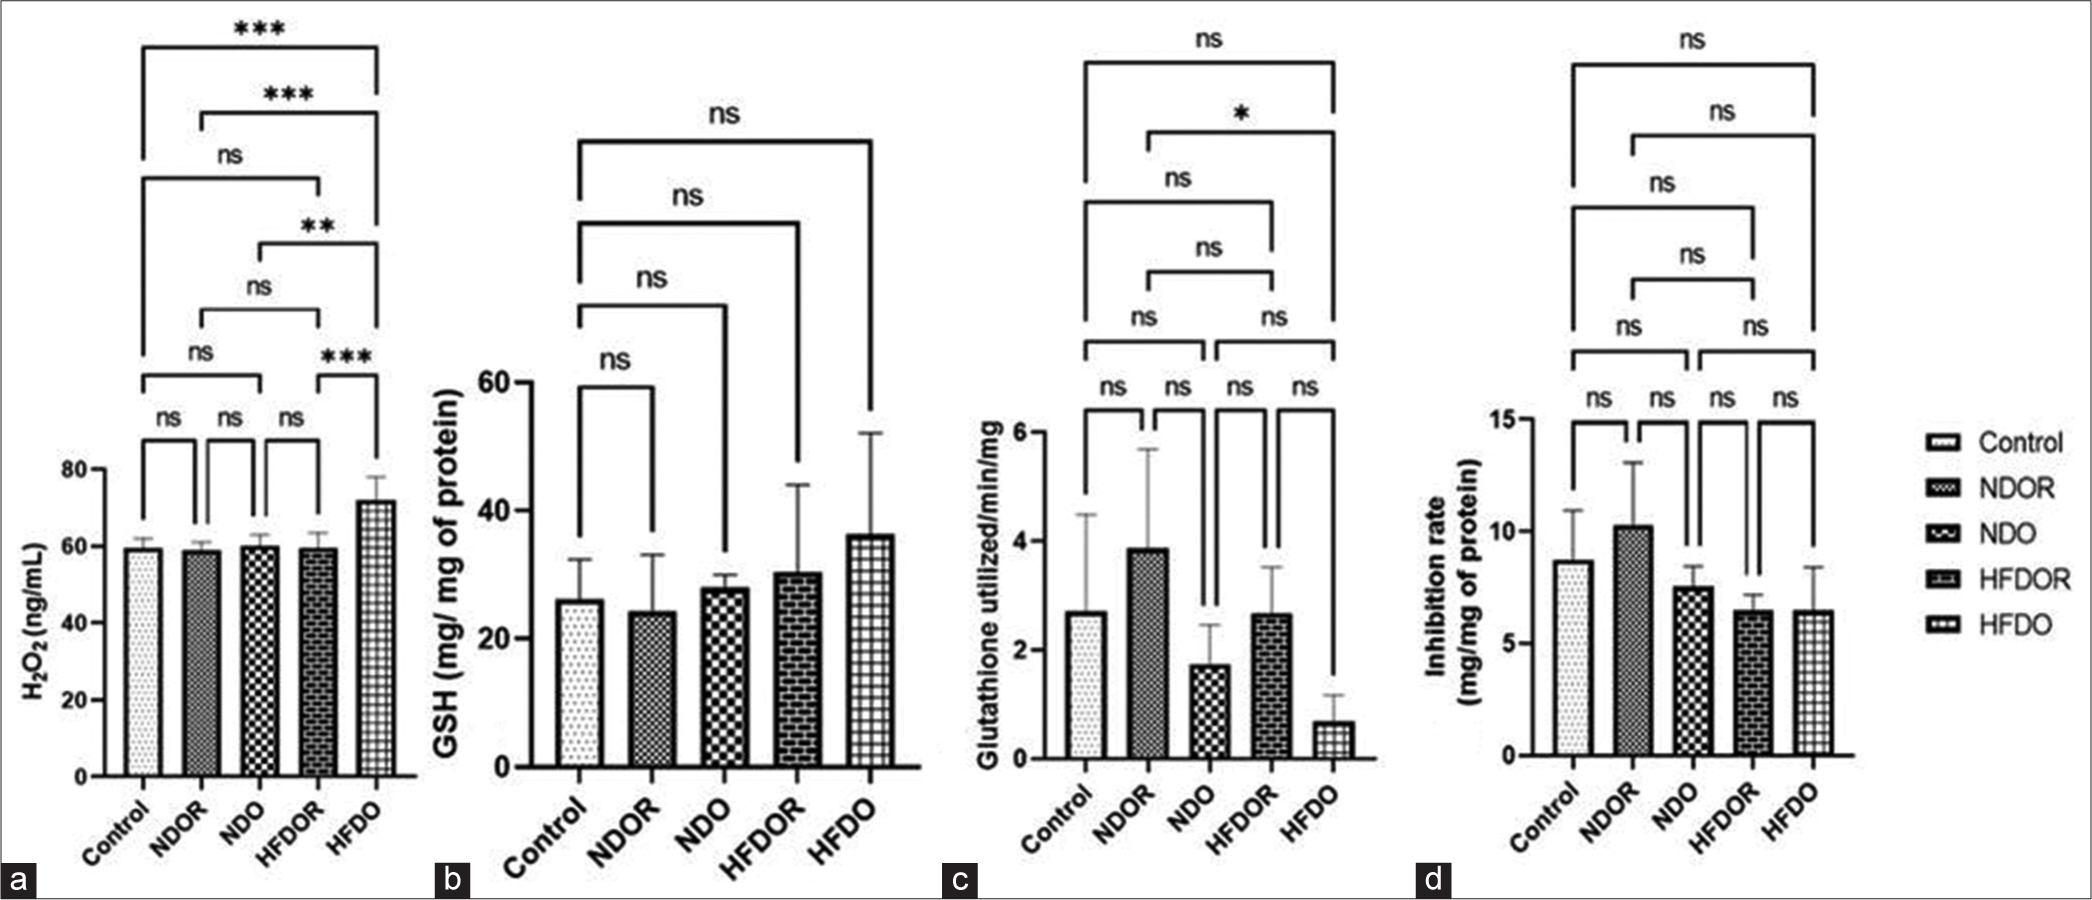
- Effect of high-fat diet on oxidative stress parameters: (a) H2O2 production (b) GSH activity (c) GPx activity (d) SOD production Data expressed in Mean ± SD; n = 4–7/group, analysed by mixed linear models (lme), unpaired t-test in R. (*P < 0.05, **P < 0.01, ***P < 0.001). H2O2: Hydrogen peroxide, GSH: Glutathione, GPx: Glutathione peroxidase, SOD: Superoxide dismutase, SD: Standard deviation, NDOR: Normal diet obese resistant, NDO: Normal diet obese, HFDOR: High-fat diet obese resistant, HFDO: HIGH-fat diet obese, ns: not significant.
Effect of high-fat diet on inflammatory maker expression in ARC
Hyperglycaemia can lead to hyperlipidaemia and increased accumulation of lipid droplets in adipose tissue, attracting more macrophages to these sites. These macrophages engulf lipid droplets and transform into foam cells or inflammatory macrophages, leading to increased release of inflammatory cytokines. A similar mechanism occurs in microglia, leading to inflammation in the hypothalamus. To assess this, we compared the expression of inflammatory cytokines in the ARC. Primers for different inflammatory markers are listed in Table 1. We found significantly higher expression of IL-6 (P < 0.01) and Nfkbia (P < 0.01) in HFDO rats compared to NDOR rats (for IL-6, control: NDOR: 0.93 ± 0.10, NDO: 1.19 ± 0.05, HFDOR: 1.57 ± 0.23 and HFDO: 2 ± 0.14; for NFKBIA, control: 16.5 [15.84–17.72], NDOR: 16.99 [15.76– 19.96], NDO: 16.28 [15.3–16.5], HFDOR: 12.61 [11.53–14.87] and HFDO: 9.43 [6.14–12.49]) [Figure 3 a and b]. We also found a higher expression of CD-68 (P < 0.01) and EMR-1 (P < 0.01), suggesting increased microglial activity in the ARC (for CD-68, control: 7.69 [5.43–9.81], NDOR: 8.18 [7.4–9.98], NDO: 5.26 [4.78–5.65], HFDOR: 9 [7.87–9.8] and HFDO: 4.38 [3.3–5.04]) [Figure 3a-d]. To ensure the efficiency of PCR reactions, initially a Calibration curve of total RNA at different concentrations to set up RT PCR for expression analyses was generated [Figure 4].
| Gene | Forward primer | Reverse primer |
|---|---|---|
| IL-6 | CAGAGGATACCACCCACAACAGA | CAGTGCATCATCGCTGTTCATACA |
| Nfkbia | TGCCTGGCCAGTGTAGCAGTCTT | CAGAGGATACCACCCACAACAGA |
| CD-68 | CTTCCCACAAGCAGCACAG | AATGATGAGAGGCAGCAAGAGA |
| EMR-1 | AATCGCTGCTGGCTGAATACGG | CCAGGCAAGGAGGGCAGAGTT |
| Gapdh | AACGACCCCTTCATTGAC | TCCACGACATACTCAGCAC |
PCR: Polymerase chain reaction, IL-6: Interleukin-6; Nfkbia: Nuclear factor of kappa light polypeptide Gene Enhancer in B-cells inhibitor, alpha Protein; CD-68: Cluster of Differentiation-68; EMR-1: Epidermal Growth factor like module containing mucin-like hormone receptor 1; Gapdh: Glyceraldehyde-3-phosphate dehydrogenase.
![Effect of high-fat diet on inflammatory markers expression in arcuate nucleus: (a) IL-6 (b) Nfkbia (c) CD-68 (d) EMR-1 Data expressed in Mean ± SD; n = 4–7/group, analysed by mixed linear models (lme), unpaired t-test in R. All mRNA species were quantified relative to Gapdh housekeeping gene expression and are presented as fold changes relative to chow fed controls [fold chow] (*P < 0.05, **P < 0.01, ***P < 0.001, ****P < 0.0001). NDOR: normal diet obese resistant, NDO: normal diet obese, HFDOR: High-fat diet obese resistant, HFDO: High-fat diet obese, SD: Standard deviation, ns: not significant.](/content/114/2024/68/2/img/IJPP-68-126-g003.png)
- Effect of high-fat diet on inflammatory markers expression in arcuate nucleus: (a) IL-6 (b) Nfkbia (c) CD-68 (d) EMR-1 Data expressed in Mean ± SD; n = 4–7/group, analysed by mixed linear models (lme), unpaired t-test in R. All mRNA species were quantified relative to Gapdh housekeeping gene expression and are presented as fold changes relative to chow fed controls [fold chow] (*P < 0.05, **P < 0.01, ***P < 0.001, ****P < 0.0001). NDOR: normal diet obese resistant, NDO: normal diet obese, HFDOR: High-fat diet obese resistant, HFDO: High-fat diet obese, SD: Standard deviation, ns: not significant.
![Calibration curve for RT-PCR. (The regression coefficient [R2] for the curve is 0.9968). RT-PCR: Real-time polymerase chain reaction. Ct: Threshold cycle.](/content/114/2024/68/2/img/IJPP-68-126-g004.png)
- Calibration curve for RT-PCR. (The regression coefficient [R2] for the curve is 0.9968). RT-PCR: Real-time polymerase chain reaction. Ct: Threshold cycle.
DISCUSSION
Obesity is a chronic inflammatory condition in adipose tissue and the hypothalamus, which might be responsible for insulin resistance in the periphery and leptin resistance in the ARC due to short-term high-fat diet consumption. Could neuroinflammation be possible with short-term high-fat diet consumption in rats? With this question in mind, we designed this study, administering a 60% high-fat diet to rats, which were divided into four groups according to their initial body weight (HFDO, HFDOR, NDO, NDOR and control). Weight gain after ten days of the control diet and high-fat diet was significantly different amongst the groups. Weight gain was the highest in the high-fat diet obese group compared to the other groups, and there was a significant difference between NDOR, HFDOR and NDO, suggesting that genetic factors and high-fat diet have an additive effect on weight gain.[20] Susceptibility to obesity differs between humans and rats, which is why the high-fat diet-induced obese rat is a good model to study the interaction between genetic and environmental factors responsible for the pathogenesis of obesity, diabetes and other cardiovascular complications due to obesity. The high-fat diet obese-resistant rat showed significantly less body weight gain compared to the high-fat diet-induced obese rat, with a weight gain similar to that of the NDO rat, which might be due to compensatory reduced eating of a high-energy-dense, high-fat diet.[11]
The ARC plays a crucial role in regulating energy homeostasis and body weight. It contains two distinct populations of neurons with opposing functions: the anorexigenic POMC neurons and the orexigenic agouti-related peptide (AgRP) neurons. These neurons integrate peripheral signals such as leptin, insulin and ghrelin to modulate food intake and energy expenditure. In the context of obesity, dysfunction in the ARC neuronal circuits can lead to an imbalance in energy regulation, contributing to weight gain. For example, decreased POMC activity or increased AgRP activity can promote overeating and obesity. In addition, chronic inflammation in the ARC, characterised by increased levels of pro-inflammatory cytokines, has been implicated in the development of obesity-related complications such as insulin resistance and metabolic syndrome. Overall, the ARC plays a pivotal role in the regulation of energy balance and inflammation, making it a key target for understanding and potentially treating obesity and related metabolic disorders. Leptin is an important hormone that regulates energy balance by acting on POMC and AgRP neurons in the ARC. Chronic consumption of a high-fat diet can lead to leptin resistance, where the brain becomes less responsive to leptin’s signals. This can disrupt the balance between POMC and AgRP neurons, leading to increased food intake and weight gain. In addition to leptin, a high-fat diet can also directly affect the inflammatory status of the ARC. High-fat diets have been shown to induce low-grade inflammation in the hypothalamus, including the ARC, which can further impair ARC function and exacerbate metabolic dysfunction.
We found that plasma fasting insulin was significantly higher in high-fat diet obese rats compared to normal rats, but fasting blood glucose and the area under the curve of the OGTT and HOMA score were not significantly different between groups. This suggests that high-fat diet-induced obese rats became hyperinsulinaemic before developing hyperglycaemia and insulin resistance. This early stage of glucose intolerance may involve hyperinsulinaemia as the first protective compensatory response to the high-fat diet. Mehran et al. (2012)[21] reported that initially, limited hyperinsulinaemia serves as a protective adaptation to high-fat DIO, and in later stages, circulating hyperinsulinaemia drives DIO and its complications. In addition, we observed that the high-fat diet group consumed more diet compared to the normal diet group rats.[22] Changes in the feeding behaviour of rats were also reflected in the fasting plasma leptin level, with significantly higher levels observed in HFDO rats compared to control rats. This suggests that inflammatory cytokines induced leptin resistance in the brains of HFDO rats, although this is not the only mechanism. Other adipokines or gut peptides may be involved in the altered feeding behaviour of high-fat diet-induced obese rats. Furthermore, in addition to fasting plasma blood glucose levels, glucose levels after OGTT suggested a prediabetic condition in high-fat diet-induced obese rats. However, we did not find any differences amongst the groups, which may be because ten days are not sufficient for rats to develop glucose intolerance with a high-fat diet.[23]
Recent evidence of cell-mediated tissue inflammation in the hypothalamus includes reactive gliosis and neuronal injury, especially in the ARC.[24] Our RT-PCR results showed a significant change in genomic expression of IL-6, EMR-1, NFKBIA and CD-68 in NDO rats compared to NDOR. Hypothalamic inflammation in high-fat diet-induced obese rats is transient in nature. In the initial phase, inflammation is countered by neuroprotective mechanisms in the brain. Thaler et al. (2012)[13] demonstrated similar neuronal injury in the medio-basal hypothalamus in human subjects using MRI studies. Genomic expression of inflammatory markers mRNA, such as NFKBIA and IL-6, suggests that a higher level of inflammation in the ARC might be due to the consumption of a saturated fatty acid-rich diet. Reginato et al. (2021)[25] have shown that the consumption of a saturated fatty acid-rich diet activates the TLR-4 signalling pathway, leading to endoplasmic reticulum injury, in situ activation of inflammatory pathways and, ultimately, neuronal apoptosis. We found increased expression of CD-68 and EMR-1 in the ARC of HFDO rats, suggesting the activation of pro-inflammatory microglia. Dietary excess activates proinflammatory microglia and leads to gliosis in the medio-basal hypothalamus and weight gain in mice. From an evolutionary perspective, the immune response to high-fat or high-energy diets is important for protecting the host from pathogens present in high-sugar food.[26] This metabolic immune response is evident due to the presence of TLR-4, which is a receptor for both pathogens and fatty acids, indicating that the consumption of high-energy-dense food triggers this metabolic immune response and serves to protect against pathogens.[27]
Similarly, several studies have reported that oxidative damage plays an important role in the development of hypothalamic inflammation, and supplementation with antioxidants or unsaturated fatty acids has been shown to reduce hypothalamic inflammation.[28-30] In our study, we observed higher production of ROS (H2O2) in the ARC, which regulates hunger and satiety.[31] Therefore, if signalling neurons in the ARC are affected, it can disturb energy homeostasis. In addition, we observed a trend towards lower levels of GSH, GPx and SOD in HFDO rats. Although this trend may be due to the short duration of high-fat diet feeding in rats, it indicates oxidative damage in the ARC.
CONCLUSION
Based on our findings, we can conclude that short-term consumption of a high-fat diet can induce neuroinflammation and oxidative stress in the ARC of rats. Our study revealed increased levels of inflammatory markers and ROS, along with decreased levels of antioxidants, in the ARC of rats fed a high-fat diet. In addition, we observed that obese-prone rats exhibited hyperinsulinaemia and hyperleptinaemia after only ten days of high-fat diet consumption. These results suggest that even a brief exposure to a high-fat diet can disrupt the delicate balance of inflammatory and antioxidant processes in the ARC, a key brain region involved in energy homeostasis. The findings highlight the potential role of diet-induced neuroinflammation and oxidative stress in the development of obesity and related metabolic disorders. Our study contributes to a better understanding of the early mechanisms underlying DIO and its associated metabolic complications. Further research is warranted to explore the long-term effects of high-fat diet consumption on hypothalamic inflammation and oxidative damage, as well as potential therapeutic interventions to mitigate these effects.
Acknowledgment
The author gratefully acknowledges the Research Section.
Ethical approval
The experimental protocol was approved by the Institutional Animal Ethics Committee (IAEC) of the All India Institute of Medical Sciences, New Delhi (15/IAEC-1/2017) dated 31/01/2018.
Declaration of patient consent
Patient’s consent not required as there are no patients in this study.
Conflicts of interest
There are no conflicts of interest.
Use of artificial intelligence (AI)-assisted technology for manuscript preparation
The authors confirm that there was no use of artificial intelligence (AI)-assisted technology for assisting in the writing or editing of the manuscript and no images were manipulated using AI.
Financial support and sponsorship
Research Section, AIIMS, New Delhi.
References
- The worldwide obesity epidemic. Obes Res. 2001;9(Suppl 4):228S-33.
- [CrossRef] [PubMed] [Google Scholar]
- The contribution of genetics and environment to obesity. Br Med Bull. 2017;123:159-73.
- [CrossRef] [PubMed] [Google Scholar]
- Hypothalamic regulation of food intake and clinical therapeutic applications. Arq Bras Endocrinol Metab. 2009;53:120-8.
- [CrossRef] [PubMed] [Google Scholar]
- Insulin action and resistance in obesity and type 2 diabetes. Nat Med. 2017;23:804-14.
- [CrossRef] [PubMed] [Google Scholar]
- Emerging role of the brain in the homeostatic regulation of energy and glucose metabolism. Exp Mol Med. 2016;48:e216.
- [CrossRef] [PubMed] [Google Scholar]
- Impaired adipogenesis and dysfunctional adipose tissue in human hypertrophic obesity. Physiol Rev. 2018;98:1911-41.
- [CrossRef] [PubMed] [Google Scholar]
- Hypothalamic inflammation in obesity and metabolic disease. J Clin Invest. 2017;127:24-32.
- [CrossRef] [PubMed] [Google Scholar]
- Chapter 1 - Oxidative stress and inflammation in obesity and metabolic syndrome In: Del Moral AM, Aguilera García CM, eds. Obesity: Oxidative stress and dietary antioxidants. Cambridge, MA: Academic Press; 2018. p. :1-15.
- [CrossRef] [Google Scholar]
- 2010 High fat diet increases hippocampal oxidative stress and cognitive impairment in aged mice: Implications for decreased Nrf2 signaling. J Neurochem. 2010;114:1581-9.
- [CrossRef] [PubMed] [Google Scholar]
- Differential susceptibility to obesity between male, female and ovariectomized female mice. Nutr J. 2009;8:11.
- [CrossRef] [PubMed] [Google Scholar]
- Increased hypothalamic inflammation associated with the susceptibility to obesity in rats exposed to high-fat diet. Exp Diabetes Res. 2012;2012:e847246.
- [CrossRef] [PubMed] [Google Scholar]
- Low-grade hypothalamic inflammation leads to defective thermogenesis, insulin resistance, and impaired insulin secretion. Endocrinology. 2011;152:1314-26.
- [CrossRef] [PubMed] [Google Scholar]
- Obesity is associated with hypothalamic injury in rodents and humans. J Clin Invest. 2012;122:153-62.
- [CrossRef] [PubMed] [Google Scholar]
- Synaptic input organization of the melanocortin system predicts diet-induced hypothalamic reactive gliosis and obesity. Proc Natl Acad Sci. 2010;107:14875-80.
- [CrossRef] [PubMed] [Google Scholar]
- Selective breeding for diet-induced obesity and resistance in Sprague-Dawley rats. Am J Physiol. 1997;273(2 Pt 2):R725-30.
- [CrossRef] [PubMed] [Google Scholar]
- A simple method for isolation of the anteroventral periventricular and arcuate nuclei of the rat hypothalamus. Int J Exp Clin Anat. 2012;7:48-51.
- [CrossRef] [Google Scholar]
- Catalase In: Bergmeyer HU, ed. Methods of enzymatic analysis (2nd ed). New York: Academic Press; 1974. p. :673-84.
- [CrossRef] [Google Scholar]
- Selenium: Biochemical role as a component of glutathione peroxidase. Science. 1973;179:588-90.
- [CrossRef] [PubMed] [Google Scholar]
- Glutathione S-transferases. The first enzymatic step in mercapturic acid formation. J Biol Chem. 1974;249:7130-9.
- [CrossRef] [PubMed] [Google Scholar]
- Interaction between genes and lifestyle factors on obesity: Nutrition Society Silver Medal Lecture. Proc Nutr Soc. 2008;67:1-8.
- [CrossRef] [PubMed] [Google Scholar]
- Hyperinsulinemia drives diet-induced obesity independently of brain insulin production. Cell Metab. 2012;16:723-37.
- [CrossRef] [PubMed] [Google Scholar]
- Hypothalamic proinflammatory lipid accumulation, inflammation, and insulin resistance in rats fed a high-fat diet. Am J Physiol Endocrinol Metab. 2009;296:E1003-12.
- [CrossRef] [PubMed] [Google Scholar]
- Reduced central leptin sensitivity in rats with diet-induced obesity. Am J Physiol Regul Integr Comp Physiol. 2002;283:R941-8.
- [CrossRef] [PubMed] [Google Scholar]
- Hypothalamic inflammation and gliosis in obesity. Curr Opin Endocrinol Diabetes Obes. 2015;22:325-30.
- [CrossRef] [PubMed] [Google Scholar]
- The role of fatty acids in ceramide pathways and their influence on hypothalamic regulation of energy balance: A systematic review. Int J Mol Sci. 2021;22:5357.
- [CrossRef] [PubMed] [Google Scholar]
- Microglial inflammatory signaling orchestrates the hypothalamic immune response to dietary excess and mediates obesity susceptibility. Cell Metab. 2017;26:185-97.e3.
- [CrossRef] [PubMed] [Google Scholar]
- Transgenic mice with astrocyte-targeted production of interleukin-6 are resistant to high-fat diet-induced increases in body weight and body fat. Brain Behav Immun. 2010;24:119-26.
- [CrossRef] [PubMed] [Google Scholar]
- Acute effects of fatty acids on autophagy in NPY neurones. J Neuroendocrinol. 2020;32:e12900.
- [CrossRef] [PubMed] [Google Scholar]
- Supplementation of lycopene attenuates oxidative stress induced neuroinflammation and cognitive impairment via Nrf2/NF-kB transcriptional pathway. Food Chem Toxicol. 2017;109:505-16.
- [CrossRef] [PubMed] [Google Scholar]
- Soy isoflavones improve the oxidative stress induced hypothalamic inflammation and apoptosis in high fat diet-induced obese male mice through PGC1-alpha pathway. Aging (Albany NY). 2020;12:8710-27.
- [CrossRef] [PubMed] [Google Scholar]
- Peripheral signals conveying metabolic information to the brain: Short-term and short-term regulation of food intake and energy homeostasis. Exp Biol Med (Maywood NJ). 2002;226:963-77.
- [CrossRef] [PubMed] [Google Scholar]


